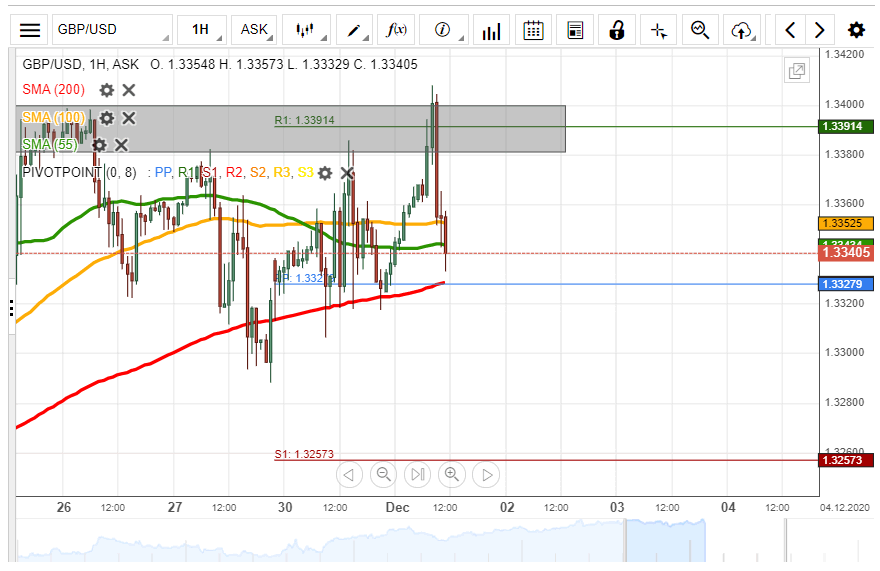
The GBP/USD ended trading sideways between the simple moving averages by surging. The surge resulted in two tests of the resistance zone that is located from 1.3380 to 1.3400. The attempts to pass the resistance zone was supported by the 200-hour simple moving average.
In theory, the rate should continue to bounce between the 200-hour SMA and the resistance zone until the 200-hour SMA moves higher. In this case scenario, the SMA would push the rate through the resistance zone and it could reach for the weekly R2 simple pivot point at 1.3462.
On the other hand, the SMA might fail and in this case, the rate could find some support in the 55 and 100-hour SMAs and the weekly simple pivot point at 1.3328. However, note that the two SMAs should in theory move up faster than the 200-hour SMA. If these support levels fail, the rate could reach for the weekly S1 pivot point at 1.3257