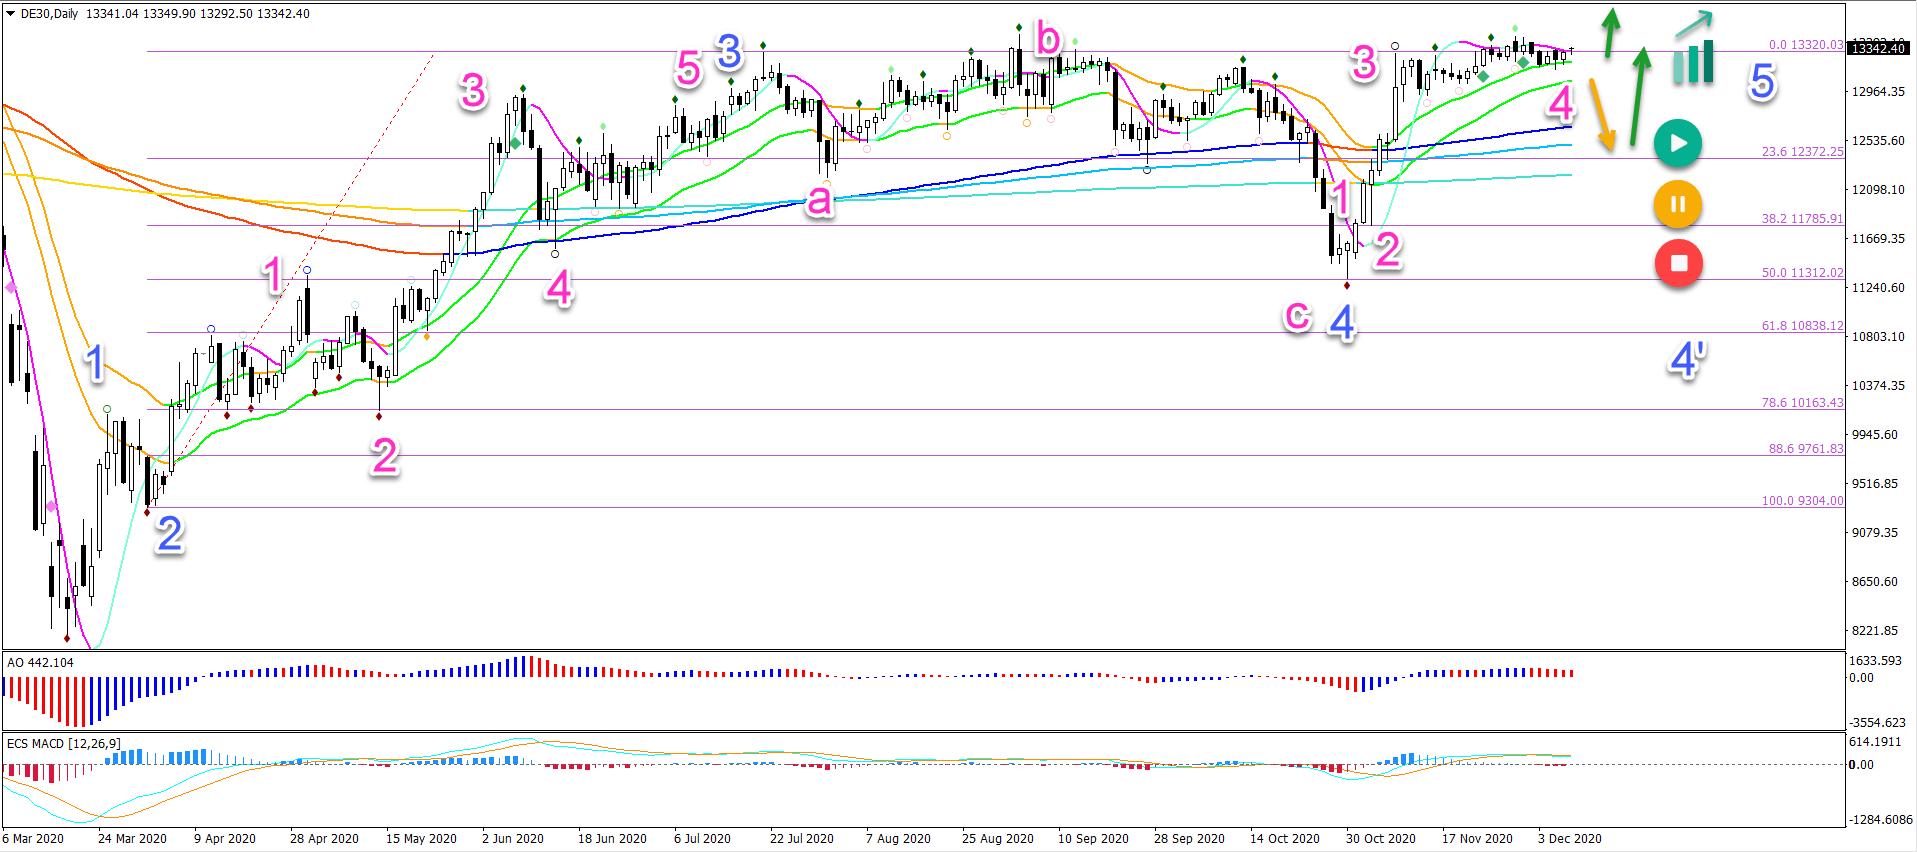
German stock index DAX 30 has broken above the 21 ema zone again. This occurred after price bounced strongly at the 50% Fibonacci support level.
The DAX 30 seems to have completed an ABC (pink) pattern within the wave 4 (blue) at the 50% Fibonacci level.
The final push above the last resistance trend line could create a strong surge upwards. Because this price swing is likely a wave 3 (purple).
Are the bulls ready for another breakout? Let’s review the chart and wave patterns.
Price Charts and Technical Analysis
The bullish bounce suggests that price action is now in a wave 5 (blue):
A bullish breakout (green arrow) would confirm the uptrend continuation.
Also a shallow pullback (orange arrow) and bounce (green arrow) confirms an uptrend.
Only a deeper retracement (yellow-red) indicates that the wave 4 (blue 4’) is still ongoing.
The bullish targets are aligned at 13,700 and 14,250.
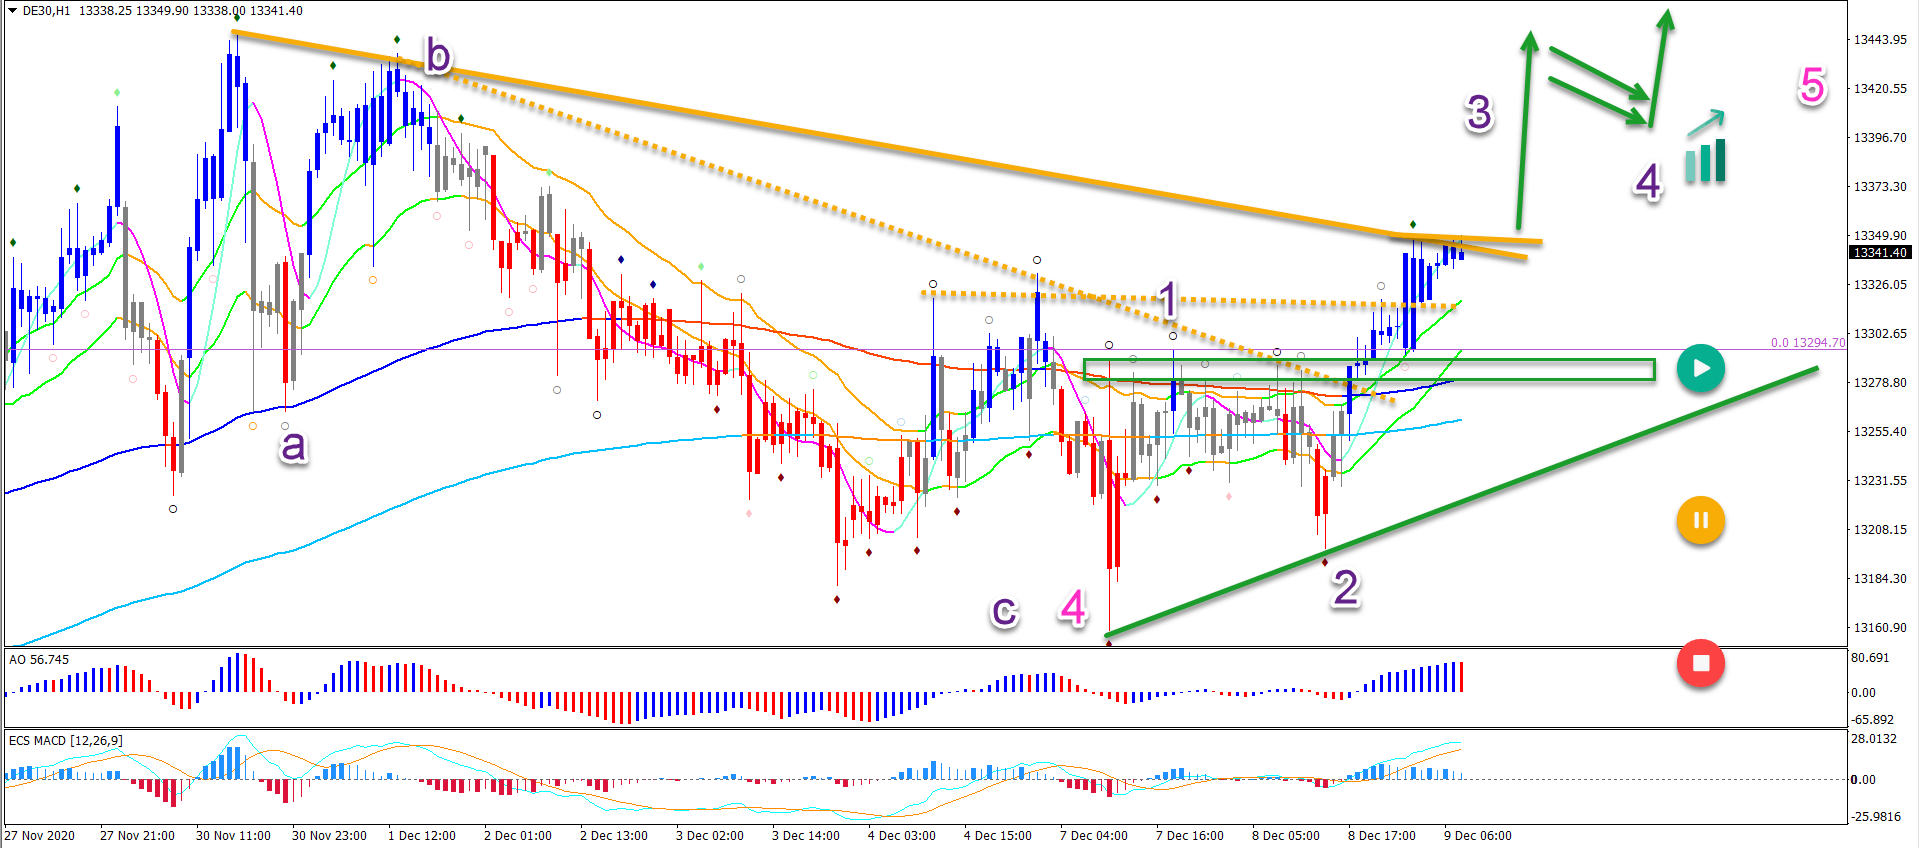
On the 1 hour chart, we see that the wave 4 (pink) of a lower degree seems completed at the recent low. Price action is building bullish momentum as it breaks above the long-term moving averages and trend lines.
The final push above the last resistance trend line could create a strong surge upwards. Because this price swing is likely a wave 3 (purple).
Eventually, a pullback within wave 4 should occur. This could be, for instance, a triangle pattern or bull flag pattern.