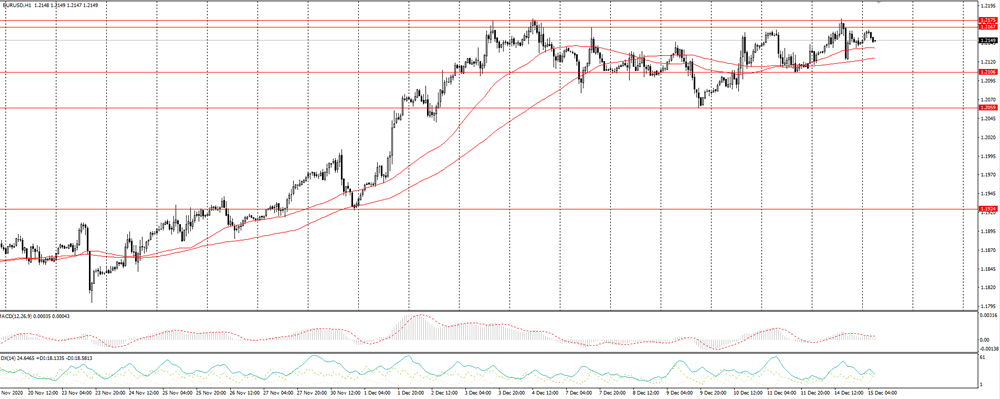
The EUR/USD currency pair
Technical indicators of the currency pair:
Prev Open: 1.2118
Prev Close: 1.2143
% chg. over the last day: +0.21%
On Monday, EUR/USD reached the upper border of the range but failed to break through it. Information for the foreign exchange market is received in different directions. On the one hand, there are positive aspects like the improvement of the state of the manufacturing sector. On the other hand, there are new restrictive measures due to the coronavirus pandemic. The pair cannot choose the direction and remains in the sideways range for now.
Trading recommendations
Support levels: 1.2106, 1.2059
Resistance levels: 1.2175, 1.2167
The main scenario: working in a narrow range, but selling seems more interesting. Technical indicators and fundamental background are still on the side of the bulls, but the second reach of the annual maximum and the pullback should alert buyers. A “double top” pattern appeared on the chart, which indicates a possible correction. The ADX trend strength indicator started to weaken, and the MACD is already showing the third divergence. We expect the pair to remain between 1.2175 and 1.2106 during the day, but there is a possibility of a breakout to 1.2059.
Alternative scenario: if the price fixes above the level of 1.2175, the growth is likely to continue.
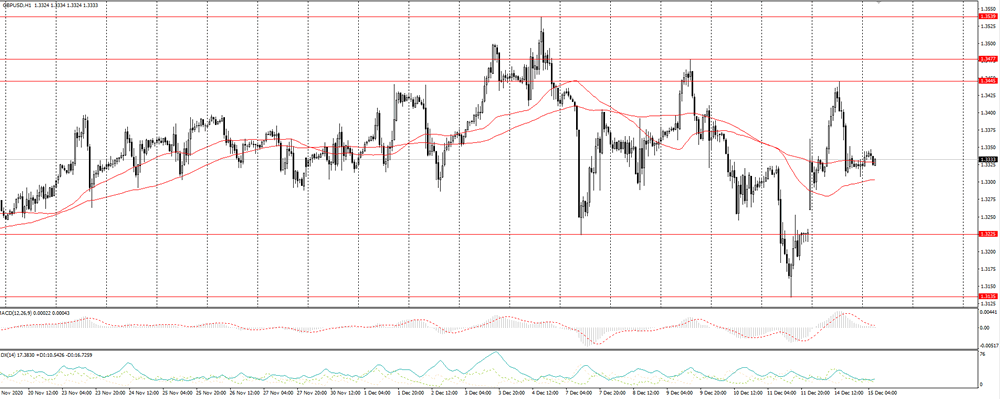
The GBP/USD currency pair
Technical indicators of the currency pair:
Prev Open: 1.3260
Prev Close: 1.3324
% chg. over the last day: +0.48%
On Monday, the sterling demonstrated ambivalent dynamics. Having closed the day in a positive zone, it left a long shadow at the top of the D1 timeframe. This indicates that our assumptions were correct. Getting around to the Brexit negotiations does not change anything for investors. The tension remains due to uncertainty, and any growth of the pair will remain limited for now.
Trading recommendations
Support levels: 1.3225, 1.3196
Resistance levels: 1.3407, 1.3477
The main scenario: risk-averse buying on a decline. As long as the price is above SMA 50 and SMA 100, the likelihood of continued growth is bigger. However, the northern movement is likely to be limited by the first resistance level, as the ADX indicator reacted to yesterday’s upward impulse with a very slow rise. At the same time, the MACD demonstrated convergence, and this is already a signal about the possibility of the sterling to break the upper level.
Alternative scenario: if the price fixes below 1.3303, the bullish impetus will be lost and we can consider selling the pair.
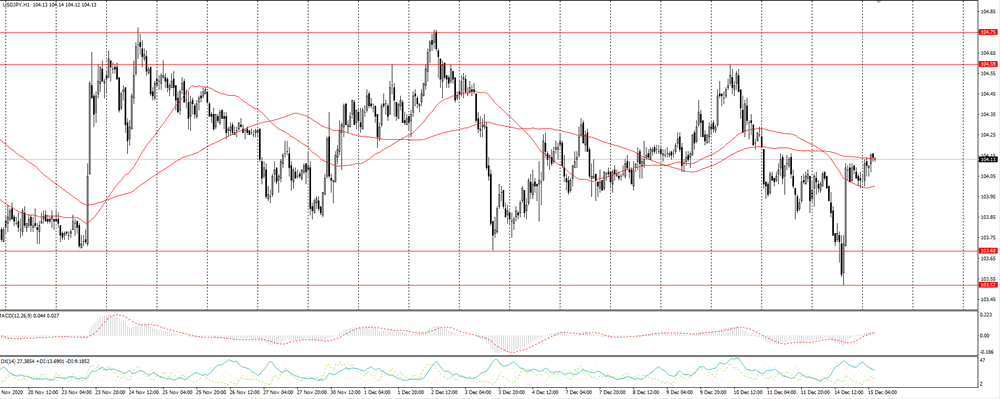
The USD/JPY currency pair
Technical indicators of the currency pair:
Prev Open: 104.05
Prev Close: 104.03
% chg. over the last day: -0.01%
On Monday, trading closed slightly lower. The pair managed to break through the lower border of its range but quickly rebounded in the opposite direction. The daily chart left a long shadow at the bottom, which indicates a possibly strong buying activity near the price level of 103.50.
Trading recommendations
Support levels: 103.68, 103.52
Resistance levels: 104.59, 104.74
The main trading scenario: trading in a sideways range between the levels of 104.59 and 103.68. Although the pair was able to break through the range of Monday, there was a quick return of the price to the moving averages SMA 50 and SMA 100. The ADX demonstrated no reaction to the downward movement, while the MACD remained in the positive zone.
An alternative scenario assumes a break-through to 103.52 and a fall to 103.19.
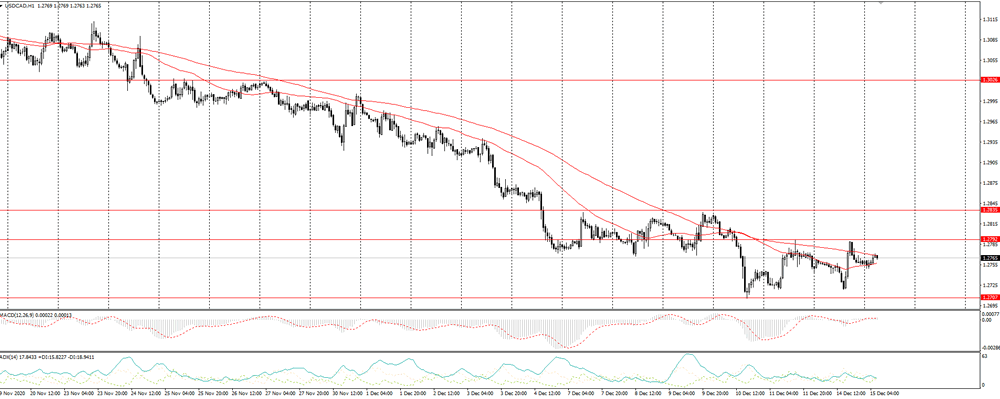
The USD/CAD currency pair
Technical indicators of the currency pair:
Prev Open: 1.2768
Prev Close: 1.2760
% chg. over the last day: -0.06%
Oil continues to support the Canadian dollar. It seems that this commodity currency is not going to retreat, as “black gold” has consolidated above the opening level of last week. Brent quotes reached February values this year. Against this backdrop, buying remains dangerous and any northern pullback could be an opportunity for short positions.
Trading recommendations
Support levels: 1.2707, 1.2528
Resistance levels: 1.2792, 1.2835, 1.2886
Consider trading in a sideways range between 1.2792 and 1.2707. It looks like the pair isn’t moving southward, but simply changed the area of consolidation. The price is trading near the moving averages, while the oscillators are near zero value. This is a sign of continued trading near the current quotes. Most likely, this trend will extend until the Fed meeting on Wednesday.
Alternative scenario: if the price manages to return above 1.2792, the south trend will be broken and a buy signal will appear towards the level of 1.2886. A break-through at 1.2707 could signal further decline towards 1.2528.