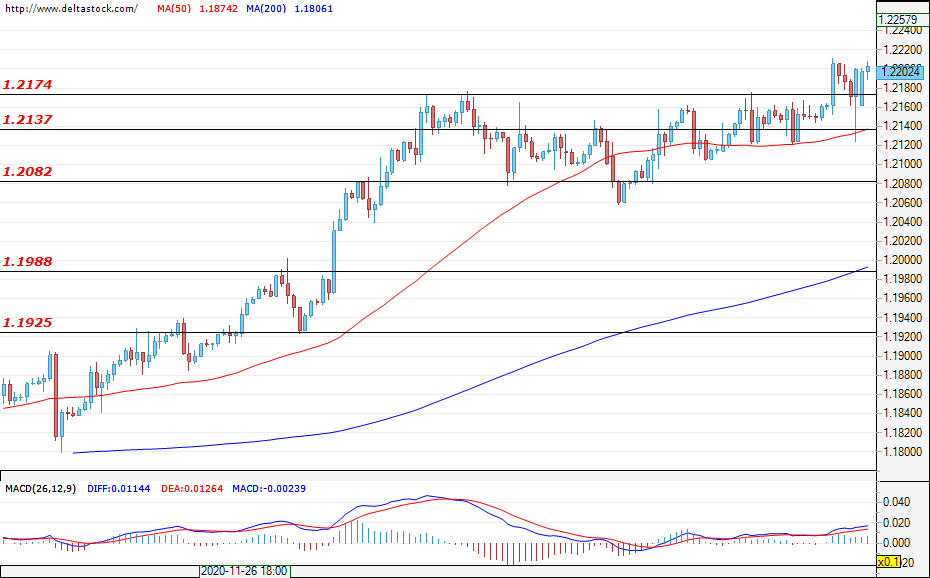
EUR/USD
Current level – 1.2202
During yesterday’s session, the main cause behind the increased market volatility was the FED’s interest rate decision and the press-conference that followed. The currency pair gained quite a bit of ground as the dollar fell and, at the time of writing, it is trading above the major resistance zone at 1.2174. The positive sentiment is intact and a rally towards the next target at 1.2240 is currently the most probable scenario. In the unlikely case of a deeper sell-off, this rally should be limited to 1.2080. Today, investors will be keeping an eye on the Eurozone Consumer Price Index data (10:00 GMT) and on the U.S. Initial Jobless Claims (13:30 GMT).
| Resistance | Support | ||
| intraday | intraweek | intraday | intraweek |
| 1.2240 | 1.2300 | 1.2174 | 1.2082 |
| 1.2270 | 1.2340 | 1.2137 | 1.1988 |
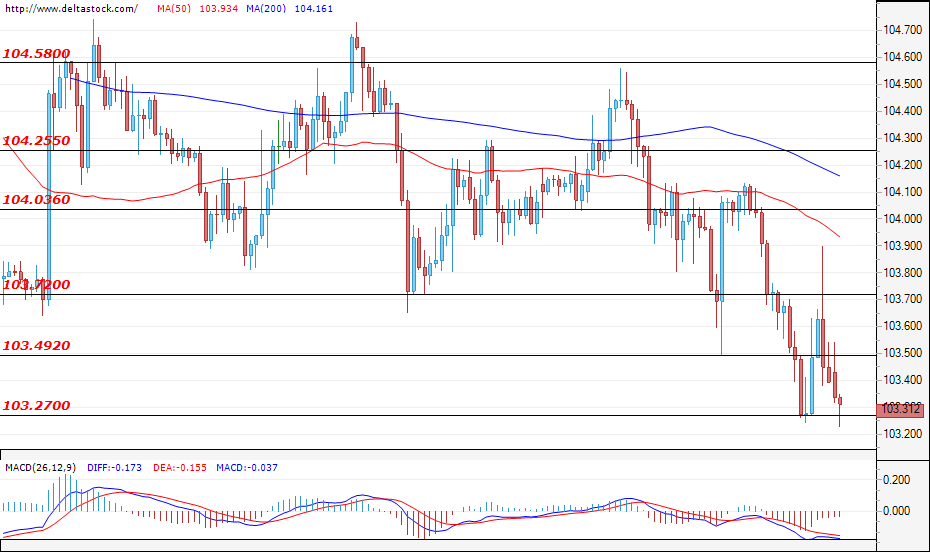
USD/JPY
Current level – 103.31
The retracement was limited to just below the resistance level at 104.03 and the USD started to lose ground once again as a direct result from Jerome Powell’s comments. The price dropped and reached the support zone at 103.27, thus signalling for a continued weakening of the dollar, which could lead to a violation of the aforementioned level of support. During today’s trading session, there is a chance we might see another corrective move unfold, but it should be limited to the resistance at 103.72.
| Resistance | Support | ||
| intraday | intraweek | intraday | intraweek |
| 103.49 | 104.03 | 103.27 | 102.20 |
| 103.72 | 104.25 | 102.20 | 101.10 |
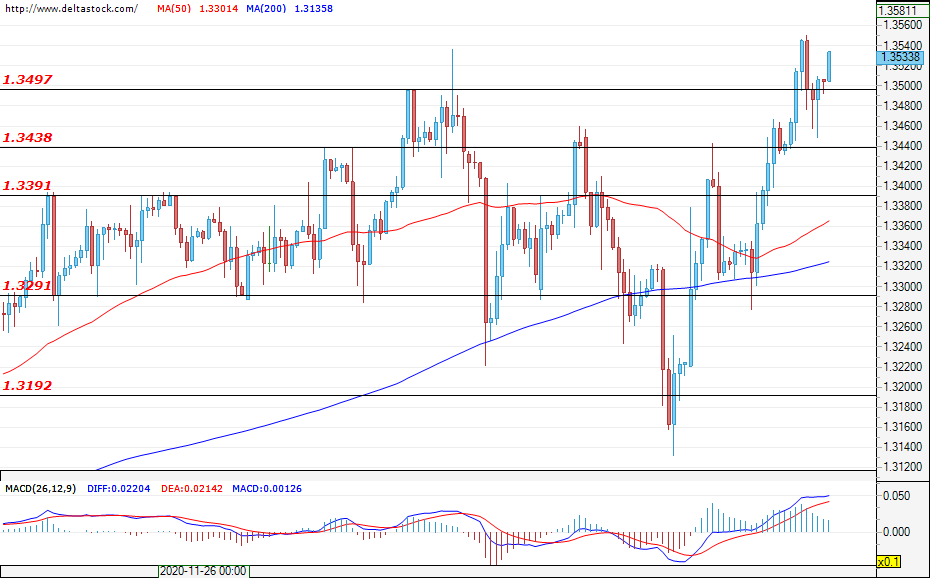
GBP/USD
Current level – 1.3533
The GBP continues to gain ground against the USD after the pair violated the major resistance zone at 1.3497. The most probable scenario is for a rally towards the 2018 March highs of around 1.3612. In the negative scenario, in which talks between the EU and the UK deteriorate, the Cable will most probably lose momentum and head towards the support at 1.3438. Volatility should increase after the Bank of England’s Interest rate decision is announced today at 12:00 GMT.
| Resistance | Support | ||
| intraday | intraweek | intraday | intraweek |
| 1.3605 | 1.3770 | 1.3497 | 1.3291 |
| 1.3700 | 1.3800 | 1.3438 | 1.3192 |