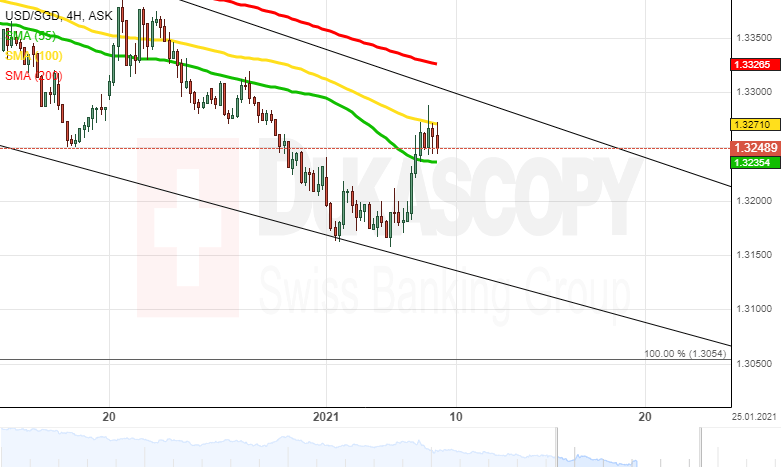
Since the end of October, the USD/SGD currency pair has been trading downwards within a falling wedge pattern.
From a theoretical point of view, it is likely that the exchange rate could continue to decline within the predetermined pattern within the following trading sessions. Then, a breakout north could occur, and the rate could target the Fibo 38.20% at 1.4035.
Meanwhile, note that the currency pair is pressured by the 55-, 100– and 200-period moving averages near 1.3240/1.3330 range. Thus, some downside potential could continue to prevail in the market.