FedEx Corporation (FDX) has recently retraced to and bounced at the 38.2% Fibonacci retracement level.
This analysis reviews the potential wave and chart patterns connected to a 38.2% Fib bounce. We also pinpoint the best target for the upcoming few trading week.
Price Charts and Technical Analysis
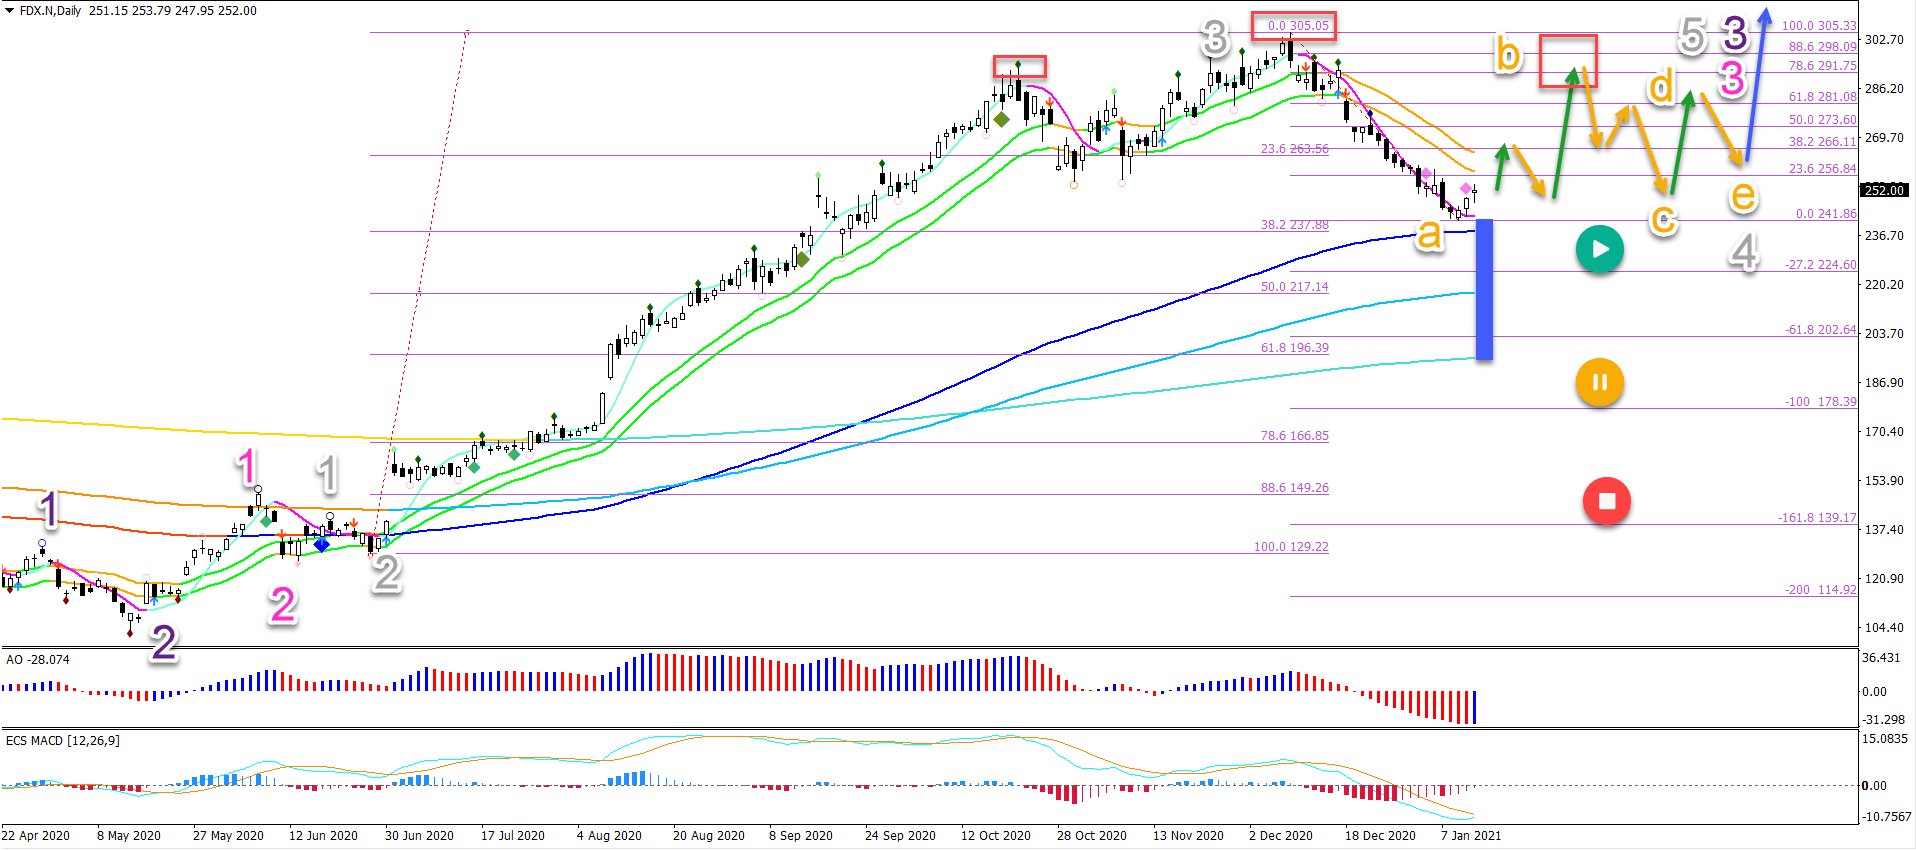
The FDX daily chart has retraced down to the 38.2% Fibonacci and 144 ema zone. But the overall trend is strongly up. We can see this simply by adding long-term moving averages (blue box).
The quick pace of the decline, however, does indicate that the retracement is likely to be lengthy or deeper than usual for a wave 4 (grey). Here is what to expect, starting with the most likely:
- An ABCDE triangle chart pattern (as shown in the image).
- An ABC bull flag pattern.
- An ABC zigzag pattern.
Although price action made a strong decline, a bullish bounce back towards the deep Fibonacci levels and previous top is likely to occur within a wave B (orange). The main target zone is therefore around $292-$305 for the short-term.
At the moment, a bearish bounce is expected at the target zone to create a wave C (orange). Eventually a new high is expected at around $350 once the triangle is completed (blue arrow).
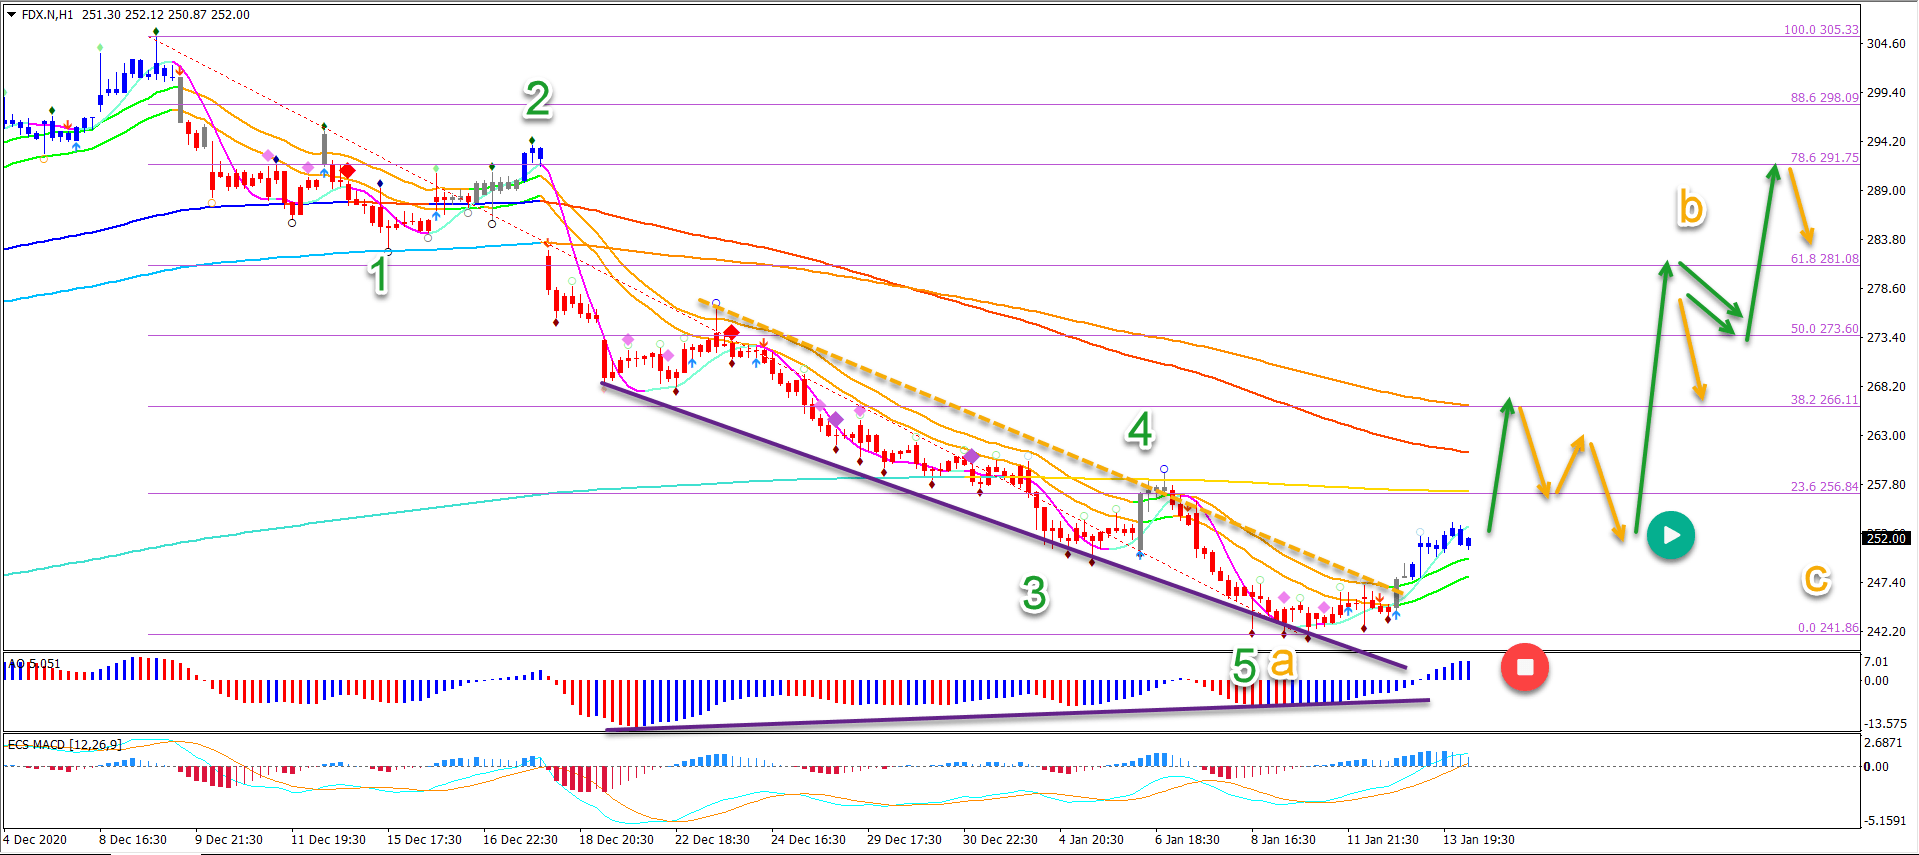
On the 1 hour chart, we already see blue Elliott Wave candles emerge. This is indicating the potential start of the bullish run in wave B (orange).
The first target is the 38.2% Fib zone and long-term moving averages. Here we expect a bounce down and a higher low before a new bullish swing up again.