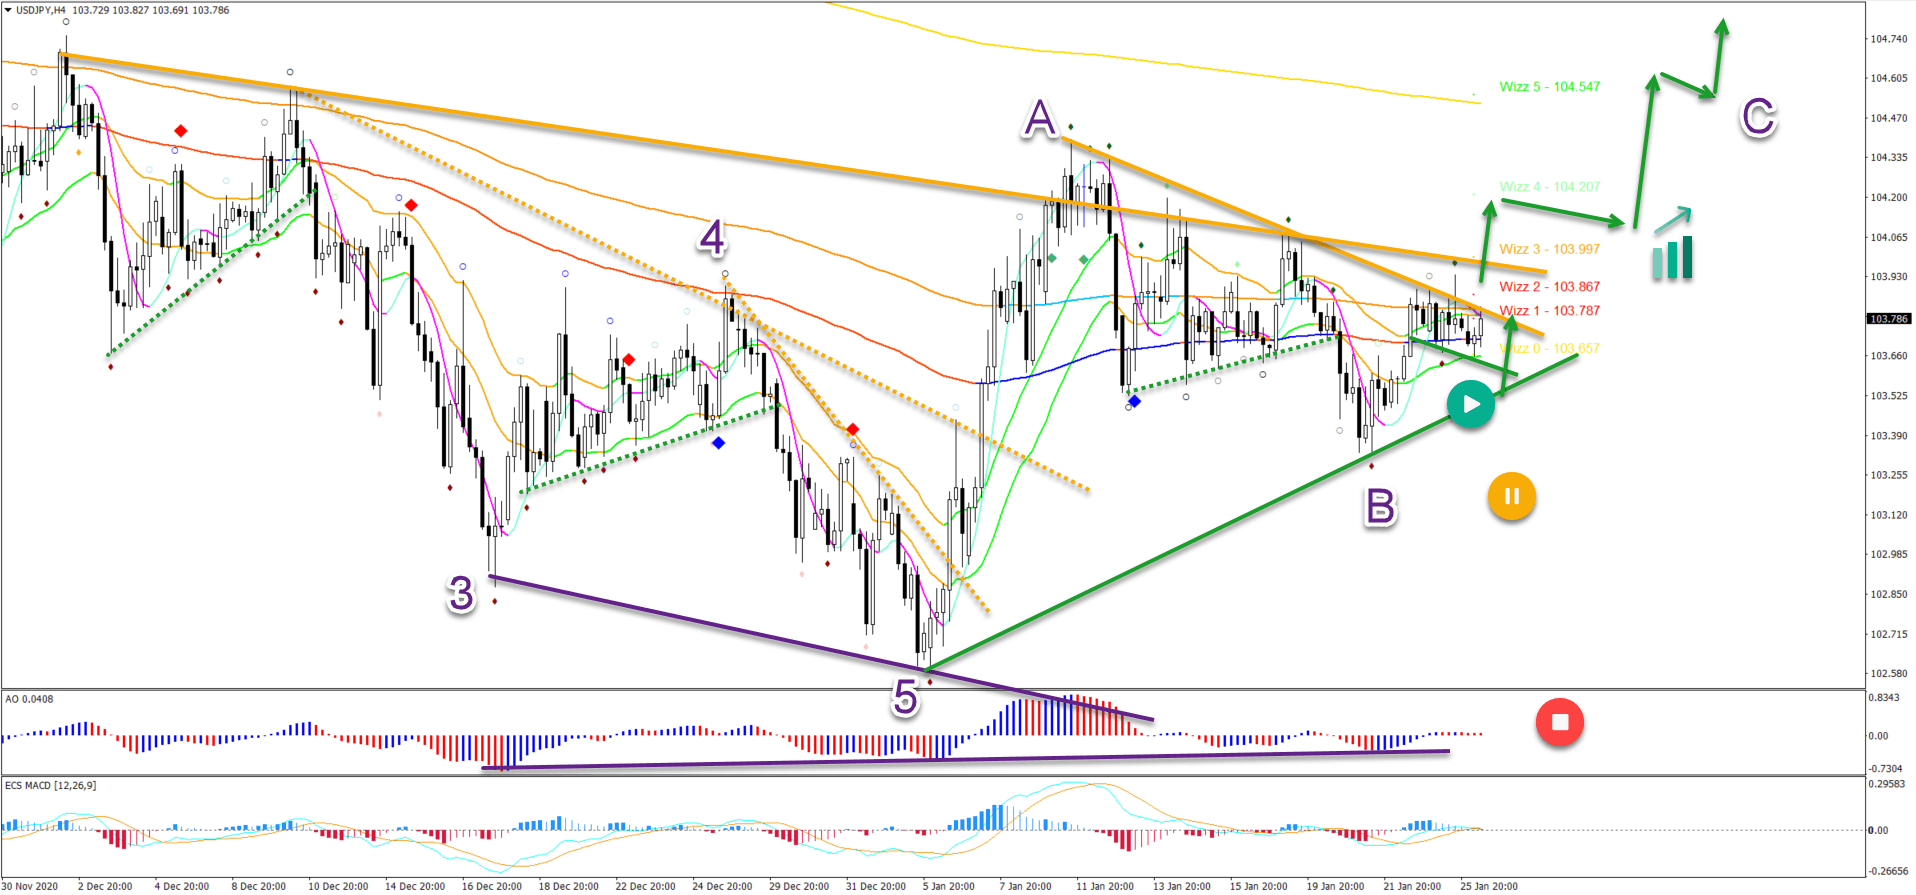
USD/JPY looks ready for a bullish reversal after a long-term downtrend. Why? Price action completed a bearish 5 wave pattern at the recent low (purple).
The bearish pullback has been mild and choppy. This is confirming a typical wave B (purple) of a larger ABC zigzag pattern (purple).
The current upside seems to have 5 waves (grey) in wave 1 (pink). An immediate bullish breakout (green arrows) confirms the wave 3 (pink).
Price action completed a bearish 5 wave pattern at the recent low (purple). Also, the bulls showed strong momentum at the start of the year 2021.
Price Charts and Technical Analysis
The USD/JPY is showing numerous bullish reversal signals:
Divergence pattern between the bottoms (purple line).
Completed 5 bearish waves.
Confirmed a falling wedge chart pattern.
After that, the reversal signals created a large price movement up. This price swing showed strong bullish momentum (wave A).
The pullback has been mild and choppy. This is confirming a typical wave B (purple) of a larger ABC zigzag pattern (purple).
The confirmation of the ABC zigzag is when price action is able to break (green arrows) above the resistance trend lines (orange). Also a bullish bounce (green circle) could confirm the bullishness.
Only a deep retracement lower would pauze the bullish expectations. A break below the current bottom of wave B (orange circle) is a warning but only a break below the wave 5 bottom invalidates it (red circle).
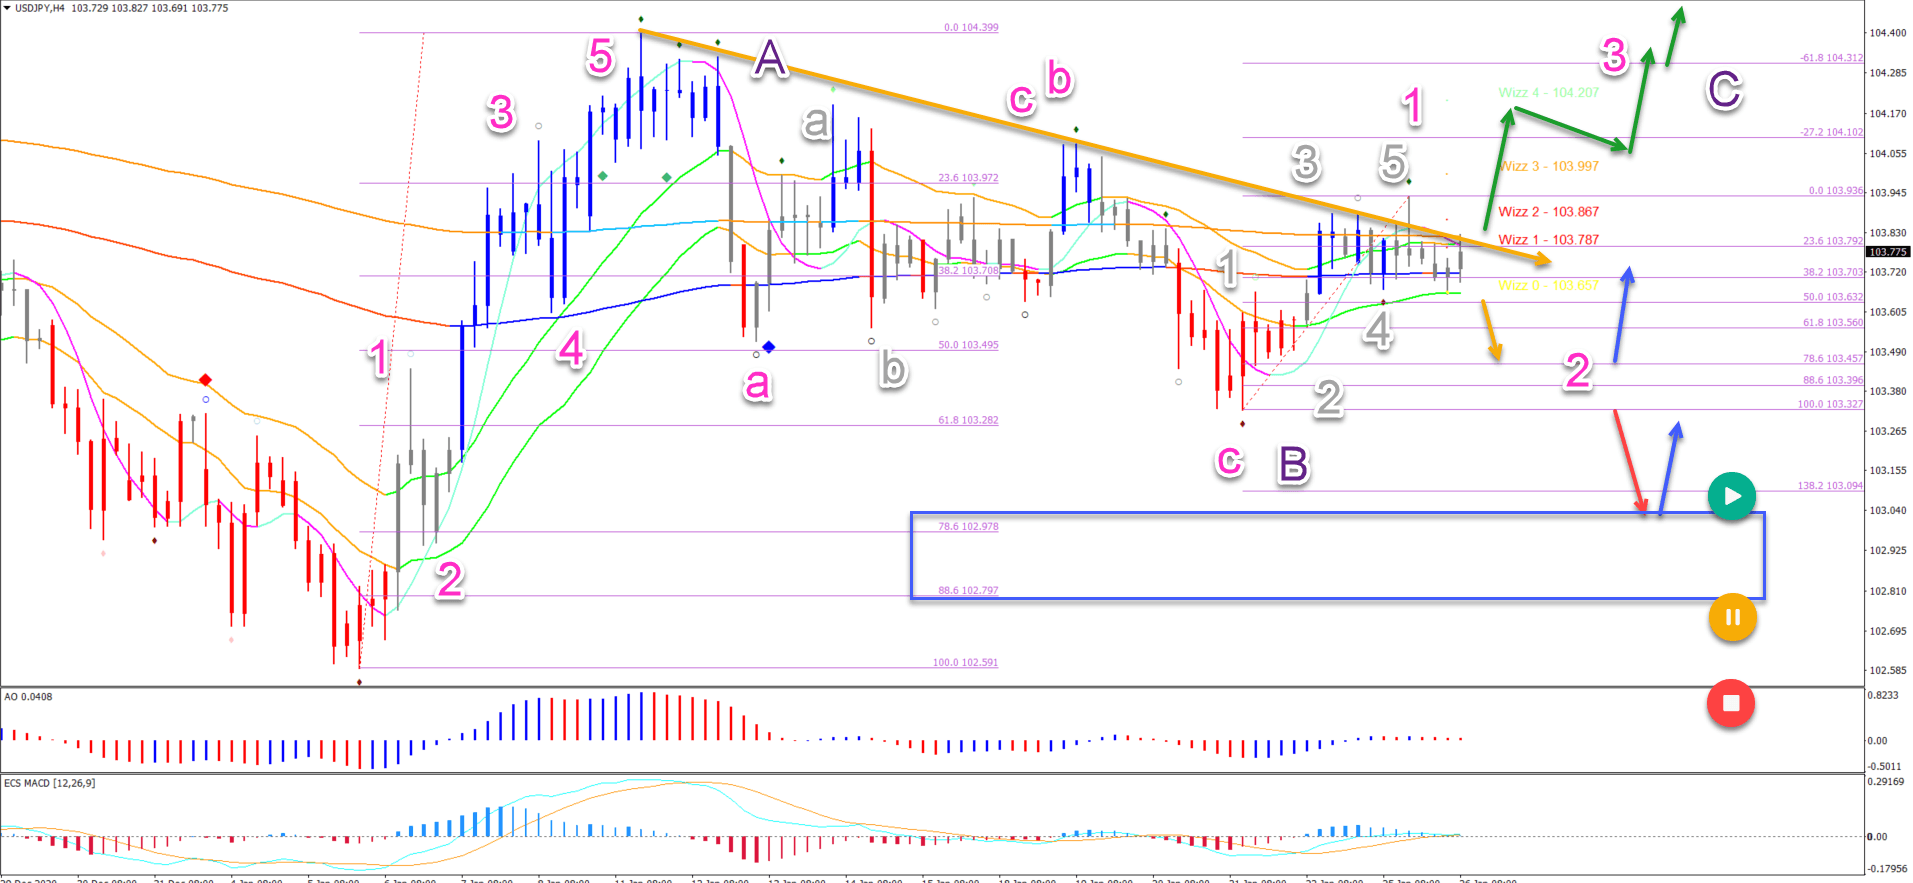
In the image below, we see that price action has built 5 bullish waves (pink) within wave A (purple). It was followed by a bearish ABC (pink) correction.
The current upside seems to have 5 waves (grey) in wave 1 (pink). An immediate bullish breakout (green arrows) confirms the wave 3 (pink).
A retracement (orange arrow) could indicate a deeper wave 2 (pink) as long as price action stays above the 100% FIb. A deeper bearish breakout (red arrow) could test the deeper Fibonacci levels (blue box) for a bounce up.
A break below the bottom and deep Fibs invalidates the upside outlook (red circle).