
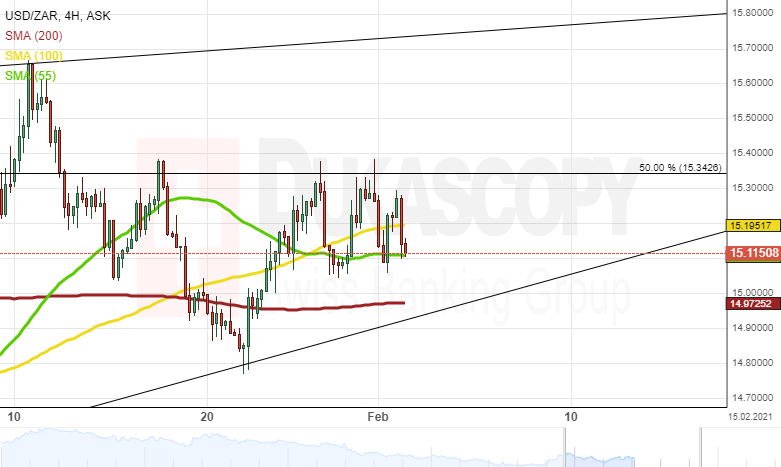
Since the beginning of December, the USD/ZAR currency pair has been trading within a rising wedge pattern.
From a theoretical point of view, it is likely that the exchange rate could continue to move within the predetermined pattern until the beginning of March. Then, a breakout south could follow.
In the meantime, note that the rate could gain support from the 55-, 100– and 200-period moving averages in the 15.00/15.20 range. Thus, a breakout north could occur, and the pair could try to exceed the Fibo 38.20% at 16.25.


