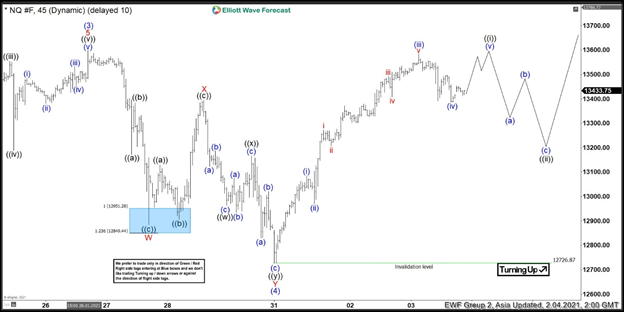
Short Term Elliott Wave View in Nasdaq (NQ) suggests the rally to 13599.75 ended wave (3). Pullback in wave (4) ended at 12726.87. The internal subdivision of wave (4) unfolded as a double three Elliott Wave structure. Down from wave (3) high, wave W ended at 12884.75. The Index then bounced in wave X and ended at 13394. From there, it extends lower in wave Y towards 122726.87. This completed wave (4) at 12726.87.
Index has turned higher in wave (5) although a break above wave (3) at 13599.75 is required to rule out a double correction in wave (4). Up from wave (4) low, wave (i) ended at 13084, wave (ii) ended at 12970.25, wave (iii) ended at 13584.50 and wave (iv) is proposed complete at 13386.75. Expect Index to soon end wave ((i)) with or without another high. It should then pullback in wave ((ii)) to correct cycle from February 1 low before the rally resumes. As far as pivot at 12726.87 low stays intact, expect dips to find support in 3, 7, or 11 swing for more upside.
Nasdaq (NQ) 60 Minutes Elliott Wave Chart