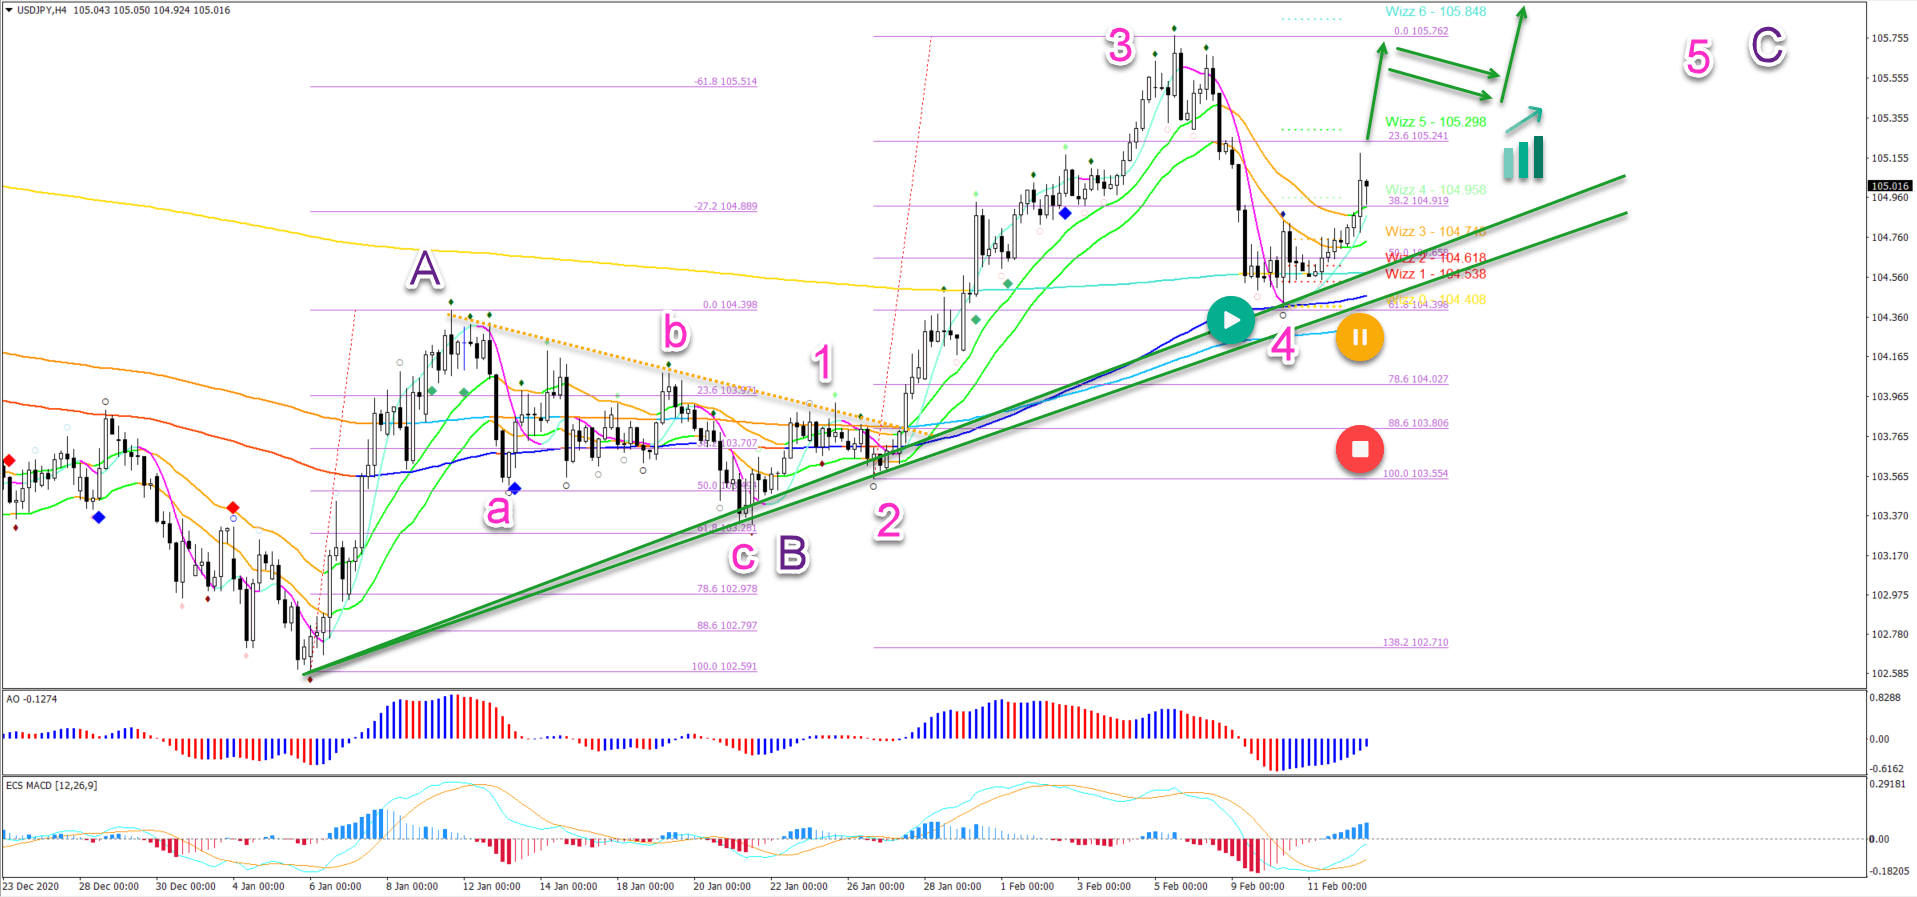
USD/JPY made a bearish retracement after completing a wave 3 or C (pink). But the price is showing a bullish reversal, which could indicate a new uptrend.
The bearish pullback respected the Fibonacci levels and long-term moving averages. This indicates a wave 4 (pink) – even though the retracement was deeper than usual.
A bullish ABC zigzag should take the price higher. The main bullish targets are located at 106.20 and 106.75.
This article reviews the key Fibonacci levels, moving averages, and price patterns.
Price Charts and Technical Analysis
The bullish reversal at support and the break above the 21 ema zone could indicate the start of the wave 5 (pink) of the larger wave C (purple).
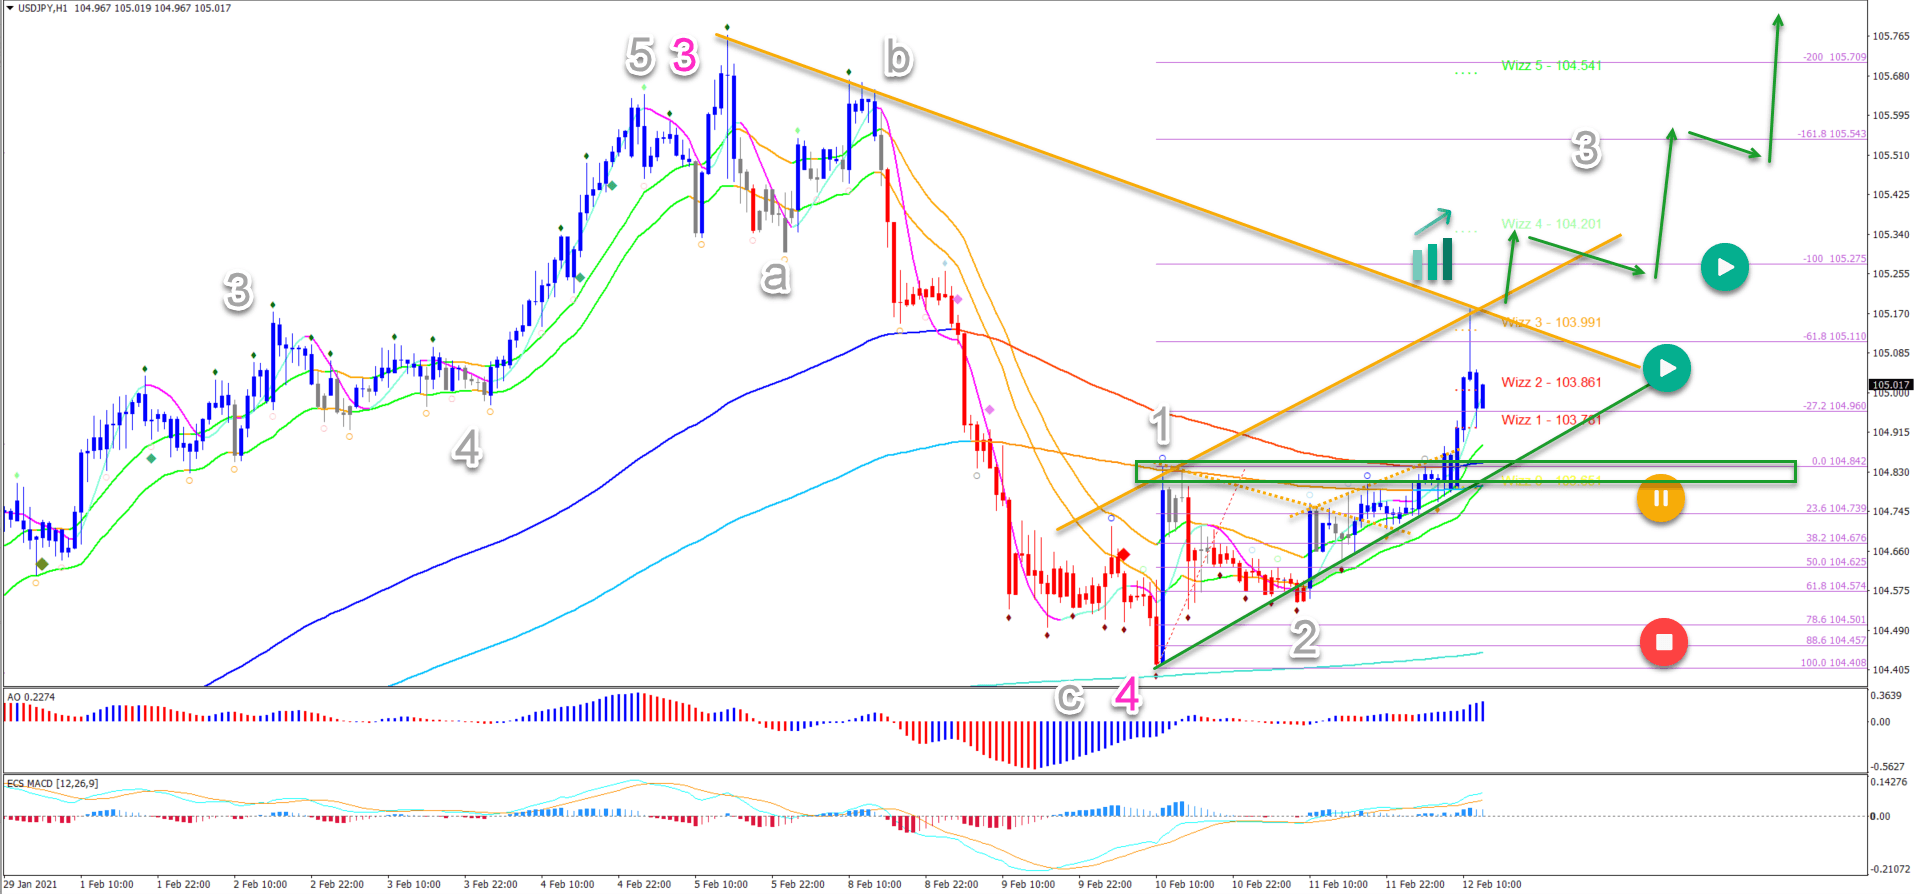
Only a break below the long-term MAs places the uptrend on hold (yellow button). A break below the 88.6% Fib invalidates the uptrend (red button).
On the 1 hour chart, price action is building a higher high and higher low. The bullish trend channel could indicate a 123 (grey) pattern.
But a bullish breakout and shallow pullback is needed to confirm the upside (green arrows). This indicates a potential wave 3 (grey), which needs to hit at least the 161.8% Fib to confirm this wave pattern.
The support zone (green box) is a key decision zone. Price action could break below it and still be bullish as part of another wave 1-2 pattern. But a deeper retracement makes the uptrend unlikely (red circle).