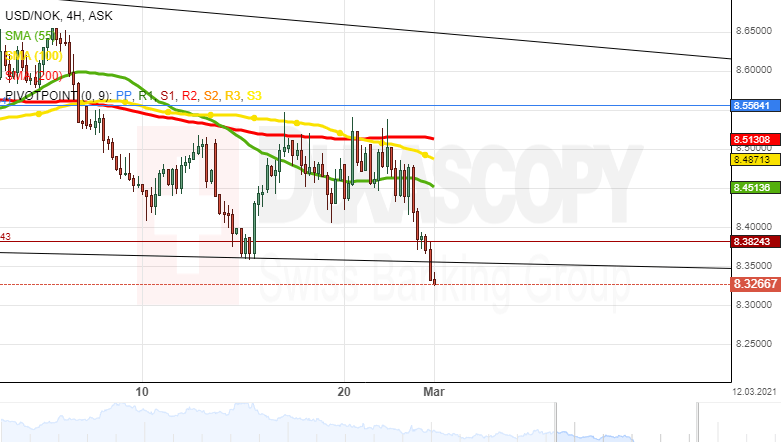
Since the end of December, the USD/NOK exchange rate has been trading within a falling wedge pattern.
From a theoretical perspective, it is likely that the currency pair could continue to follow the predetermined pattern in the medium term. In this case the pair could decline below 8.5000 by the end of April.
In the meantime, note that the exchange rate is pressured by the 55-, 100– and 200-period moving averages in the 8.5000 area. Thus, a breakout south could occur, and the rate could 8.2000/8.3000.