
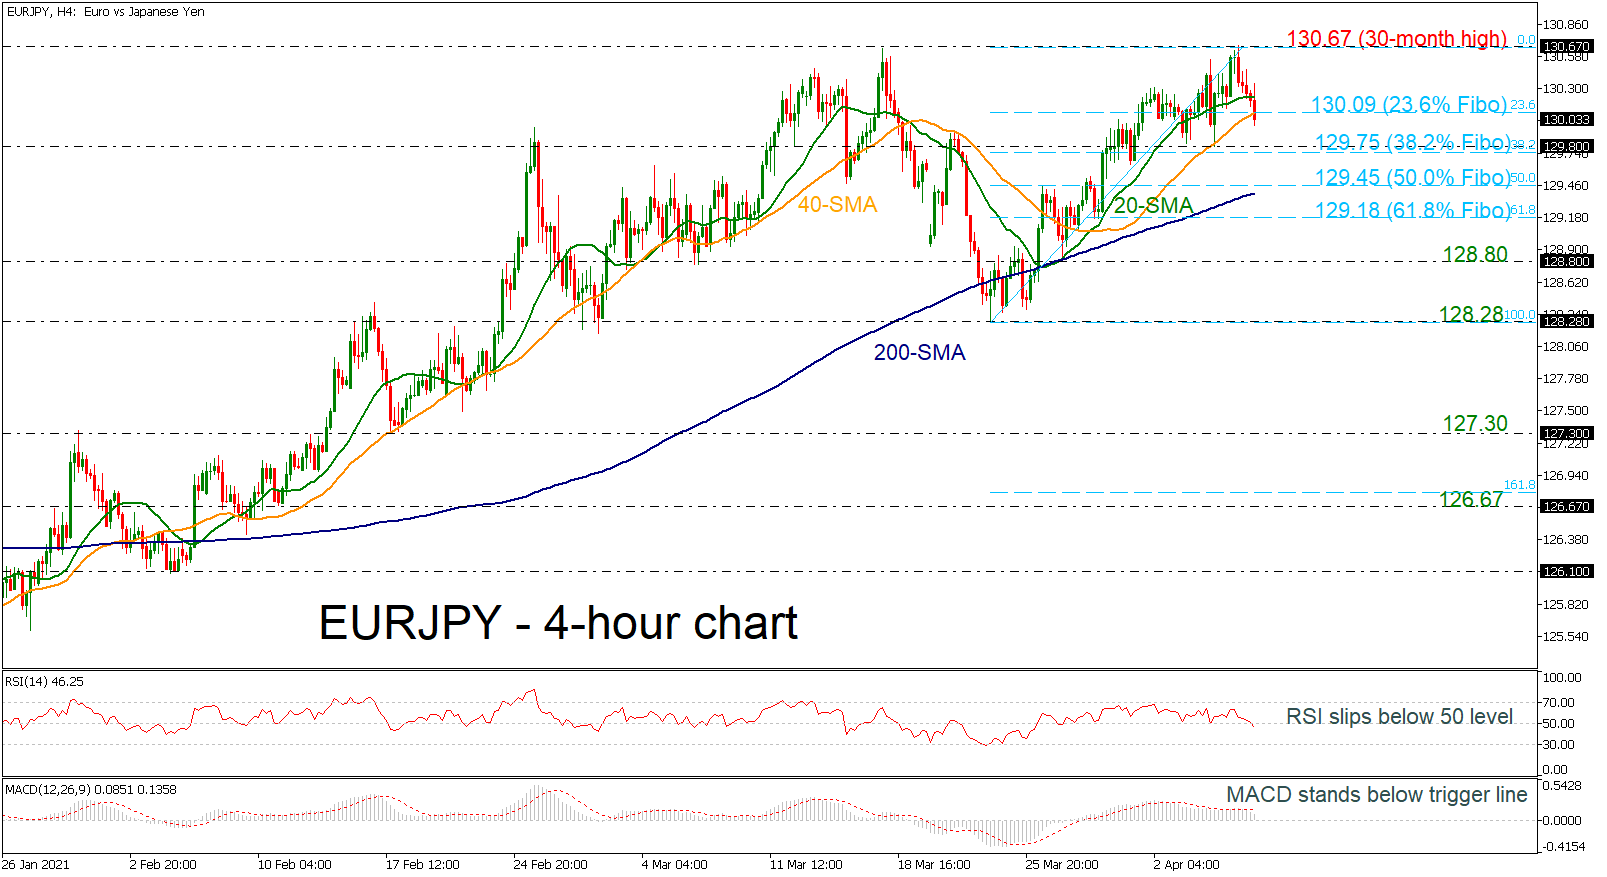
EURJPY is plunging from the 30-month high of 130.67, diving below the 23.6% Fibonacci retracement level of the upward wave from 128.28 to 130.67 at 130.09 and the short-term moving averages. The RSI indicator is falling from the 50 level, while the MACD oscillator is holding below the trigger line, both confirming the recent bearish structure.
In the event of more negative pressures, the market could meet support at the 38.2% Fibonacci of 129.75 before it heads lower to the 50.0% Fibonacci of 129.45, which stands slightly above the 200-day SMA. A successful close below this level could see a retest of the 61.8% Fibonacci of 129.18, while in case of steeper declines, the pair could reach the 128.80 level.
On the flip side, a move to the upside could see immediate resistance at the 20-period SMA at 130.23 but should the market increase positive momentum above this line, the 30-month high of 130.67 could be the next level in focus. A stronger barrier, though, could be found at 133.10, registered in September 2018.
Turning to the medium-term, EURJPY has been in a strong upside tendency since May 2020, however, in the very short-term the price is ticking lower.


