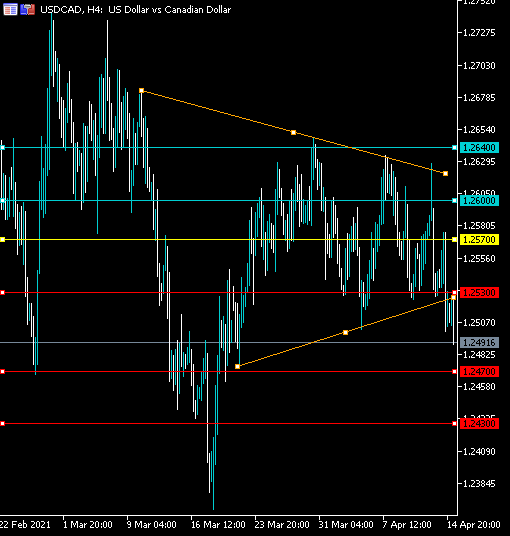
The US dollar has broken to the downside against the Canadian dollar, as oil price surges after the EIA report showed a large stockpile drawdown. A bearish breakout has taken place from a triangle pattern, placing technical selling pressure on the USDCAD pair. According to the size of the triangle pattern, the USDCAD pair could drop towards the 1.2430 support area in the short-term.
The USDCAD pair is only bullish while trading above the 1.2570 level, key resistance is found at the 1.2600 and the 1.2640 levels.
If the USDCAD pair trades below the 1.2570 level, sellers may test the 1.2470 and 1.2430 levels.