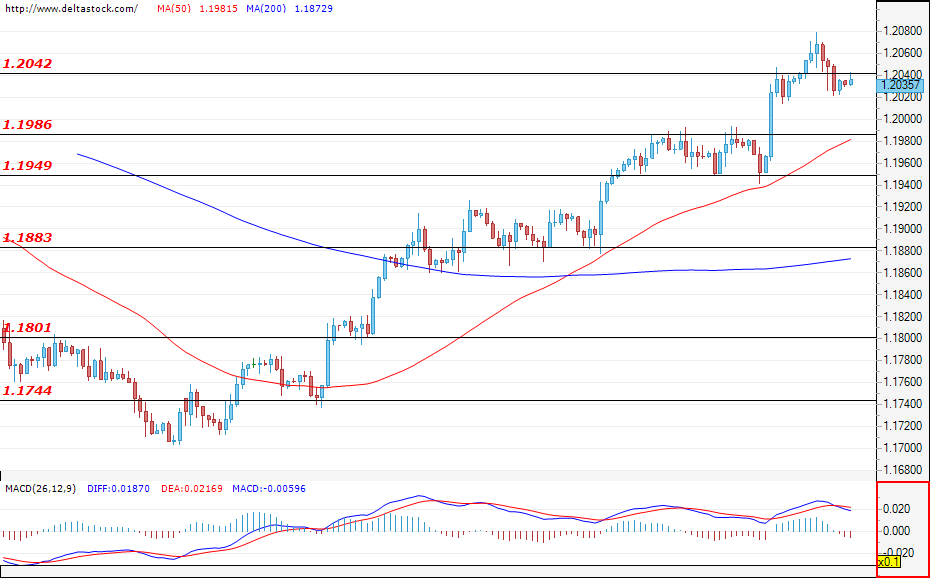
EUR/USD
Current level – 1.2035
The bulls did not gain enough momentum to successfully breach the resistance zone at 1.2042. However, at the time of writing, the EUR/USD is trading just below the mentioned level. A new test of 1.2042 is the most probable scenario for today, but only a successful violation could lead to further gains for the EUR against the USD and a move towards 1.2100. If the bears prevail, their first support can be found at the level of 1.1986 which, if breached, should lead to a deeper sell-off towards 1.1949.
| Resistance | Support | ||
| intraday | intraweek | intraday | intraweek |
| 1.2040 | 1.2180 | 1.1986 | 1.1880 |
| 1.2100 | 1.2340 | 1.1950 | 1.1800 |
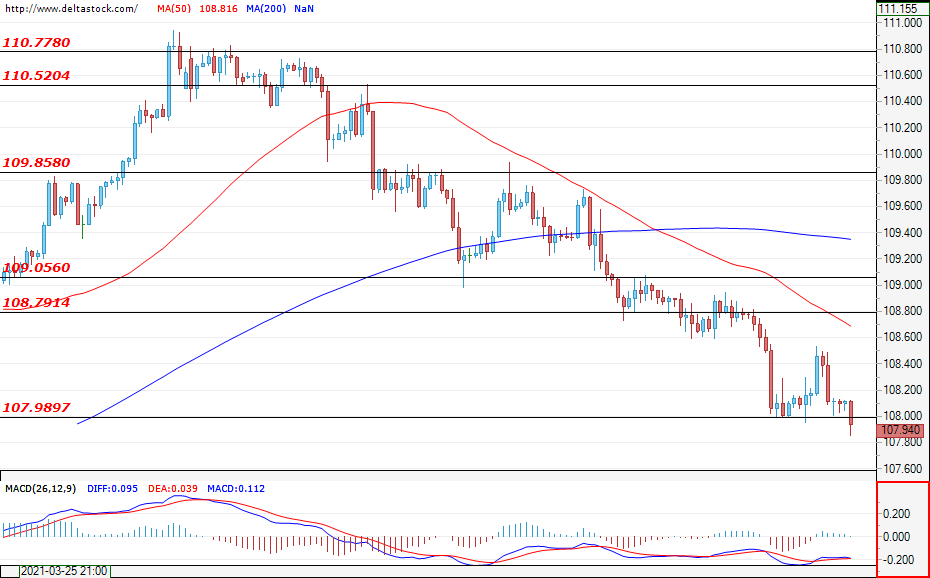
USD/JPY
Current level – 107.94
The bears re-entered the market and the USD/JPY is testing the support at 107.98. A successful breach of the mentioned zone could easily deepen the sell-off and pave the way for the currency pair towards the levels at around 107.10. In the positive direction, the first resistance zone for the bulls lies at 108.79, but only the successful violation of the next target at 109.05 could lead to a change in the current short-term market sentiment and help form a rally towards the zone at 109.85.
| Resistance | Support | ||
| intraday | intraweek | intraday | intraweek |
| 108.81 | 109.85 | 108.00 | 106.20 |
| 109.05 | 110.52 | 106.20 | 104.90 |
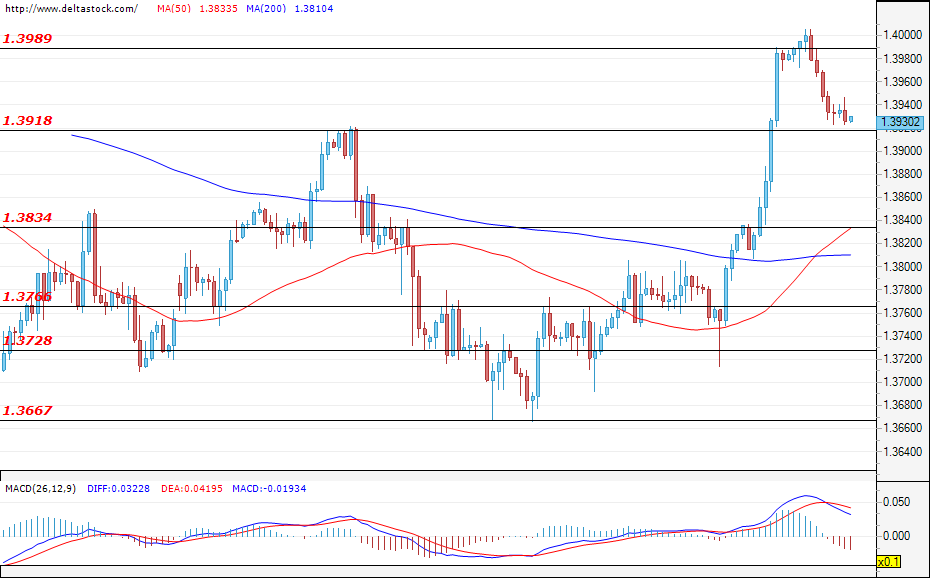
GBP/USD
Current level – 1.3930
The sterling erased some of its gains against the greenback and, at the time of writing the analysis, the pair is holding positions just above the support zone at 1.3918. If the bears manage to successfully breach the mentioned level, the corrective move will most probably deepen towards the support zone at 1.3834. For the time being, however, a rally towards the resistance zone at 1.3989 remains the most probable scenario. A successful breach of this level could easily lead to new gains for the GBP/USD and strengthen the positive expectations of the market participants.
| Resistance | Support | ||
| intraday | intraweek | intraday | intraweek |
| 1.3990 | 1.4140 | 1.3920 | 1.3760 |
| 1.4140 | 1.4300 | 1.3834 | 1.3670 |