- The bearish pullback is now testing the 21 ema support zone. Let’s look at the Elliott Wave patterns to understand the larger picture.
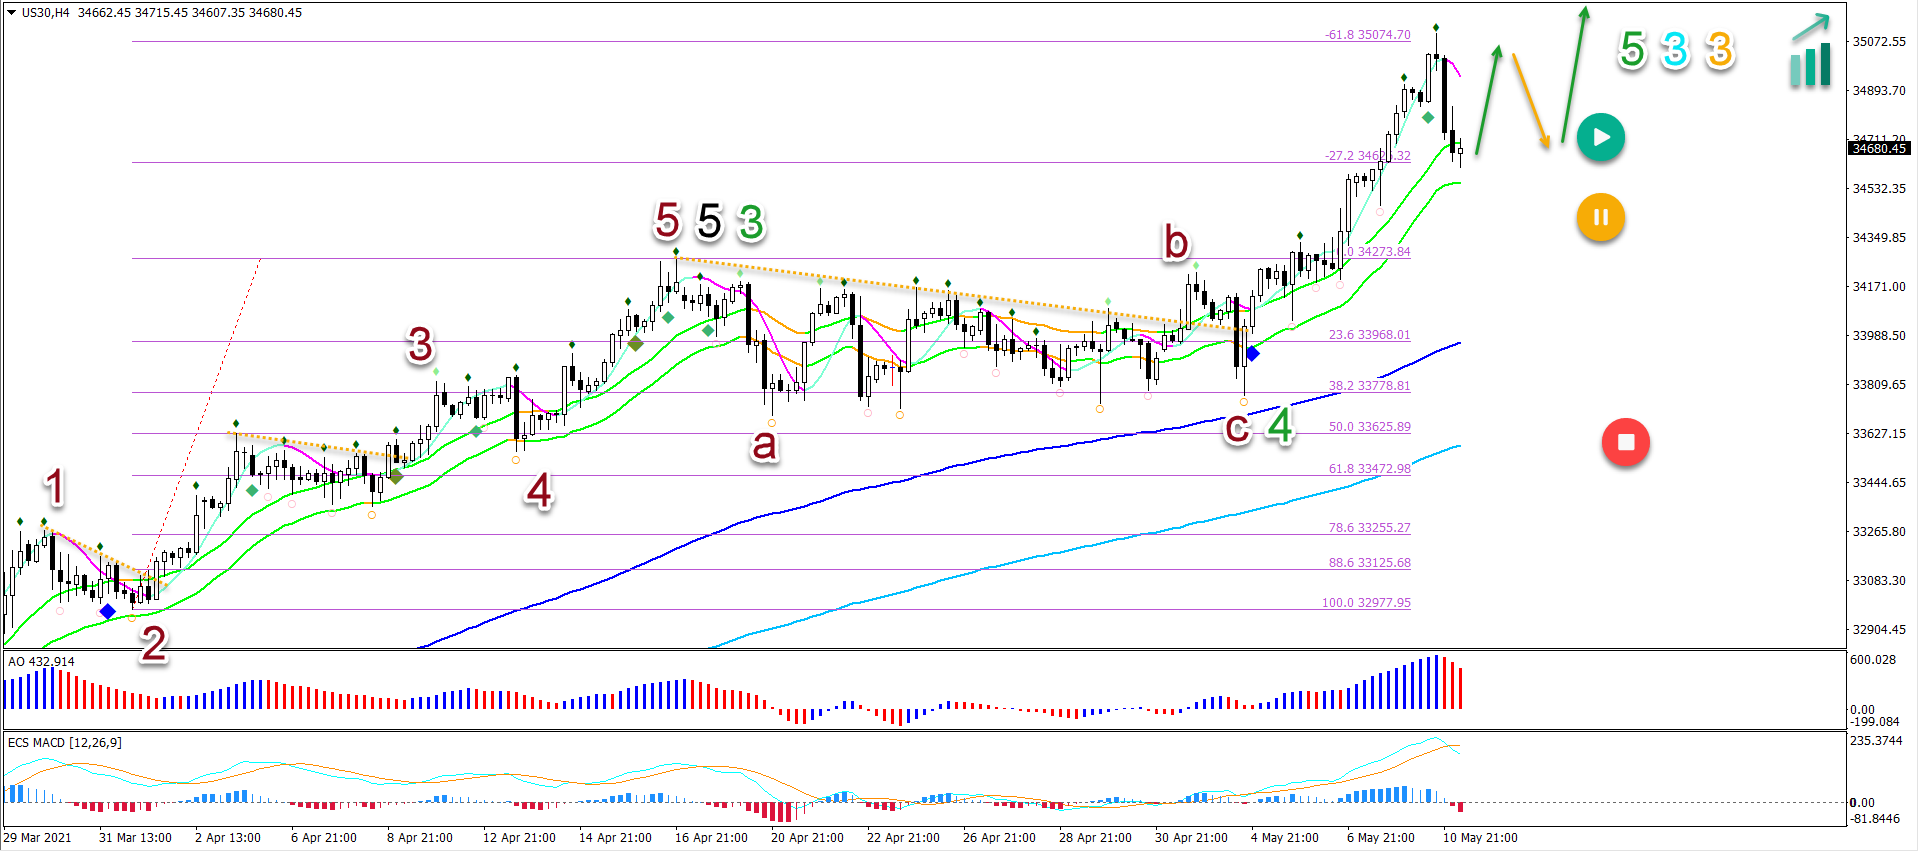
- The US30 remains bullish with a perfect alignment of moving averages: price action is above the 21 emas, which is above the 144 ema and 233 ema.
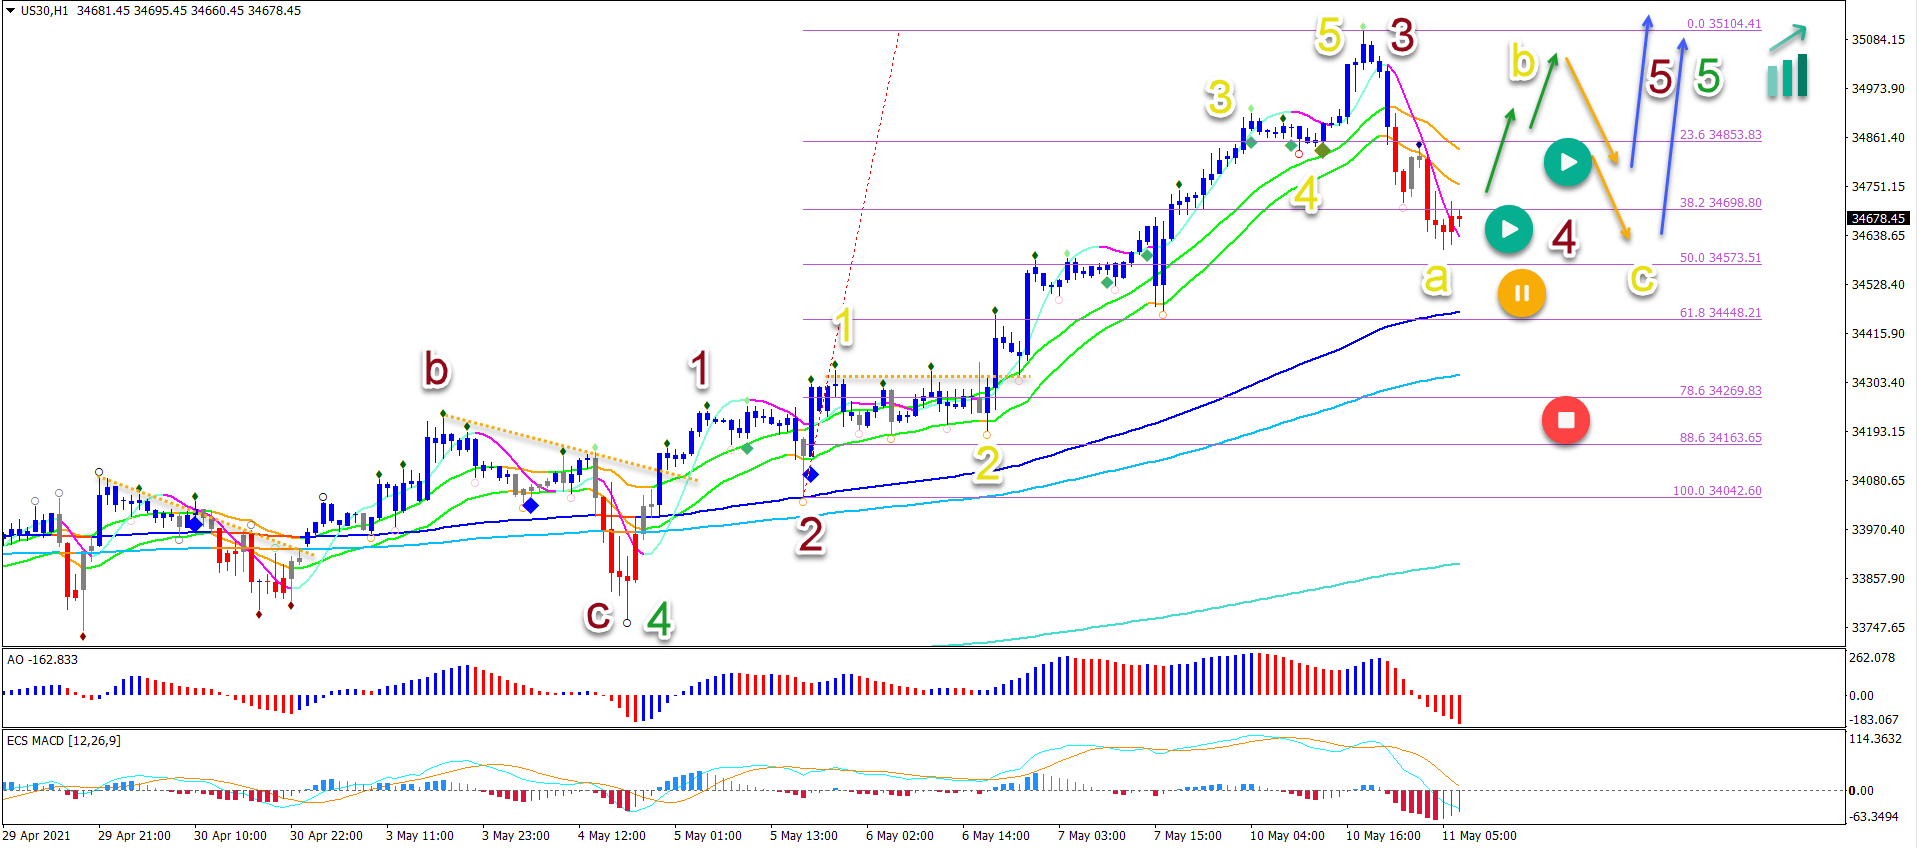
- On the 1 hour chart, price action seems to have completed a 5 wave pattern (gold) in wave 3 (brown) at the $35,000 round resistance level. Let’s review what to expect next.
The Dow Jones Index (US30) reached the $35,000 target yesterday.
The bearish pullback is now testing the 21 ema support zone. Let’s look at the Elliott Wave patterns to understand the larger picture.
Price charts and technical analysis
The US30 remains bullish with a perfect alignment of moving averages: price action is above the 21 emas, which is above the 144 ema and 233 emas:
- The Elliott Wave patterns suggest a wave 5 (green) in multiple wave 3s (including blue and orange).
- Price action is testing the 21 ema support zone, which seems to be strong when considering the steep bullish angle of the 21 emas.
- The bullish momentum is also strong when reviewing the gap between price action and the 21 emas.
- The recent price action was however bearish which could indicate a correction pattern (orange arrow).
- A break below the 21 emas places the uptrend on hold (orange button) whereas a very deep break could invalidate it (red button).
On the 1 hour chart, price action seems to have completed a 5 wave pattern (gold) in the wave 3 (brown) at the $35,000 round resistance level. Let’s review what to expect next:
- A bearish ABC (gold) pattern in wave 4 (brown) is likely if price action remains above the 50% Fibonacci retracement level.
- A break below the 50% Fibonacci level places the uptrend on hold (orange button). A break below the 78.6% Fib invalidates it (red button).
- An uptrend continuation is likely once price action breaks above the 21 ema for the 2nd time (blue arrows). The first break is vulnerable to being a wave B (gold) rather than an uptrend.
- The wave 5 targets are located at $35,400 / $34,500 / $35,750 / $36,000.