


TL;DR: The Hormuz crisis is shifting from an oil-and-bond story to a broader risk-off one, with equities weakening, Copper breaking lower, and Silver losing its rebound structure — a sign its industrial-demand exposure is becoming a liability rather than an advantage.
Silver Is Starting to Feel the Other Side of the Oil Shock
For several days, the Hormuz crisis was primarily an oil-and-bond story. Brent climbed, inflation fears returned, and global yields pushed higher. Now the second half of the trade is beginning to appear: equities are weakening, Copper has broken lower, and Silver is starting to lose its rebound structure.
That shift comes as the US-Iran confrontation moves beyond simple diplomatic stalemate. The June 17 ceasefire framework expired August 17 without renewal, but the formal deadline mattered less than the deterioration that followed. Another tanker was struck in the Strait of Hormuz, Tehran laid out sweeping conditions for reopening the waterway, and Washington hardened its own rhetoric. More importantly, US Special Envoy for Peace Jared Kushner indicated Iran is unwilling to compromise on US demands, suggesting current talks are failing to narrow differences rather than merely moving slowly.
Brent has responded by extending its advance toward $92, with WTI around $85. But Silver’s reaction increasingly shows why this is no longer just a commodity-supply story.
Higher Oil Is Lifting Yields — and Starting to Hurt Growth Assets
The bond market has taken the escalation seriously. The US 30-year yield has reached approximately 5.33%, its highest in 19 years, while the 10-year is hovering around 4.72–4.75%. Germany’s 10-year Bund has surged to around 3.27%, its highest level since 2011.
That global move gives the current shock a stagflationary character. Hormuz disruption threatens higher oil and freight costs, which keep inflation expectations elevated and reduce room for central banks to ease policy. But the resulting rise in yields also tightens financial conditions and weighs on valuations and demand.
Equities are beginning to show that pressure and have closed down for multiple sessions. The Dow slipped -0.22% overnight, the S&P 500 fell -0.69%, and the Nasdaq lost -1.33%. The Nasdaq’s larger decline is especially consistent with higher-yield pressure.
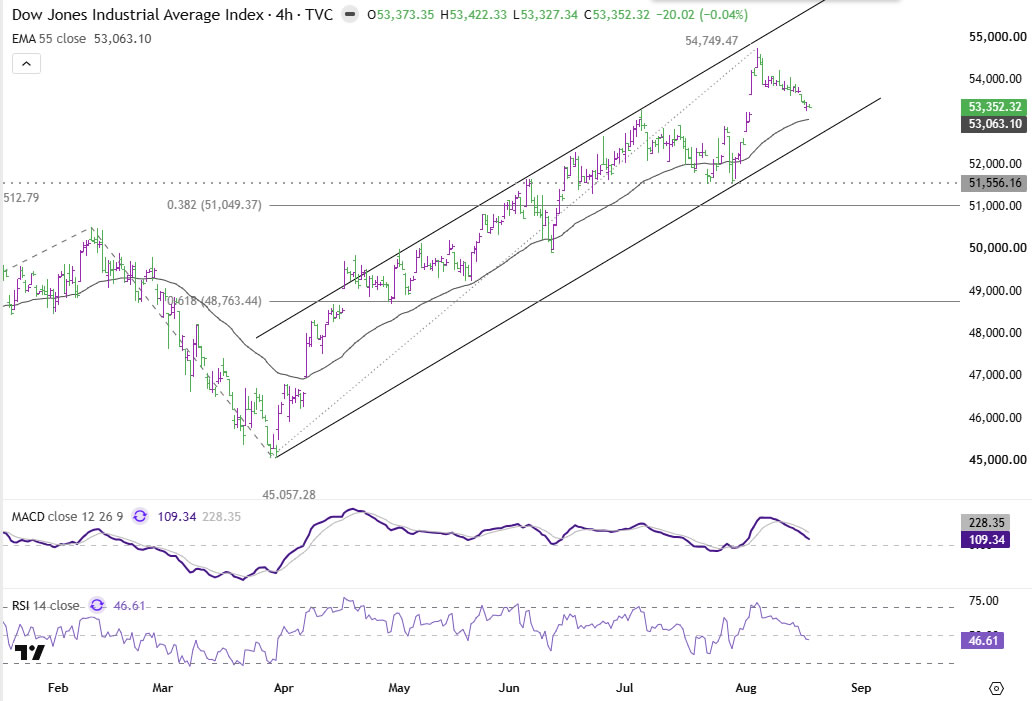
For Silver, this matters because it sits between two worlds. Gold can still benefit from monetary uncertainty and inflation concerns. Silver shares some of that support, but it also depends much more heavily on industrial demand and risk appetite. The current environment is turning that dual identity into a disadvantage.
Copper Is Giving Silver Bulls a Warning
Copper offers one of the clearest cross-checks. The metal surged to a record 6.9247 in early August on structural supply-deficit optimism, but has since reversed to a two-week low. Price has fallen below the 55 4H EMA near 6.66, broken rising trend support, and slipped through the roughly 6.565 retracement area.
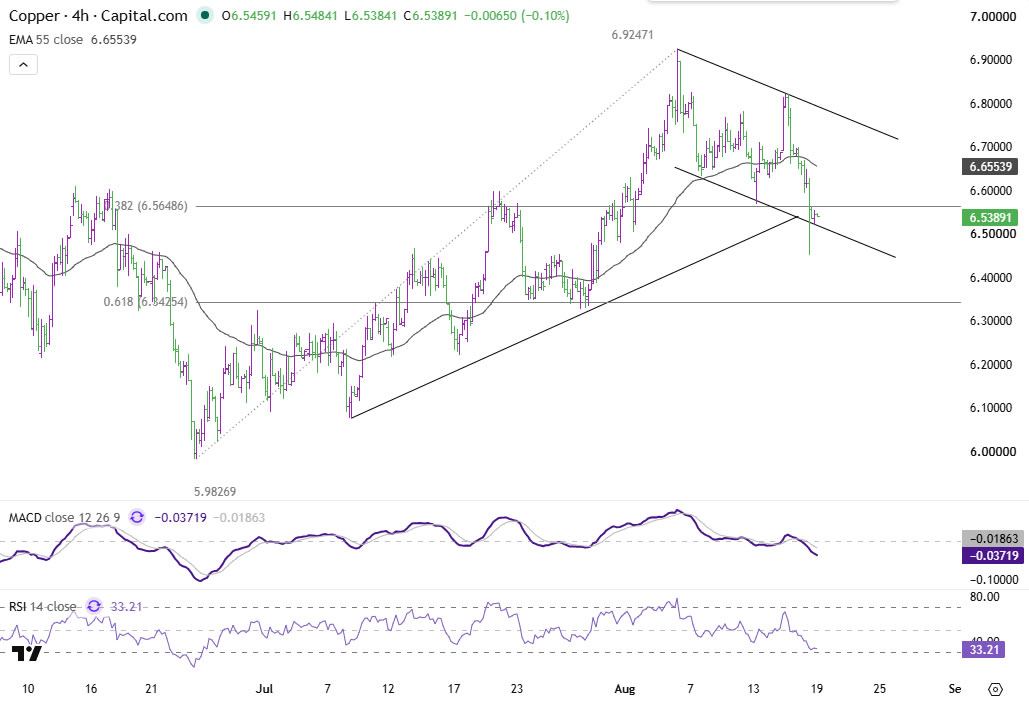
RSI around 33 shows momentum has weakened sharply. Some profit-taking after an all-time high is natural, but timing matters — Copper’s selloff is accelerating just as stocks retreat and bond yields climb. That’s exactly what Silver bulls don’t want to see. Copper has much less monetary support than Gold, so its weakness is a cleaner signal that investors are beginning to worry about the demand consequences of higher energy costs and tighter financial conditions.
If Copper keeps falling while Brent stays elevated, Silver’s industrial component becomes an increasingly important drag.
Gold Is Starting to Win the Metals Trade
The Gold/Silver ratio is already reflecting that divergence. The correction from roughly 72.55 appears to have completed at 66.23, with the ratio now rebounding sharply toward 69.40. A firm break above 69.40 would confirm another leg higher and point to further Silver underperformance relative to Gold.
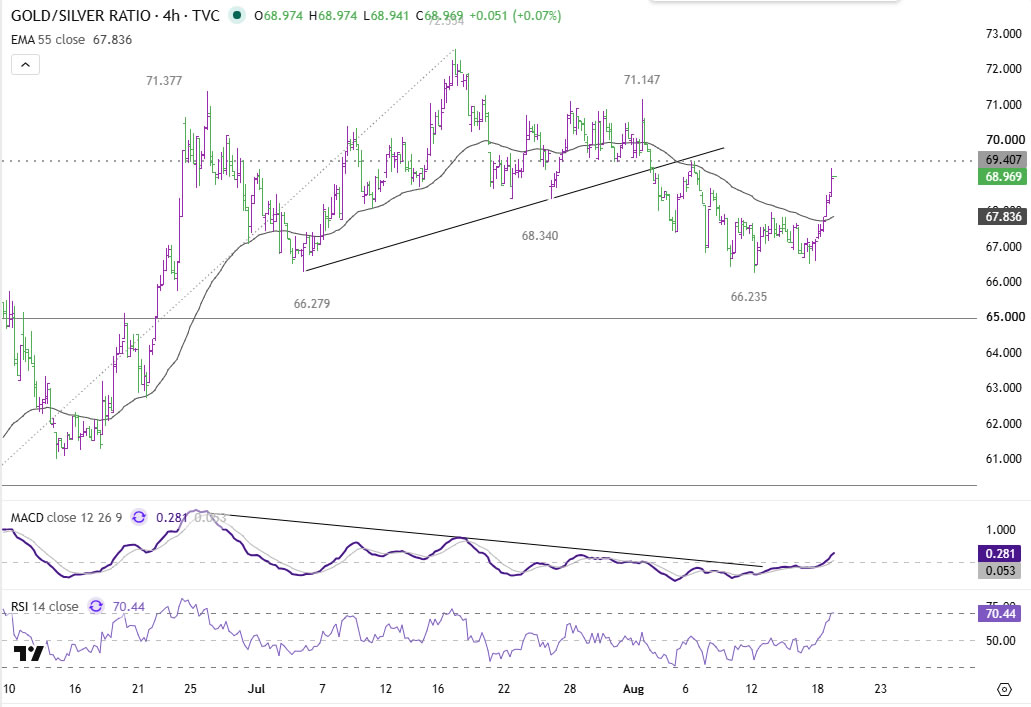
That would fit the current macro mechanism almost perfectly. Both metals face high yields, but Gold retains a cleaner monetary bid from policy uncertainty and geopolitical risk. Silver faces those same yields while also absorbing deteriorating industrial sentiment. So if the ratio breaks 69.40 at the same time Copper extends its decline, the market would be delivering two independent confirmations that Silver’s problem is becoming more than a simple short-term pullback.
ActionForex’s Technical View on Silver
Silver’s 4H structure has already weakened materially. The rebound from 54.77 extended to 66.79, but price has since broken firmly below the 55 4H EMA around 63.90. The 4H MACD has also broken its rising trendline, signaling a loss of momentum that supported the recovery. This raises the risk that the move from 54.77 was only a three-wave corrective rebound that ended at 66.79.
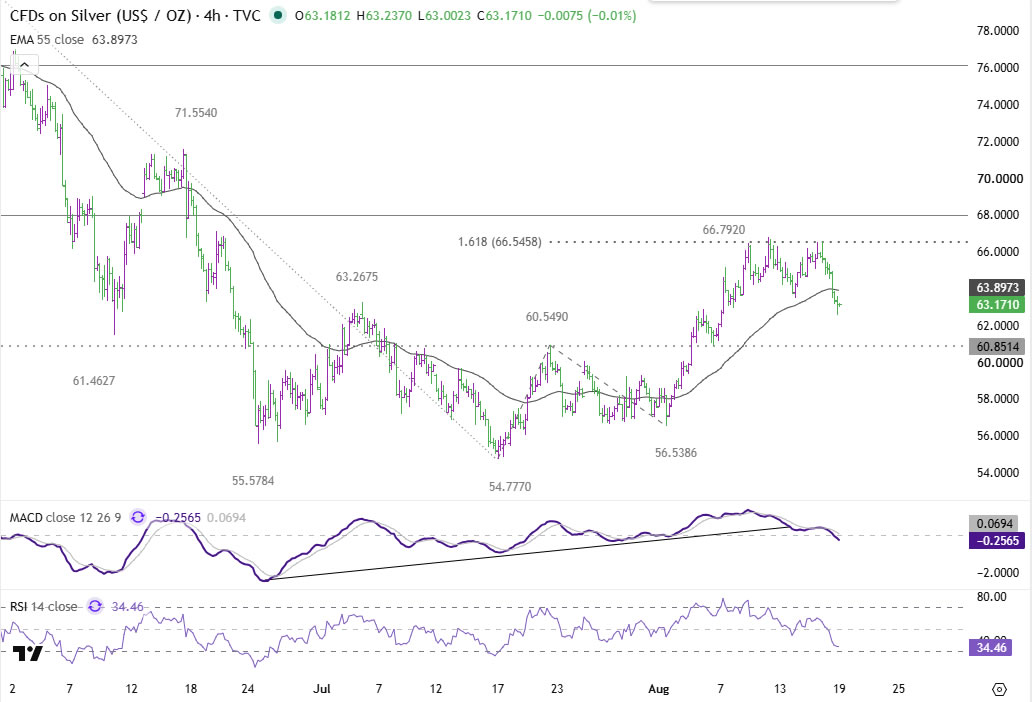
The bigger picture supports that interpretation. The recovery was rejected below 67.99, the 38.2% retracement of the larger 89.36–54.77 decline. Silver has also fallen through the 55-day EMA near 63.71, leaving the medium-term bearish structure intact unless price can regain that area quickly. In other words, the rebound repaired momentum but never cleared the level required to demonstrate the larger downtrend had ended.
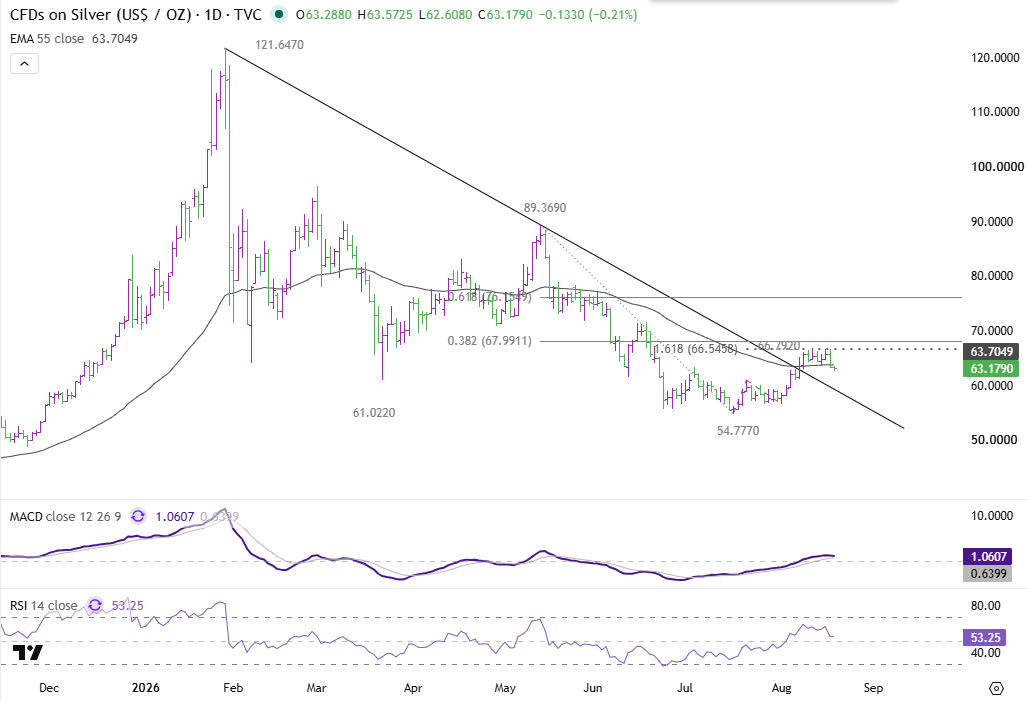
The immediate focus now shifts lower. The first important downside zone is 60.92, resistance turned support. A firm break there would substantially strengthen the view that 66.79 marked completion of the rebound, with a deeper fall then seen back to the 54.77–56.53 support zone. For bulls, the first task is recovering 63.70–63.90, where the daily and 4H moving averages converge — even that would only stabilize the near-term structure. A more meaningful invalidation requires a sustained recovery through 66.79, which would put the 67.99 retracement resistance back into play.
That gives traders a straightforward map:
- Below 63.70–63.90: downside pressure dominates.
- Break below 60.92: the corrective-top case gains confirmation.
- Below 54.77: the larger bearish trend resumes.
- Above 66.79: the bearish rebound-completion thesis weakens materially.
Key Takeaways
- The Hormuz crisis is broadening from an oil-and-bond story into a risk-off one, with equities, Copper, and now Silver all showing pressure.
- Rising global yields (US 30-year at 5.33%, German Bund at 3.27%) give the current shock a stagflationary character that’s starting to weigh on growth assets.
- Copper’s reversal from a record high to a two-week low offers a cleaner read on deteriorating demand sentiment than Gold, since it carries less monetary support.
- The Gold/Silver ratio rebounding toward 69.40 signals Silver is starting to underperform Gold as its industrial-demand exposure turns into a liability.
- 60.92 is the key level to watch: a break would confirm Silver’s rebound from 54.77 topped at 66.79, opening a deeper fall toward the 54.77-56.53 zone.





