
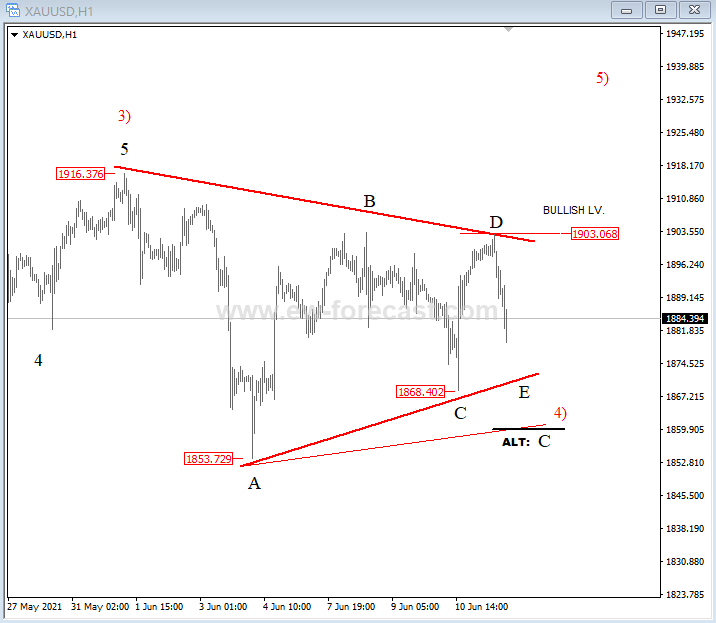
GOLD – XAUUSD is coming down again, but the whole structure since the beginning of June now more and more looks like a bullish triangle formation within wave 4), where we are tracking the final wave E or maybe even C if we see broken 1868 level. Anyway, keep in mind that bulls for wave 5) may step in only if we see it back above 1903 region.
Gold 1h Elliott Wave analysis chart
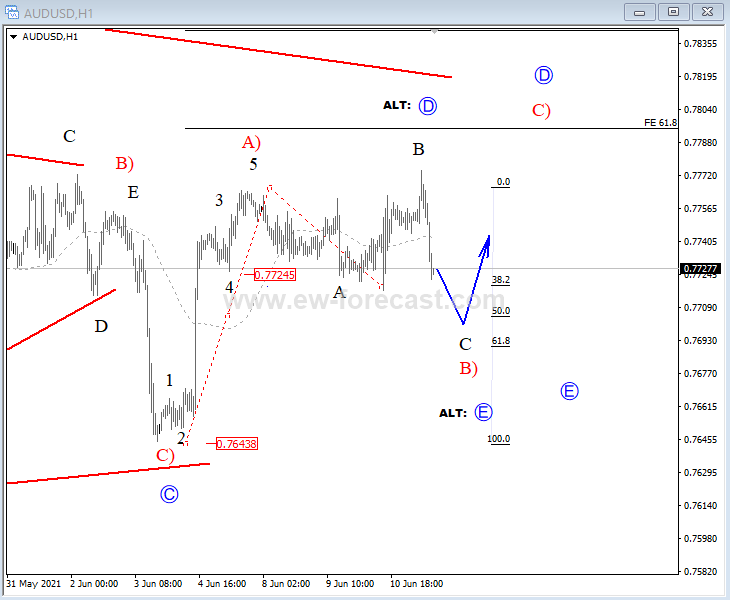
Aussie – AUDUSD is coming lower, which we currently see it potentially as part of a flat correction within wave B), but it could be also already down within the final wave E. Anyway, there’s room for more sideways price action before bulls show up.
AUD/USD 1h Elliott Wave analysis chart


