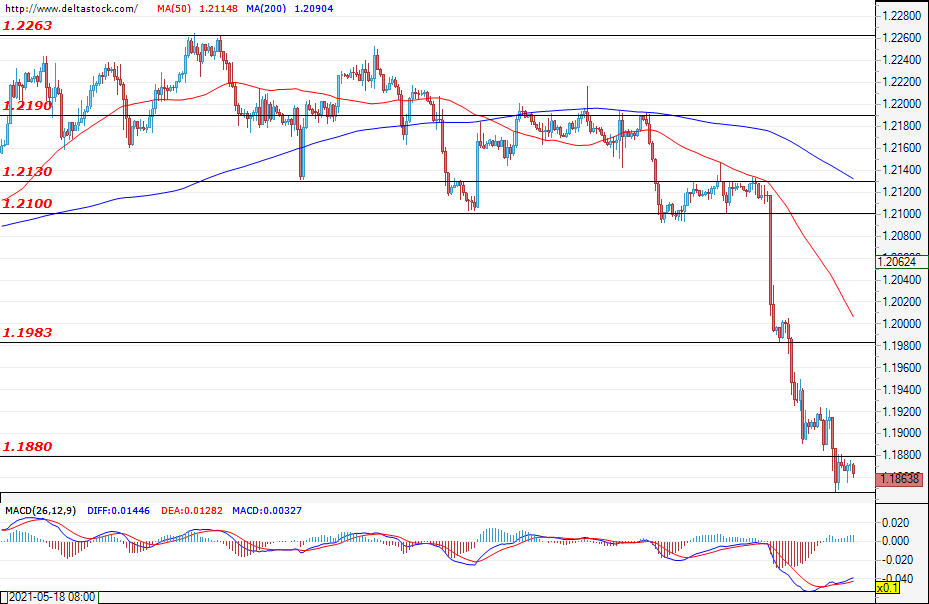
EUR/USD
Current level – 1.1863
At the time of writing the analysis, the currency pair continues to trade below the support level of 1.1880, with the most likely scenario being for a continuation of the sell-off aimed towards the next most important support at 1.1700. We may witness a correction, but it should remain limited below the resistance level of 1.2100. There is a number of economic news this week that could lead to an increase in volatility. The most important are the announcement of the U.S. data on the existing home sales (Tuesday; 14:00 GMT), the data on retail sales (Wednesday; 12:30 GMT) , the data on the manufacturing PMI (Wednesday; 13:45 GMT) and, finally, the GDP data (Thursday; 12:30 GMT).
| Resistance | Support | ||
| intraday | intraweek | intraday | intraweek |
| 1.1880 | 1.2100 | 1.1835 | 1.1710 |
| 1.1983 | 1.2190 | 1.1760 | 1.1620 |
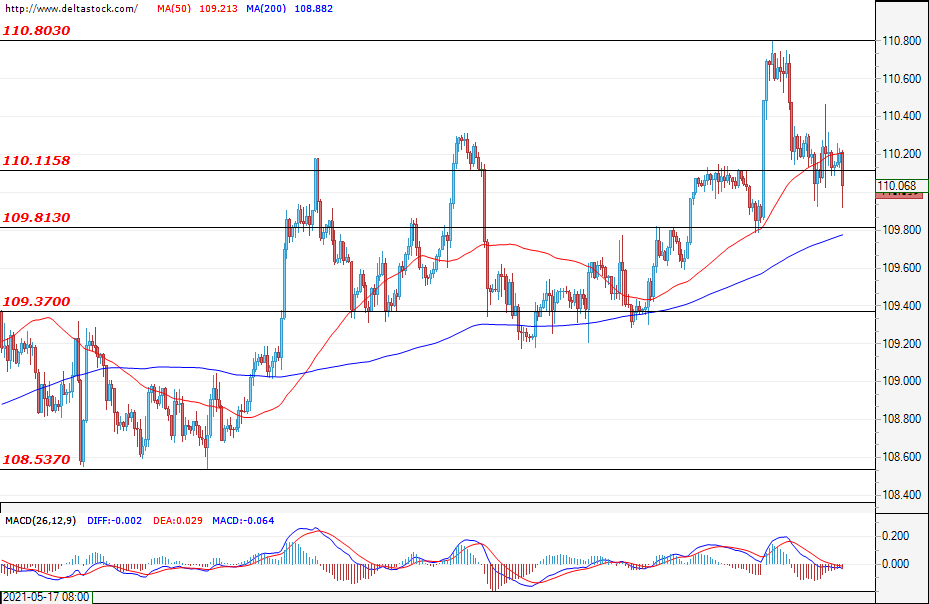
USD/JPY
Current level – 110.06
After the high volatility of the U.S. dollar during last week, at the time of writing we are seeing a lull and consolidation around the 110.11 resistance level. It is possible that we will see an additional appreciation of the dollar against the Japanese yen and another test of the resistance zone at 110.80. In the negative direction, the first significant support is the level at around 109.40.
| Resistance | Support | ||
| intraday | intraweek | intraday | intraweek |
| 110.80 | 111.70 | 110.11 | 109.37 |
| 111.70 | 112.60 | 109.81 | 108.56 |
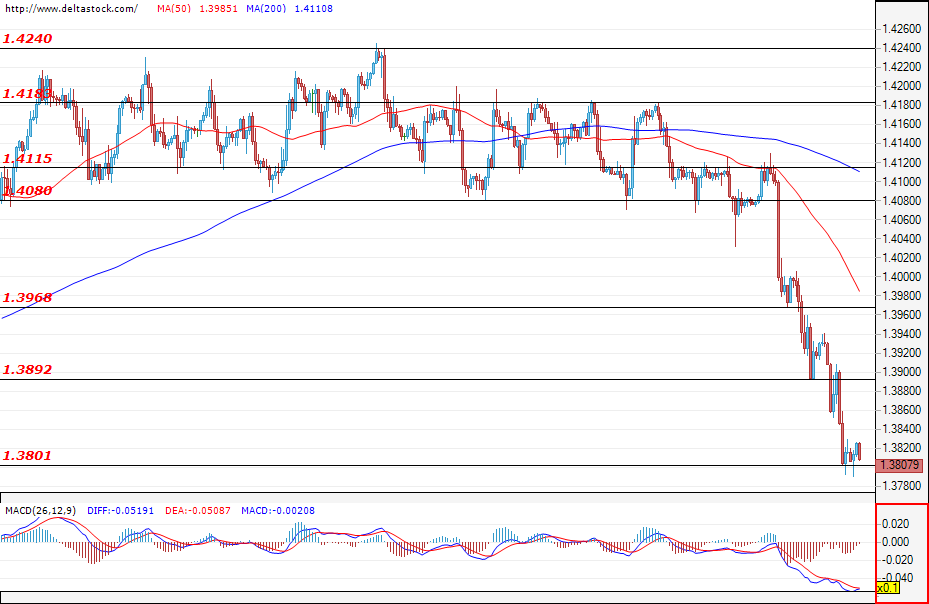
GBP/USD
Current level – 1.3807
During Friday’s trading session, we witnessed an additional depreciation of the pound against the U.S. dollar and the bulls managed to limit the sell-off down to the support level at 1.3800. At the time of writing the analysis, the consolidation above the mentioned level is still intact and the most likely scenario is for a corrective upward move , followed by a new sell-off. This week, investors’ focus will mainly fall on the Bank of England’s interest rate decision (Thursday; 11:00 GMT).
| Resistance | Support | ||
| intraday | intraweek | intraday | intraweek |
| 1.3890 | 1.4080 | 1.3800 | 1.3660 |
| 1.3970 | 1.4115 | 1.3740 | 1.3660 |