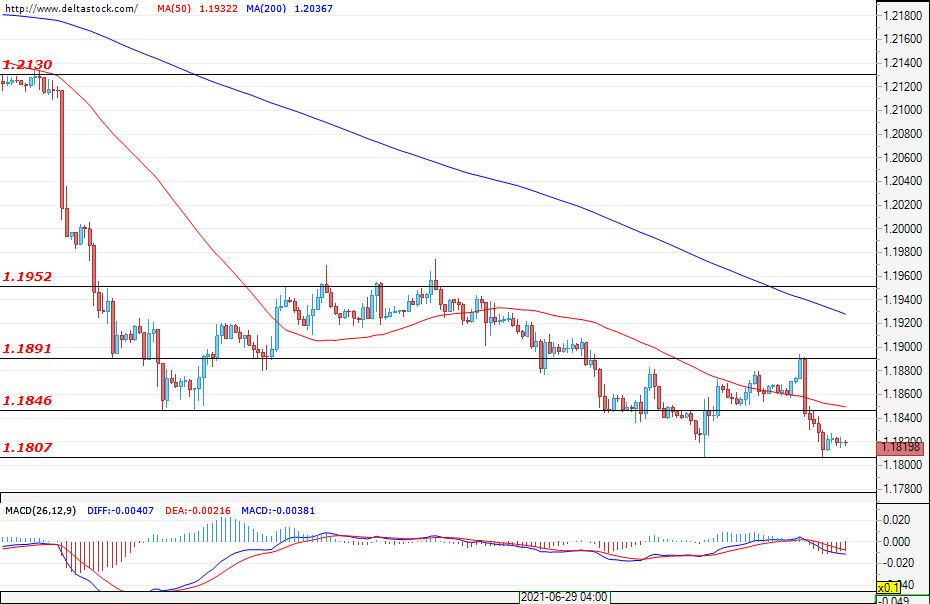
EUR/USD
Current level – 1.1819
The resistance at 1.1846 was probed last Friday and, after the weak data from Europe, the bears managed to breach it yesterday. However, their momentum was enough only to reach the support at 1.1807. It is possible for the market to form a double-bottom at the mentioned level, which is also today’s daily support. In order to complete the formation, it is desirable for the bulls to push the pair above the resistance at 1.1891. Limited bearish pressure around this area and the formation of a small range would confirm the reliability of the formation. In an alternative scenario, the bearish pressure from today may continue and 1.1807 may get breached. A potential next target for the bears could be the bottom from the end of March this year at 1.1700. Today, the most anticipated event on the economic calendar are the FOMC meeting minutes, where investors will seek guidance on interest rates.
| Resistance | Support | ||
| intraday | intraweek | intraday | intraweek |
| 1.1890 | 1.2130 | 1.1846 | 1.1760 |
| 1.1955 | 1.2237 | 1.1760 | 1.1690 |
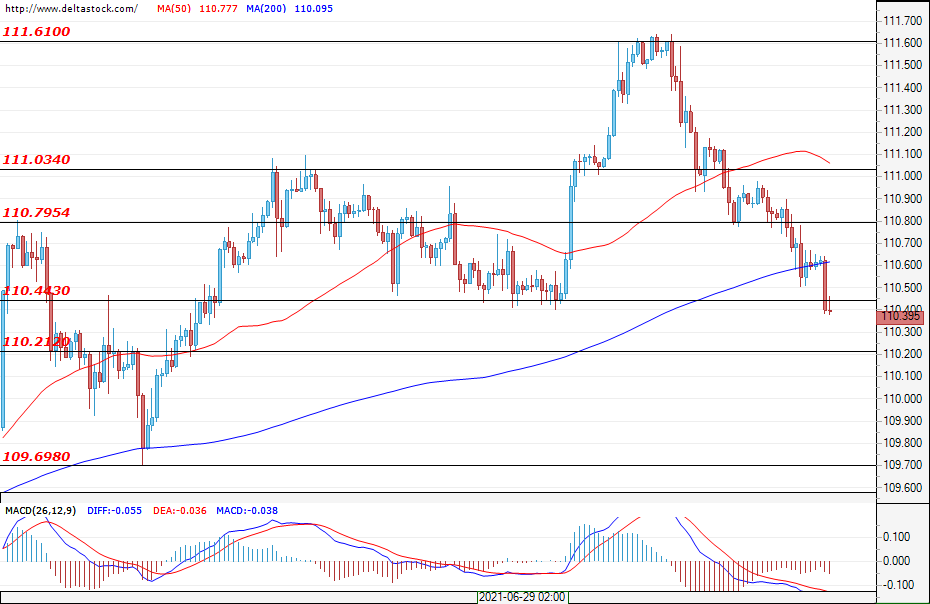
USD/JPY
Current level – 110.39
The declines in the pair continued yesterday and, at the time of writing, the USD/JPY is gravitating around the support of 110.44. It is likely that this support will not be breached from the first attempt and that the market will enter a consolidation phase. However, if the pressure continues and the support is breached, the next target for the bears is the support around 110.21 and the next one at 109.69. From the perspective of the higher time frames, the pair is found in the lower band of an upward channel and the possibility to see strong interference from the bulls remains on the table.
| Resistance | Support | ||
| intraday | intraweek | intraday | intraweek |
| 110.79 | 111.61 | 110.44 | 109.69 |
| 111.03 | 112.60 | 110.21 | 109.69 |
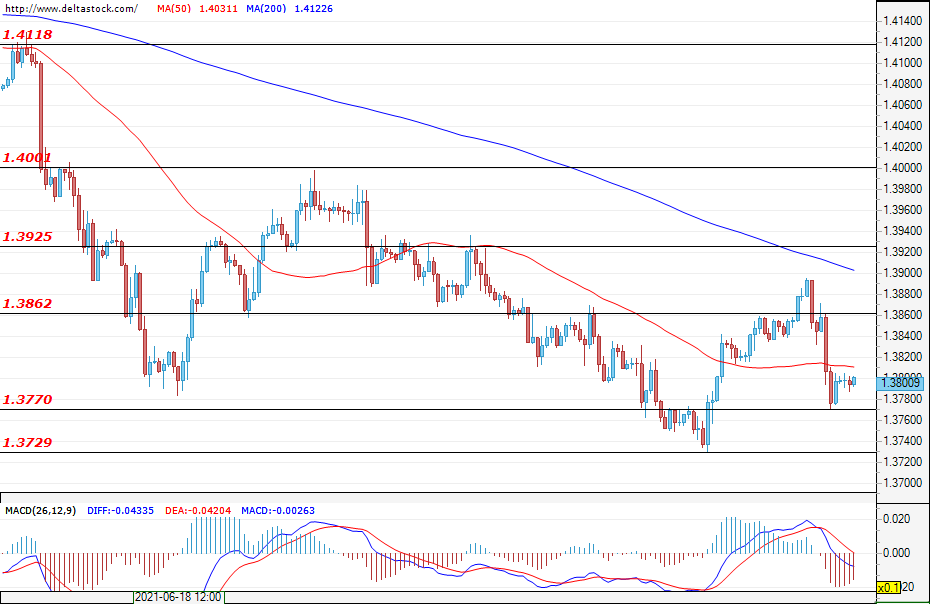
GBP/USD
Current level – 1.3800
The sterling also lost value over the past day, but the bulls failed to score a new lower bottom. The price channel from the resistance at 1.3925 to the bottom at 1.3729 is an early indicator of bear exhaustion. Demand in the support zone between 1.3730-1.3770 turned out to be strong and this will be the first support for the day. If the market is truly already in the reversal phase, it is desirable to see a rally for the bulls targeting 1.3900. The bears still hold a lot of ground and a potential reversal would take time. In such a scenario, the trading area could be 1.3770-1.3925.
| Resistance | Support | ||
| intraday | intraweek | intraday | intraweek |
| 1.3862 | 1.4000 | 1.3770 | 1.3660 |
| 1.3925 | 1.4118 | 1.3730 | 1.3610 |