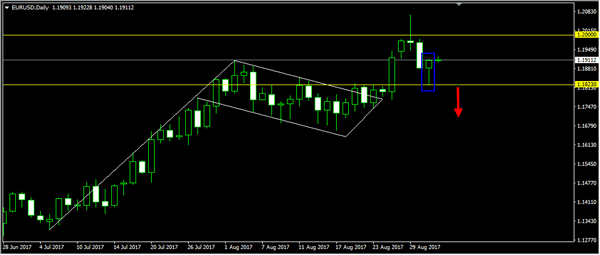
EURUSD
The EURUSD attempted to push lower yesterday bottomed at 1.1823 but closed higher at 1.1909 and hit 1.1922 earlier today in Asian session. As you can see on my daily chart below, we have a bullish pin bar formation which could signal an end to the bearish correction and resumption of the bullish trend. The bias is bullish in nearest term testing 1.2000 – 1.2070 region. Immediate support is seen around 1.1870. A clear break below that area could lead price to neutral zone in nearest term testing 1.1823 key support. A clear break and daily/weekly close below 1.1823 would signal further bearish correction next week testing 1.1600 region.
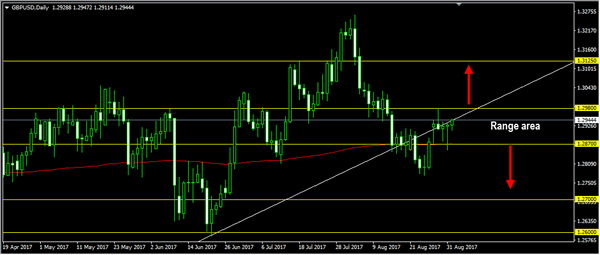
GBPUSD
The GBPUSD attempted to push lower yesterday slipped below 1.2870 but whipsawed to the upside and closed higher at 1.2928 and hit 1.2947 earlier today in Asian session. The bias is bullish in nearest term but price is still trapped between 1.2980 – 1.2870 range area and need a clear break from that range area to see clearer direction. A clear break and daily/weekly close above 1.2980 would expose 1.3125 area next week. On the other hand, a clear break and daily/weekly close below 1.2870 would expose 1.2700 area next week. Overall I remain neutral.
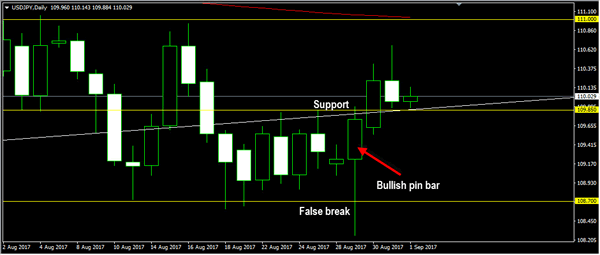
USDJPY
The USDJPY attempted to push higher yesterday topped at 110.67 but closed lower at 109.96. The bias is neutral in nearest term but price is still in a bullish phase after formed a valid bullish pin bar on Tuesday with nearest bullish target seen around 111.00 region. Immediate support is seen around 109.85. A clear break below that area could trigger further bearish pressure testing 109.40 but key support remains at 108.70 area. Overall I remain neutral.
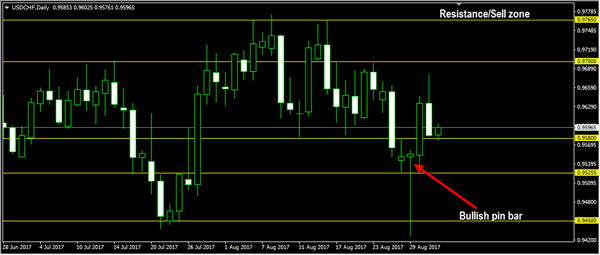
USDCHF
The USDCHF failed to continue its bullish momentum yesterday bottomed at 0.9582 and hit 0.9576 earlier today in Asian session. The bias is bearish in nearest term testing 0.9525 but the bullish pin bar formed on Tuesday still provides a valid bullish signal. Immediate resistance is seen around 0.9650. A clear break above that area could lead price to neutral zone in nearest term testing 0.9700 region but key resistance is seen at 0.9765 – 0.9807 region which remains a good place to sell. I prefer to stand aside for now.