Technical analysis
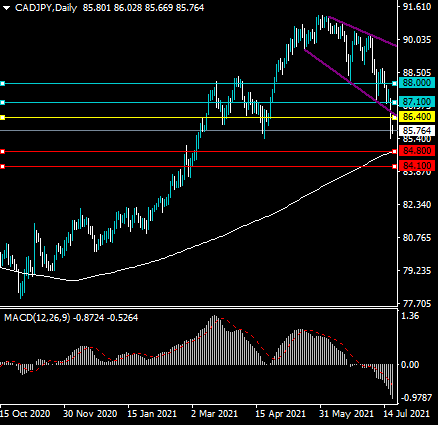
The MACD indicator is bearish, with the MACD histogram and signal line both trending lower on the daily time frame.
The CADJPY pair has broken under a descending broadening wedge pattern. Further heavy selling is likely as wedge pattern breakout usually increase technical selling.
What the possible outcomes are
In our most likely scenario, the CADJPY pair will continue to decline over the medium-term horizon and test towards its trend defining 200-day moving average, around the 84.80 support area.
Alternatively, the CADJPY pair may stage a minor technical correction and then start to fall. This scenatio would see the pair test back towards the former breakout area from the wedge pattern, around the 86.40.
Key levels
Support 84.80 84.10
Resistance 86.40 87.10