EUR/USD
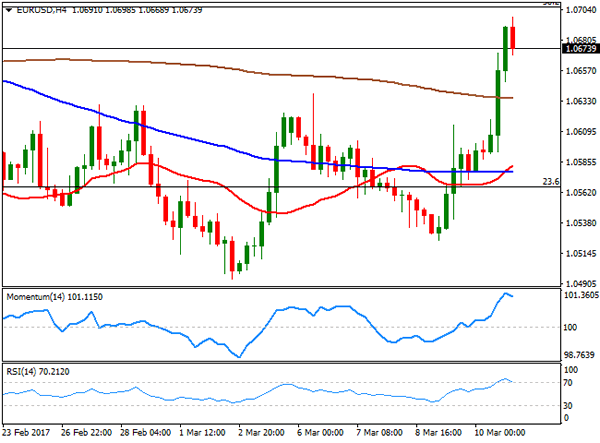
The EUR/USD pair closed the week at 1.0670, its highest settlement in five weeks, on headlines released late Friday indicating that the ECB´s Government Council discussed the possibility of raising rates before the end of their bond-buying program, during the meeting held last March 9th. Investors have been long speculating about the ECB beginning tapering, and despite Draghi’s efforts to down talk the matter, is clear that some members of the council that had opposed to easing since the beginning, are now making their voice heard. The advance has been quite shallow, as the pair remained below the 1.0700 threshold, but somehow indicates a limitation to the downward potential of the pair.
The greenback closed the week with gains against the rest of its major rivals, as the US Nonfarm Payroll report, also released on Friday, pretty much confirmed 25 bps rate hike this upcoming Wednesday. According to the official release, the US economy added 235,000 new jobs in February, whilst the unemployment rate edged down to 4.7% and the underemployment rate to 9.2% from previous 9.4%. Wages were mixed, as monthly basis rose by 0.2%, missing expectations of 0.3%, but year-on-year surged to 2.8%, whilst January reading was revised higher, also to 2.8% from previous 2.5%. The solid job creation alongside with the advance in wages, backed Fed’s officers jawboning from the past couple of weeks, supporting the move.
From a technical point of view, the pair is biased higher, although still needs to break above the 1.0700/20 region to confirm a more sustainable recovery. In the daily chart, technical indicators have entered positive territory with strong upward slopes, whilst the price settled above its 20 and 100 DMAs, above this last for the first time in over a month, although both moving averages maintain their downward slopes. The pair has a major resistance around 1.0710, the 38.2% retracement of the post-US election decline that needs to be broken to confirm a bullish extension. Shorter term and according to the 4 hours chart, the risk is also towards the upside, as technical indicators have barely retreated within overbought readings, whilst the price has broken above all of its moving averages. Above the mentioned resistance, the pair has scope to rally up to 1.0810, the 50% retracement of the mentioned decline.
Support levels: 1.0660 1.0635 1.0600
Resistance levels: 1.0720 1.0755 1.0790
USD/JPY
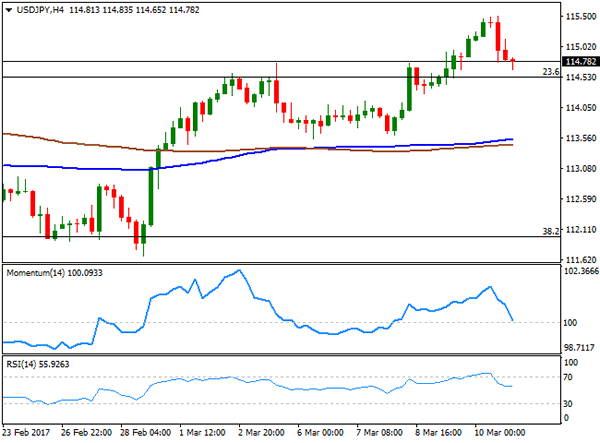
The USD/JPY pair jumped to 115.50 on Friday, its highest since mid January, boosted by a better-than-expected US employment report that backed the case for a US Fed’s rate hike this upcoming week. The strong report helped US Treasury yields to hold near 2017 highs reached ahead of the release, although they later eased, to close the day with gains anyway. The 10-year benchmark peaked at 2.62%, before settling at 2.58%. The BOJ will have its monthly monetary policy meeting this week, but is largely expected to remain on hold, with little chances of further easing in Japan. Much of the upcoming trend will depend on how the market reacts to Fed’s announcement this Wednesday, rather focusing on what’s next for rate hikes. A hawkish Yellen that hints at least two more rate hikes for this year, should send the pair higher. From a technical point of view, the daily chart shows that the price settled a few pips above 114.55, THE 23.6% retracement of the November/December rally, a level that capped the upside for most of the past February, whilst the 100 DMA maintains a bullish slope a few pips below it, indicating that the pair may resume its advance, as long as it holds above it. Technical indicators in the mentioned chart hold within positive territory, but with no directional strength. In the 4 hours chart, technical indicators have pulled sharply lower from overbought readings and are currently near their mid-lines, whilst the 100 and 200 SMA hold directionless around 113.40/50.
Support levels: 114.55 114.15 113.70
Resistance levels: 115.10 115.50 115.85
GBP/USD
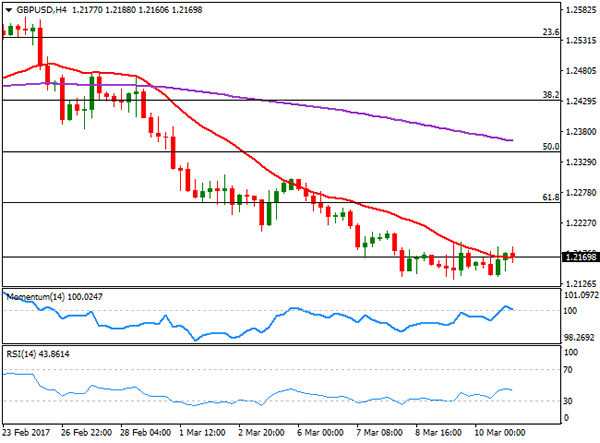
The GBP/USD pair closed with losses for a seventh consecutive week in the 1.2160 region and not far from the weekly of 1.2133, with the Pound undermined by BREXIT woes. News released early Friday show that consumers expect inflation to continue advancing, according to the BOE’s quarterly inflation survey, seen now at 2.9% from November’s 2.8%. Industrial and Manufacturing Production during January fell, with the first down by 0.4% as expected, and the second by 0.9%, while yearly basis, both advanced below expected. This upcoming week, the BOE will have a monetary policy meeting, but given that the Bank upgraded its forecasts last month, seems unlikely there will be revisions to inflation or growth. The key benchmark rate is expected to be left unchanged at record lows of 0.25%. Attention will rather center on the Brexit bill that returns to the House of Commons for a final revision. Technically, the pair seems to have decelerate its decline, as in the daily chart, the pair has entered a consolidative stage, with the price still far below a bearish 20 SMA, but technical indicators turning modestly higher within negative territory. In the 4 hours chart, the price keeps struggling around a bearish 20 SMA, whilst technical indicators are unable to enter positive territory, with the RSI indicator turning south around 43, maintaining the risk towards the downside.
Support levels: 1.2130 1.2085 1.2040
Resistance levels: 1.2190 1.2220 1.2260
GOLD
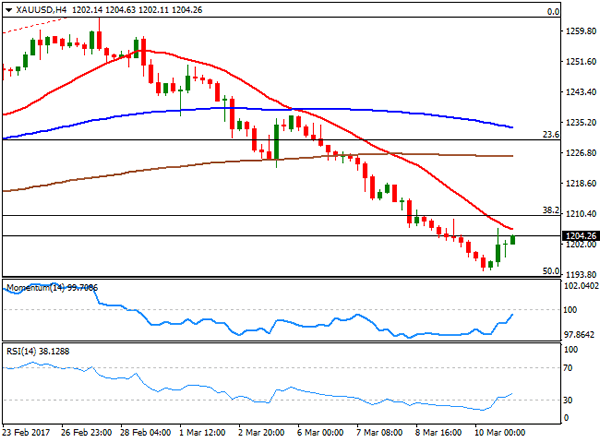
Spot gold ended the week at $1,204.26 a troy ounce, sharply lower for a second consecutive week. The commodity bounced from a fresh multi-week low of 1,194.94 achieved early Friday on hopes the US Federal Reserve will raise rates as soon as this Wednesday. The recovery was triggered by bargain buying aligned around 1,200.00, later extending on news ECB´s Government Council discussed how to begin the process of tapering its facilities’ programs. The daily chart shows that the commodity pared losses after nearing the 50% retracement of its December/January advance at 1,193.00, while also managed to settle above a bearish 100 DMA after briefly falling below it, this last at 1,197.10. In the same chart, technical indicators have pared losses, but the Momentum indicator holds well below its 100 level whilst the RSI indicator stands at 35, both indicating that further gains are still unlikely. The immediate resistance is the 38.2% retracement of the mentioned advance at 1,209.50. In the 4 hours chart, technical indicators corrected extreme oversold conditions, now heading higher, but within bearish territory, whilst the 20 SMA maintains a strong bearish slope right above the current level, indicating a limited upward scope at this point.
Support levels: 1,197.10 1,188.20 1,180.50
Resistance levels: 1,205.60 1,214.20 1,221.70
WTI CRUDE
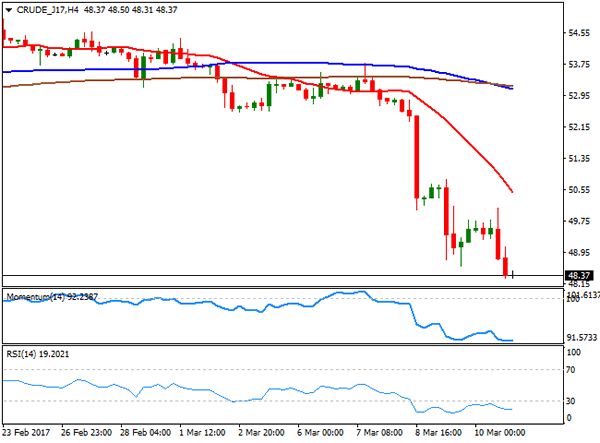
Crude oil prices extended their decline last Friday, with West Texas Intermediate futures settling at $48.37 a barrel, its lowest since November 2016. The black gold was weighed by the continued advance in US production, confirmed on Friday after the Baker Hughes report showed that the number of active rigs drilling oil rose for an eight consecutive week. The US added eight rigs to a total of 617, the highest since September 2015. Earlier in the week, the EIA reported that US crude stockpiles rose to 528.4 million barrels, the highest since record keeping began in 1982. From a technical point of view, US crude is set to decline further, given that in the daily chart, it broke below all of its moving averages, now below the 200 DMA for the first time this year, whilst technical indicators maintain their sharp bearish slopes, despite being in oversold territory, with the RSI indicator currently at 21. In the 4 hours chart, the 20 SMA has turned sharply lower, but still lags price action, currently at 50.50 while technical indicators have turned flat within oversold territory, rather reflecting the limited volume at the end of the week than suggesting downward exhaustion.
Support levels: 48.00 47.30 46.65
Resistance levels: 48.80 49.50 50.10
DJIA
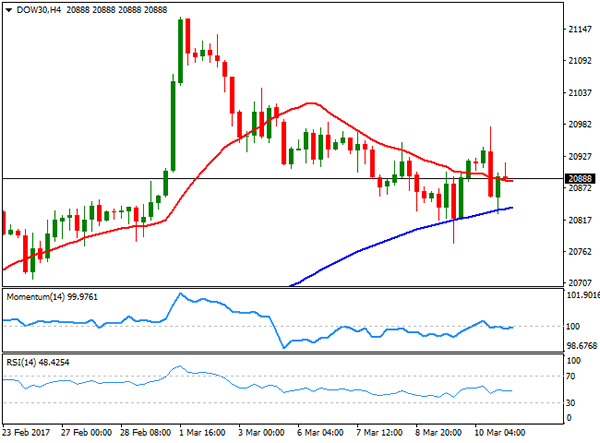
Wall Street closed in the green last Friday, with the Dow Jones Industrial Average up by 44 points, to 20,902.98, down for the week by 0.5%. The Nasdaq Composite added 23 points, and closed at 5,861.73, while the S&P ended at 2,372.60, up by 7 points. A strong US employment report was offset by falling oil prices, as the commodity trimmed its early gains and settled at fresh multi-month lows. Among the Dow, General Electric led advancers, adding 2.09%, followed by UnitedHealth Group that closed 1.17% higher. Boeing led decliners, shedding 1.04%, while Exxon Mobile closed 0.07% lower. Goldman Sachs also closed in the red, down 0.72%. Dow’s daily chart shows that the index continues challenging, but holding, above a bullish 20 SMA, at 20,825, whilst technical indicators have extended their declines within positive territory, with the Momentum indicator nearing its 100 level, and the RSI still around 65. In the 4 hours chart, the index battles around a modestly bearish 20 SMA, but bounced from a bullish 100 SMA whilst technical indicators remain stuck around their mid-lines, indicating some consolidation rather than confirming an upcoming leg lower.
Support levels: 20,825 20,777 20,738
Resistance levels: 20,915 20,978 21,045
FTSE 100
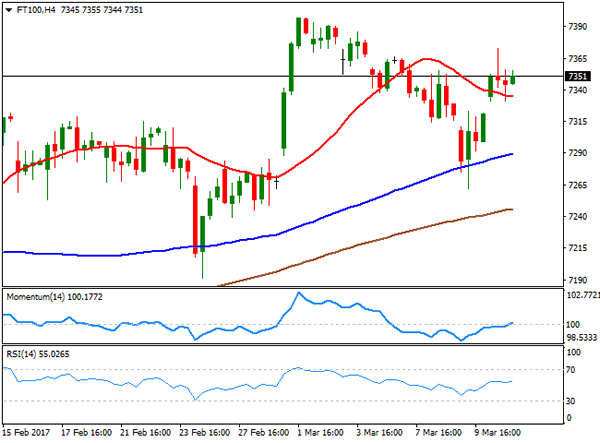
The FTSE 100 pared losses, advancing for the first time in the week on Friday, up 28 points to 7,343.08. The index found support in energy-related shares that closed higher as oil prices recovered at the beginning of the day, although the commodity later plunged, anticipating some negative developments for this Monday. BT Group was the best performer, adding 3.71% after the company announced it will make its Openreach division a legally separate company. Oil company BP added 3,68%, whilst Royal Dutch Shell gained 1.35%. Among mining-related equities, Glencore advanced 1.16% after S&P upgraded its rating on the share, although Randgold Resources was among the worst performers, closing down 1.30%. The daily chart shows that the benchmark has managed to recover above a still bullish 20 DMA, whilst the Momentum indicator has bounced modestly from its 100 level and the RSI indicator turned higher, now around 61, not enough to confirm further advances. In the shorter term and according to the 4 hours chart, the technical stance is positive, but limited, as the index held above a still bearish 20 SMA whilst technical indicators aim higher, coming from oversold levels, but still within neutral territory.
Support levels: 7,332 7,306 7,262
Resistance levels: 7,397 7,420 7,450
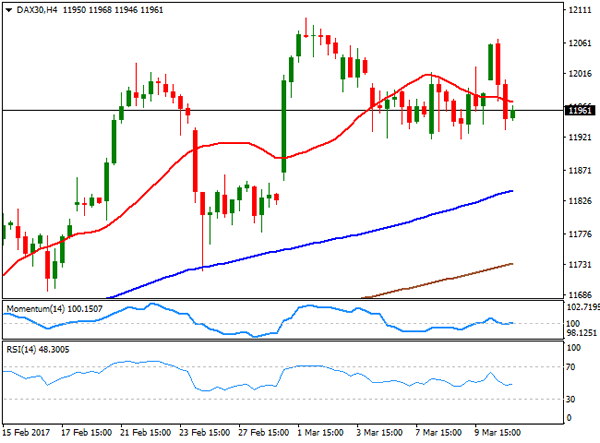
DAX
European equities opened the day with a strong footing, but trimmed all of their daily gains on news indicating that the ECB discussed a rate hike in their latest meeting. EU policymakers discussed possible exit strategies from their ongoing stimulus program, although no decision was made on the matter. The German DAX traded as high as 12,067 before turning south, ending the day down by 15 points at 11,963.18. Financials led the way higher, with Commerzbank leading advancers with a 5.57% gain, followed by Deutsche Bank that gained 2.31%. Leading decliners was Vonovia that closed 1.85% lower. The index remains within a consolidative stage, with a limited bearish scope, given that in the daily chart, it develops above a bullish 20 DMA, currently at 11,909, whilst technical indicators head modestly lower within positive territory, not enough to confirm a bearish continuation. In the 4 hours chart, the index has settled a few points below a modestly bearish 20 SMA, whilst technical indicators are aiming to bounce from their mid-lines, in line with the longer term perspective.
Support levels: 11,909 11,857 11,819
Resistance levels: 12,018 12,067 12,100