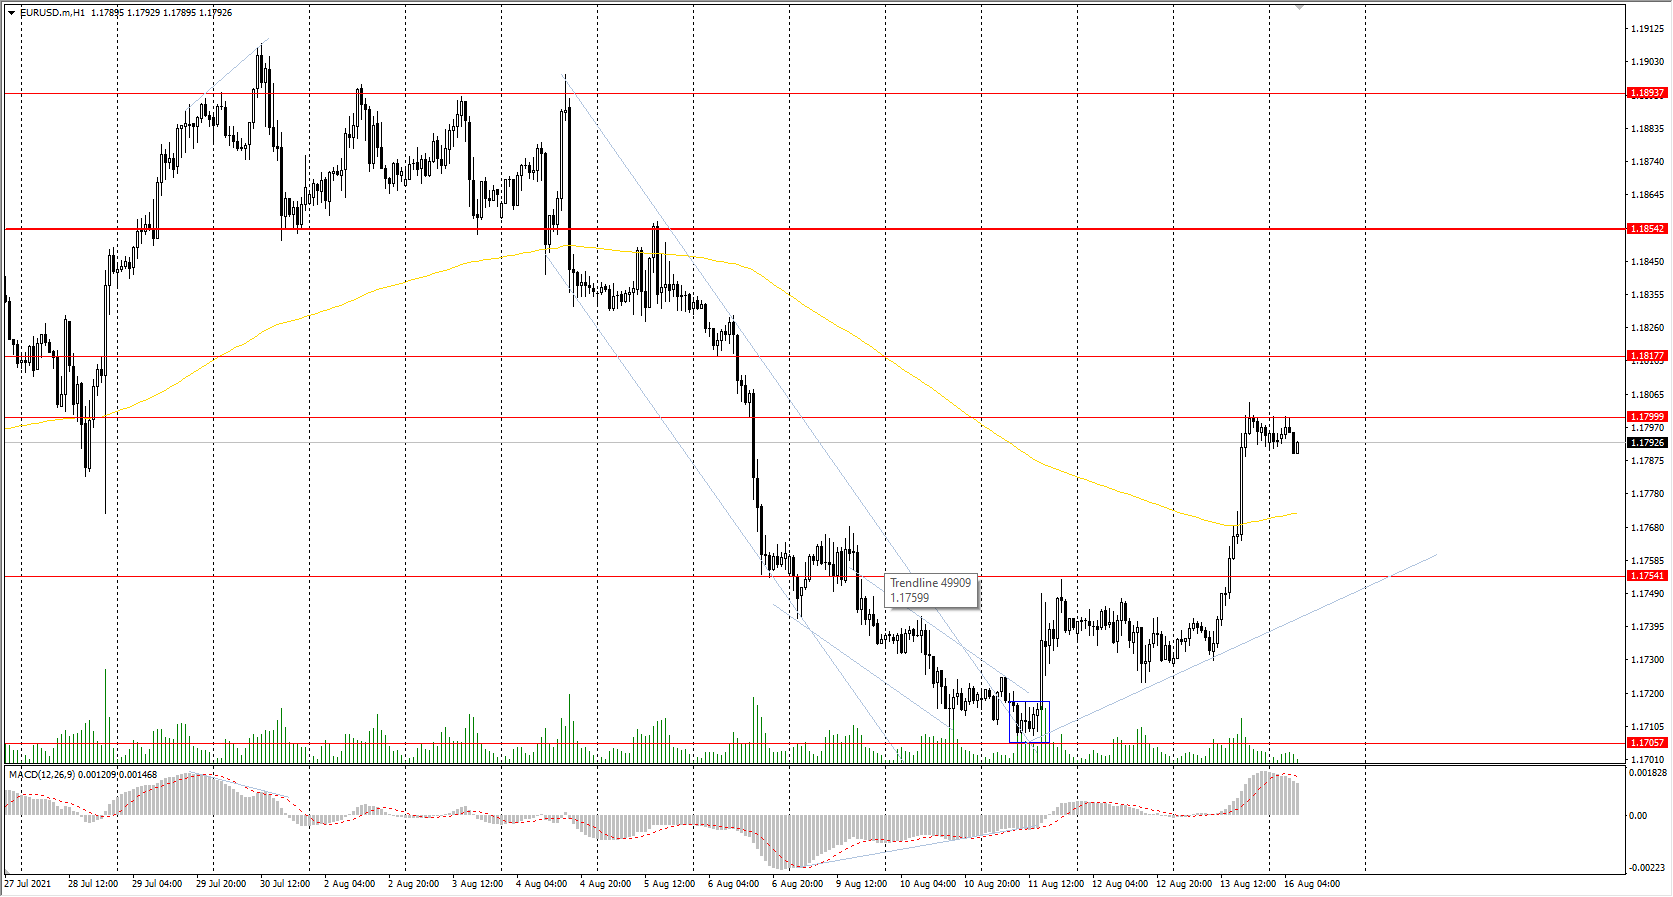
The EUR/USD currency pair
Technical indicators of the currency pair:
Prev Open: 1.1729
Prev Close: 1.1795
% chg. over the last day: +0.56%
The EUR/USD currency pair increased by 0.56% amid a decline in the dollar index. This week the Eurozone will report on inflation, which data will help forecast the future of the ECB policy. At the moment, the ECB is not going to change its monetary policy.
Trading recommendations
Support levels: 1.1754, 1.1706, 1.1609
Resistance levels: 1.1799, 1.1817, 1.1854, 1.1894, 1.1934, 1.1969
From a technical point of view, the general trend on the EUR/USD currency pair is bearish. On Friday, the price rebounded from the daily support level and started to form a corrective upward movement. The MACD indicator has become positive, and there are no signs of a reversal yet. Under such market conditions, it is better to look for the sell deals from the resistance levels after sellers show initiative. Buy trades can be considered only from the support levels within the local upward movement.
Alternative scenario: if the price breaks through the 1.1854 resistance level and fixes above, the mid-term uptrend will likely resume.
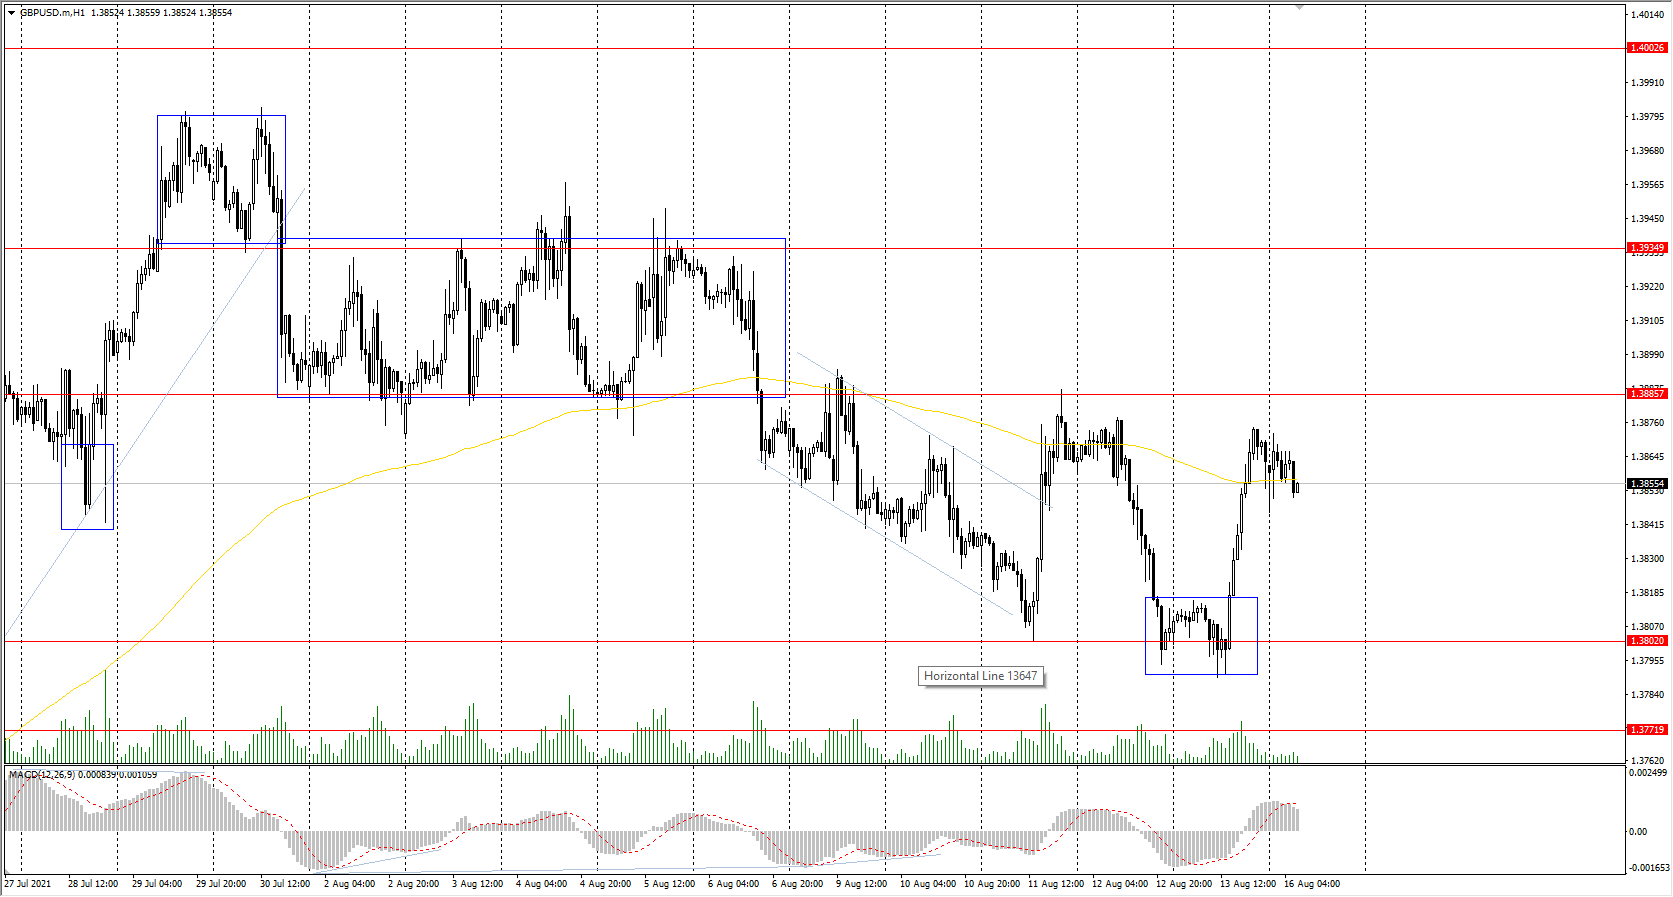
The GBP/USD currency pair
Technical indicators of the currency pair:
Prev Open: 1.3805
Prev Close: 1.3863
% chg. over the last day: +0.42%
The British pound historically correlates with BRENT crude oil prices, which declined on Friday. But the British pound increased by 0.42%. Therefore, the main reason for the growth was the decrease of the dollar index, but not the strengthening of the pound sterling.
Trading recommendations
Support levels: 1.3802, 1.3772, 1.3714, 1.3676 ,1.3641, 1.3614, 1.3525
Resistance levels: 1.3886, 1.3935, 1.4002, 1.4075, 1.4101
The trend of the GBP/USD currency pair is bullish on the hourly time frame. The price rebounded from the support level, where buyers demonstrated the reaction. The MACD indicator has become positive again. Under such market conditions, traders are better to look for the buy trades from the zone where the buyers show initiative. Sell positions can be considered from the resistance levels and only on intraday time frames.
Alternative scenario: if the price breaks through the 1.3714 support level and consolidates below, the bearish scenario is likely to resume.
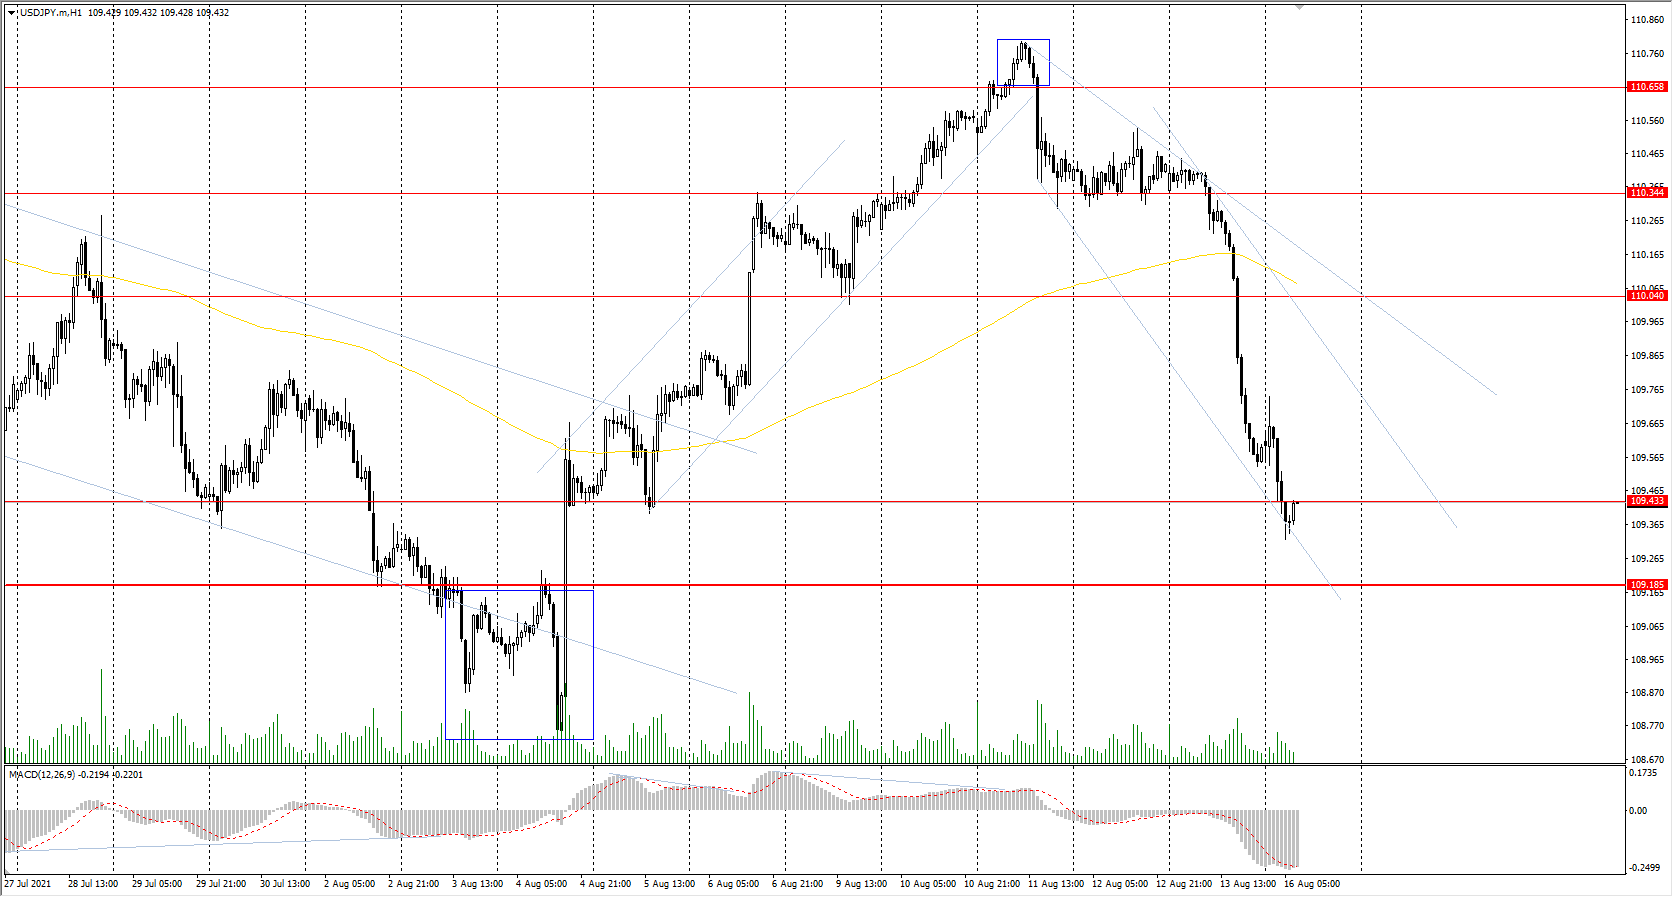
The USD/JPY currency pair
Technical indicators of the currency pair:
Prev Open: 110.35
Prev Close: 109.59
% chg. over the last day: -0.69%
The world’s third-largest economy increased by 1.3% on a year-on-year basis. In Japan, industrial production increased by 0.3% over the last month. But the recovery is much weaker than with other advanced economies. Many analysts expect the growth to remain modest this quarter as the imposition of a state of emergency to combat a spike in infection will negatively impact business activity.
Trading recommendations
Support levels: 109.43, 109.19, 108.65
Resistance levels: 110.04, 110.34, 110.66, 110.95, 111.48
The main trend on the USD/JPY currency pair is bullish. But the price sharply fell below the moving average on Friday and is close to breakthrough the priority change level. The MACD indicator became negative, with no signs of a reversal. Under such market conditions, it is better to look for buy positions from the support level near the priority change level. Sell positions should be considered only on the lower time frames from the zone where the sellers show initiative.
Alternative scenario: if the price falls below 109.19, the uptrend is likely to be broken.
News feed for 2021.08.16:
- Japan GDP (q/q) at 02:50 (GMT+3);
- Japan Industrial Production (m/m) at 07:30 (GMT+3).
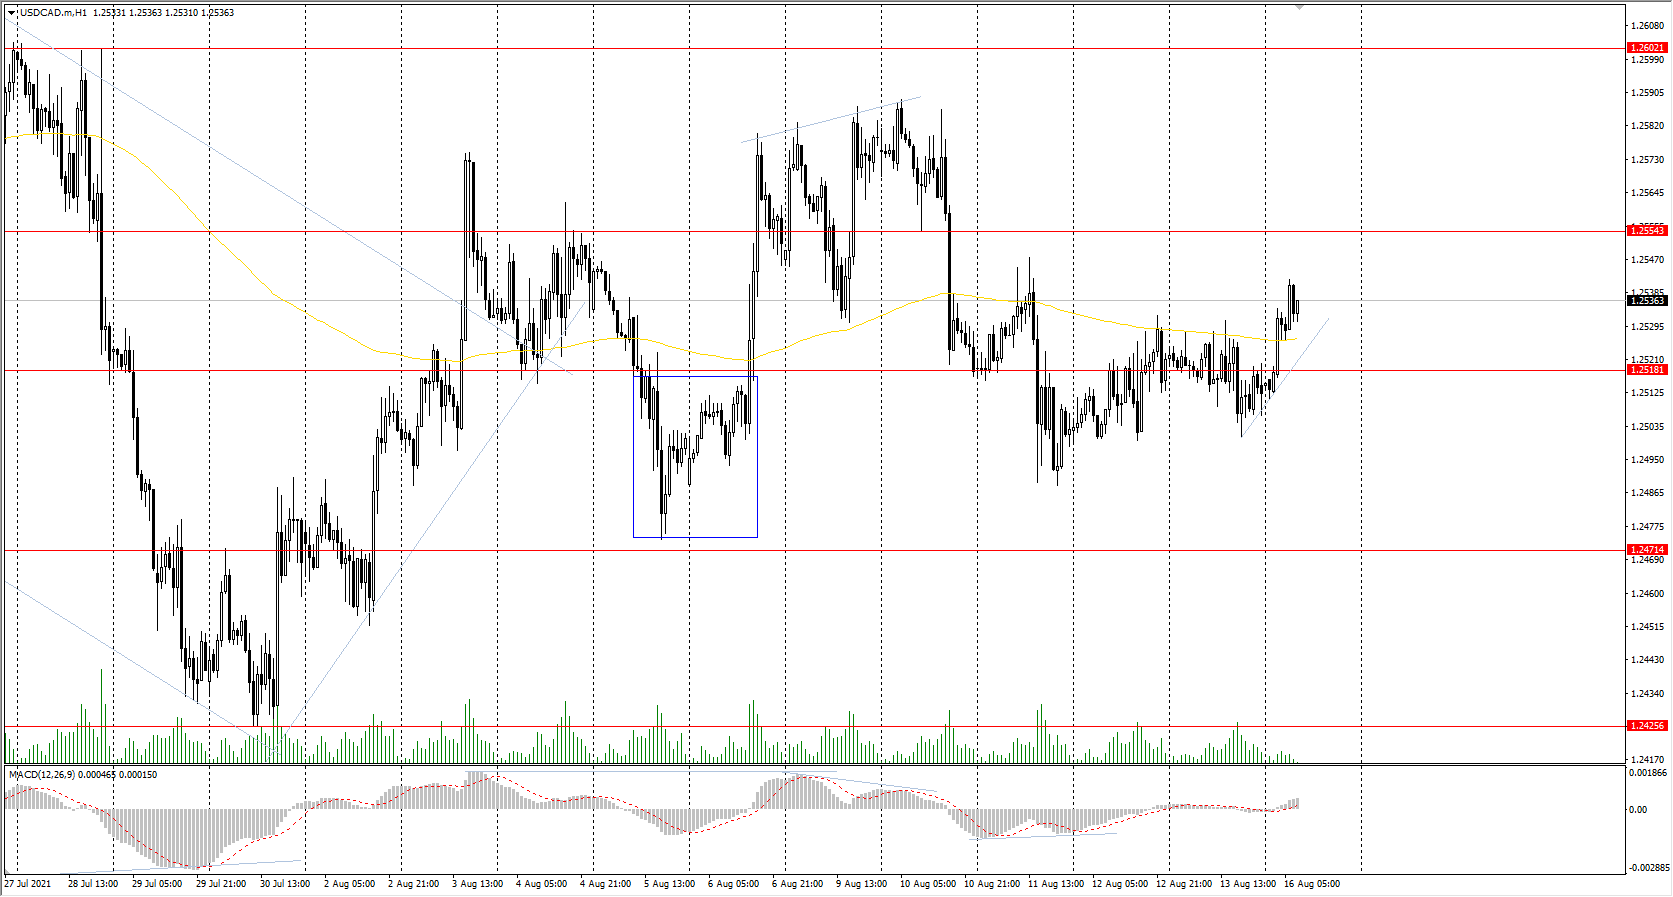
The USD/CAD currency pair
Technical indicators of the currency pair:
Prev Open: 1.2521
Prev Close: 1.2512
% chg. over the last day: -0.07%
The Canadian dollar is highly dependent on the performance of the dollar index and oil price performance. Both the dollar index and oil declined on Friday. As a result, the price of USD/CAD remained in a narrow price range.
Trading recommendations
Support levels: 1.2518, 1.2471, 1.2425, 1.2370, 1.2312
Resistance levels: 1.2554, 1.2602, 1.2671, 1.2787, 1.2951
Considering technical analysis, the USD/CAD trend is bearish. The price is trading near the moving average, and the MACD indicator has crossed the zero line and is growing, indicating buyers’ pressure. Under such market conditions, it is better to look for the sell positions from the resistance levels. Buy positions should be considered from the support levels on intraday timeframes within the local upward movement.
Alternative scenario: if the price breaks through the 1.2671 resistance level and fixes above, the uptrend is likely to be resumed.