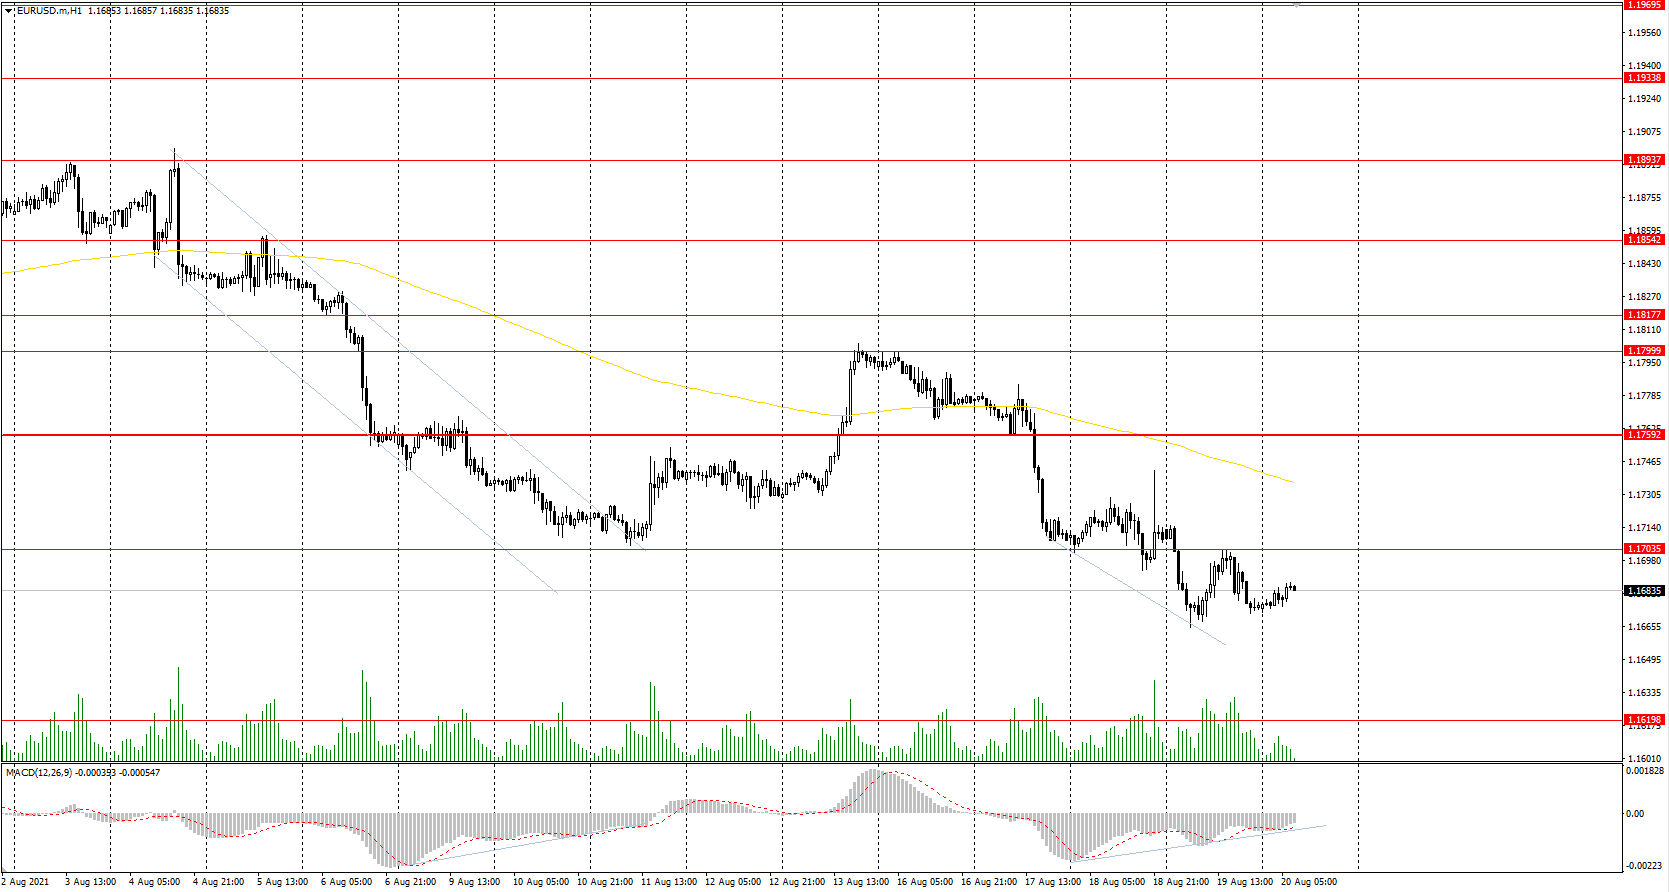
The EUR/USD currency pair
Technical indicators of the currency pair:
Prev Open: 1.1713
Prev Close: 1.1676
% chg. over the last day: -0.32%
The European Central Bank does not intend to take any actions to suppress inflation now. Therefore, the situation with the euro will mainly depend on the dynamics of the dollar index.
Trading recommendations
Support levels: 1.1620
Resistance levels: 1.1704, 1.1759, 1.1799, 1.1817, 1.1854, 1.1894, 1.1934, 1.1969
From a technical point of view, the general trend on the EUR/USD currency pair is bearish. The price is declining within a bearish trend. Under such market conditions, it is better to look for the sell deals from the resistance levels when sellers show the initiative. Buy trades can be considered only from the support levels and only after the buyers’ initiative. There is a divergence that occurred in the MACD indicator, so the price may correct a little bit higher.
Alternative scenario: if the price breaks through the 1.1817 resistance level and fixes above, the mid-term uptrend will likely resume.
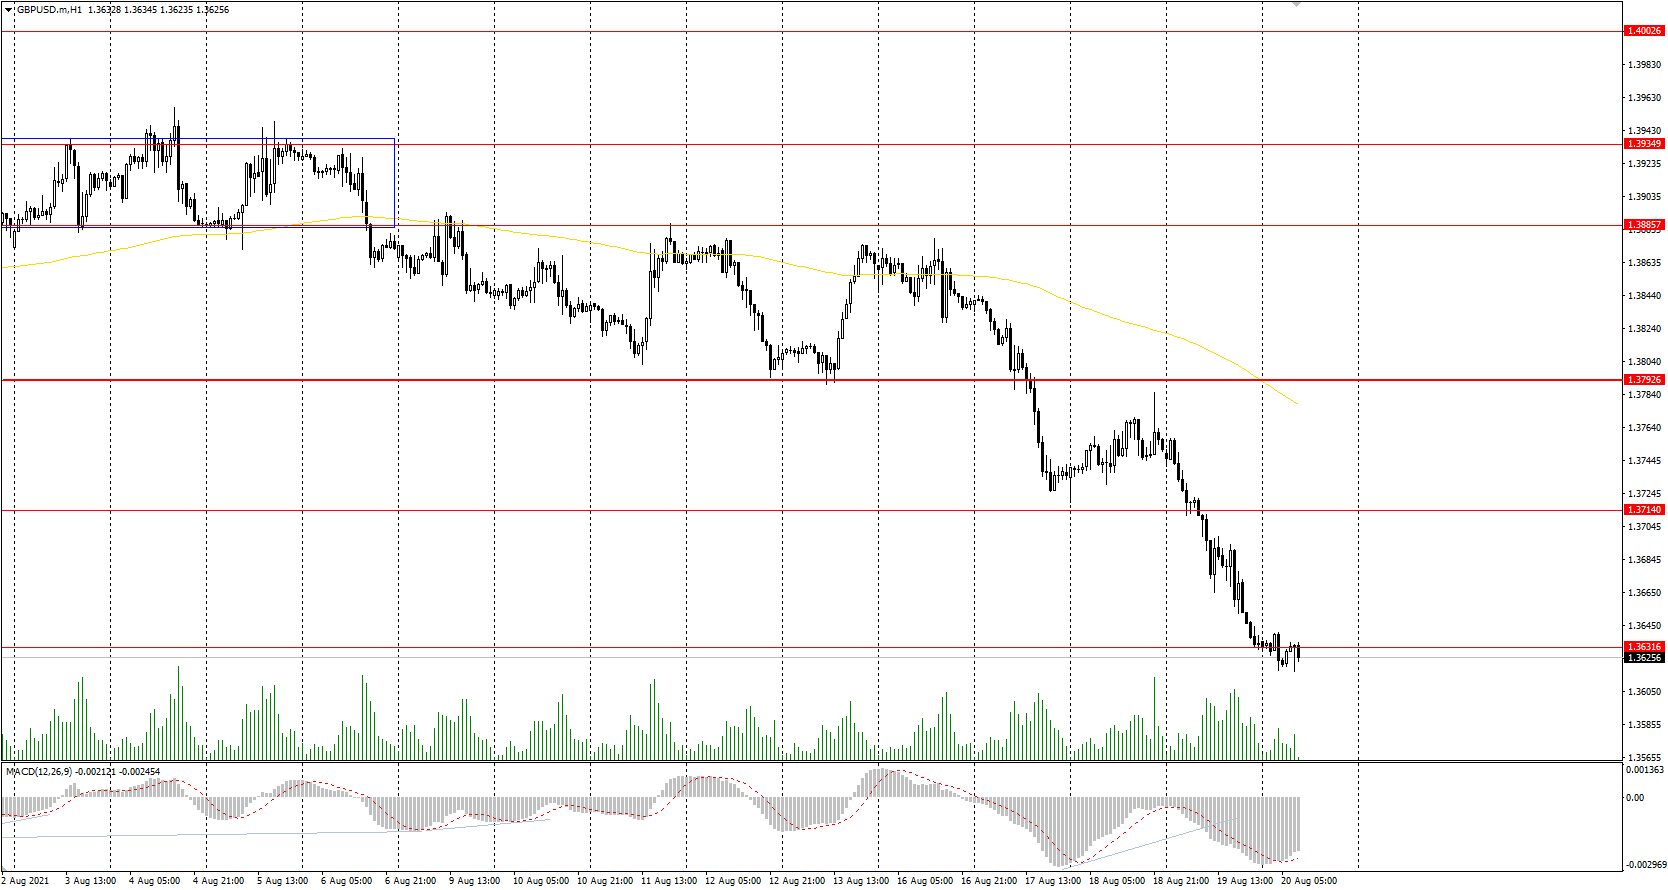
The GBP/USD currency pair
Technical indicators of the currency pair:
Prev Open: 1.3748
Prev Close: 1.3634
% chg. over the last day: -0.84%
Taking into account the slowdown of inflation, the Bank of England has no plans to change its monetary policy. On the one hand, it is a positive factor for economic recovery. On the other hand, monetary policy is now playing against the British pound. Therefore, as a result of the strengthening of the dollar index, the British pound is declining.
Trading recommendations
Support levels: 1.3632, 1.3614, 1.3525
Resistance levels: 1.3714, 1.3793, 1.3772, 1.3886, 1.3935, 1.4002
On the hourly time frame, the trend on the GBP/USD currency pair changed to bearish. The price broke through the priority change level and went down. The MACD indicator is in the negative zone, with no signs of reversal. Under such market conditions, traders are better to look for the sell trades from the resistance levels. But the price has now strongly deviated from the moving average and given the presence of support ahead, there is a high probability of a bounce upwards.
Alternative scenario: if the price breaks through the 1.3793 resistance level and consolidates above, the bullish scenario is likely to resume.
News feed for 2021.08.20:
- UK Retail Sales (m/m) at 09:00 (GMT+3).
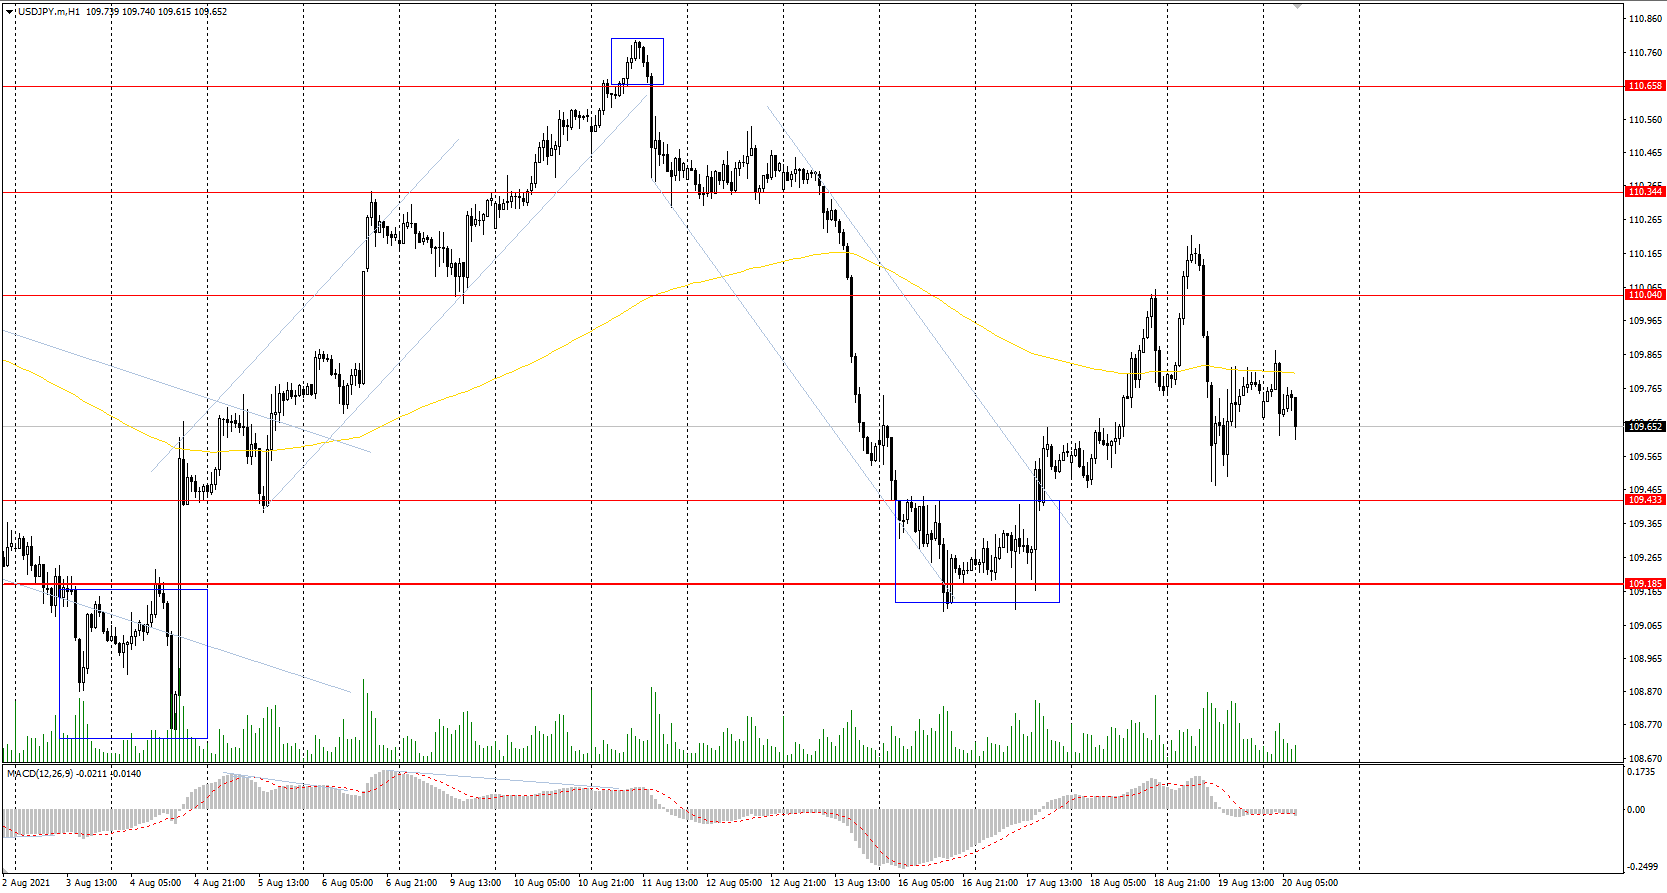
The USD/JPY currency pair
Technical indicators of the currency pair:
Prev Open: 109.77
Prev Close: 109.76
% chg. over the last day: -0.01%
In July, Japan’s consumer price index fell by 0.3% on a year-on-year basis. This didn’t meet the forecasts of economists, who had expected a 0.5% decline. The core consumer price index, which excludes changes in food and fuel prices, fell by 0.2% on a year-on-year basis, beating economists’ expectations. The coronavirus continues to constrain economic activity in most cities across the country. Seven more prefectures are under a state of emergency.
Trading recommendations
Support levels: 110.04, 109.43, 109.19, 108.65
Resistance levels: 110.34, 110.66, 110.95, 111.48
The main trend on the USD/JPY currency pair is bullish. But the price fell again under the moving average. The MACD indicator has become inactive. Under such market conditions, it is better to look for the buy positions from the support levels, where the buyers show initiative. Sell positions should be considered only on the lower timeframes from the resistance levels with short targets.
Alternative scenario: if the price falls below 109.18, the uptrend is likely to be broken.
News feed for 2021.08.20:
- Japan National Core Consumer Price Index (m/m) at 02:30 (GMT+3).
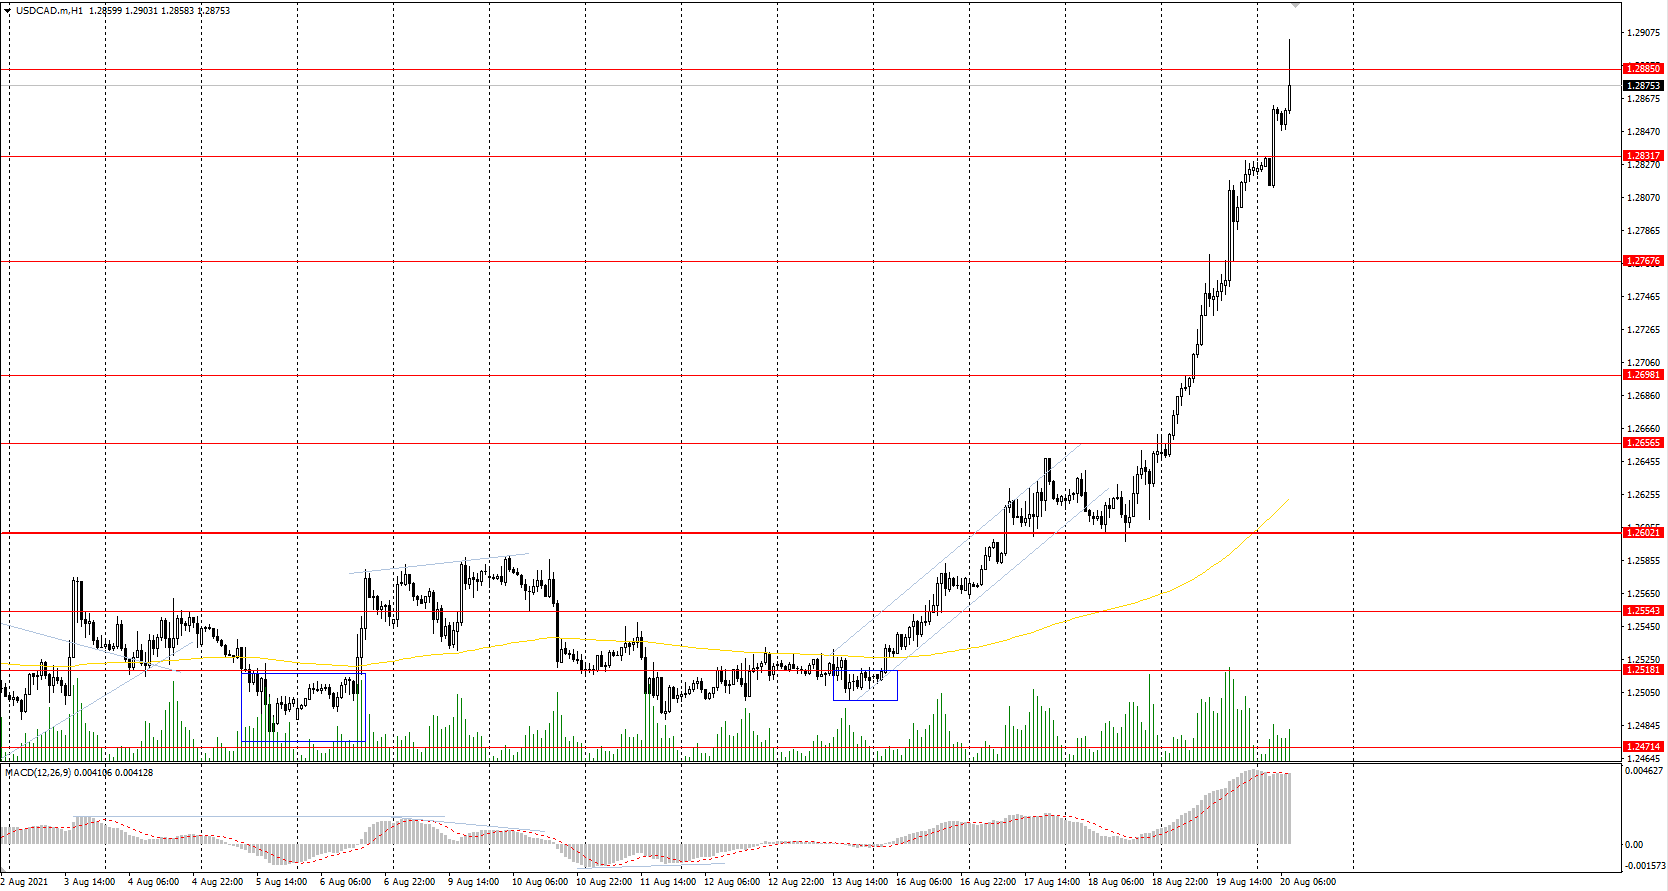
The USD/CAD currency pair
Technical indicators of the currency pair:
Prev Open: 1.2651
Prev Close: 1.2825
% chg. over the last day: +1.33%
The USD/CAD currency pair is rising amid the strengthening of the dollar index and falling oil prices. The Canadian dollar is highly dependent on these two assets, especially on oil prices, since the CAD is a commodity currency.
Trading recommendations
Support levels: 1.2832, 1.2767, 1.2698, 1.2656
Resistance levels: 1.2885, 1.2951
In terms of technical analysis, the trend on the USD/CAD currency pair is bullish. The quotes have been growing for 5 trading sessions in a row. But now the price has deviated strongly from the moving average; the MACD indicator is in the overbought zone with signs of a hidden divergence. Under such market conditions, traders are better to look for sell positions from the resistance levels after sellers show the initiative. Buy positions should be considered from the support levels after a slight pullback below.
Alternative scenario: if the price breaks through the 1.2602 support level and fixes below, the uptrend is likely to be broken.