The yellow metal has continued to trade in the 1,810.00/1,815.00 zone. However, on Wednesday, a USD drop was caused by the US ADP payrolls. The event created a test of the 1,820.00 price level for gold. The 1,820.00 mark provided resistance and the bullion returned to trade in the previous zone.
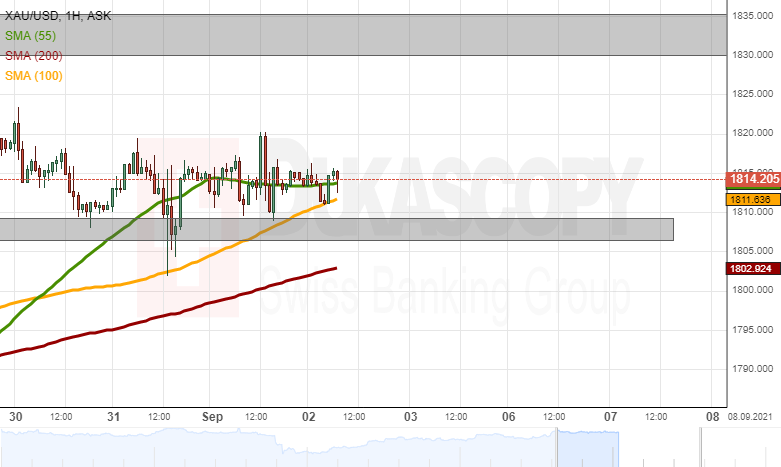
Meanwhile, on Thursday morning, the 100-hour simple moving average caught up with the price. If the SMA provides enough support for a surge to start, the price would test the resistance of the 1,820.00 level. A breaking of the 1,820.00 level most likely could result in a test of the high level zone at 1,830.00/1,835.00.
On the other hand, a decline of the rate below the 55 and 100-hour SMAs and the 1,810.00 level would look for support in the 200-hour simple moving average at 1,803.00.