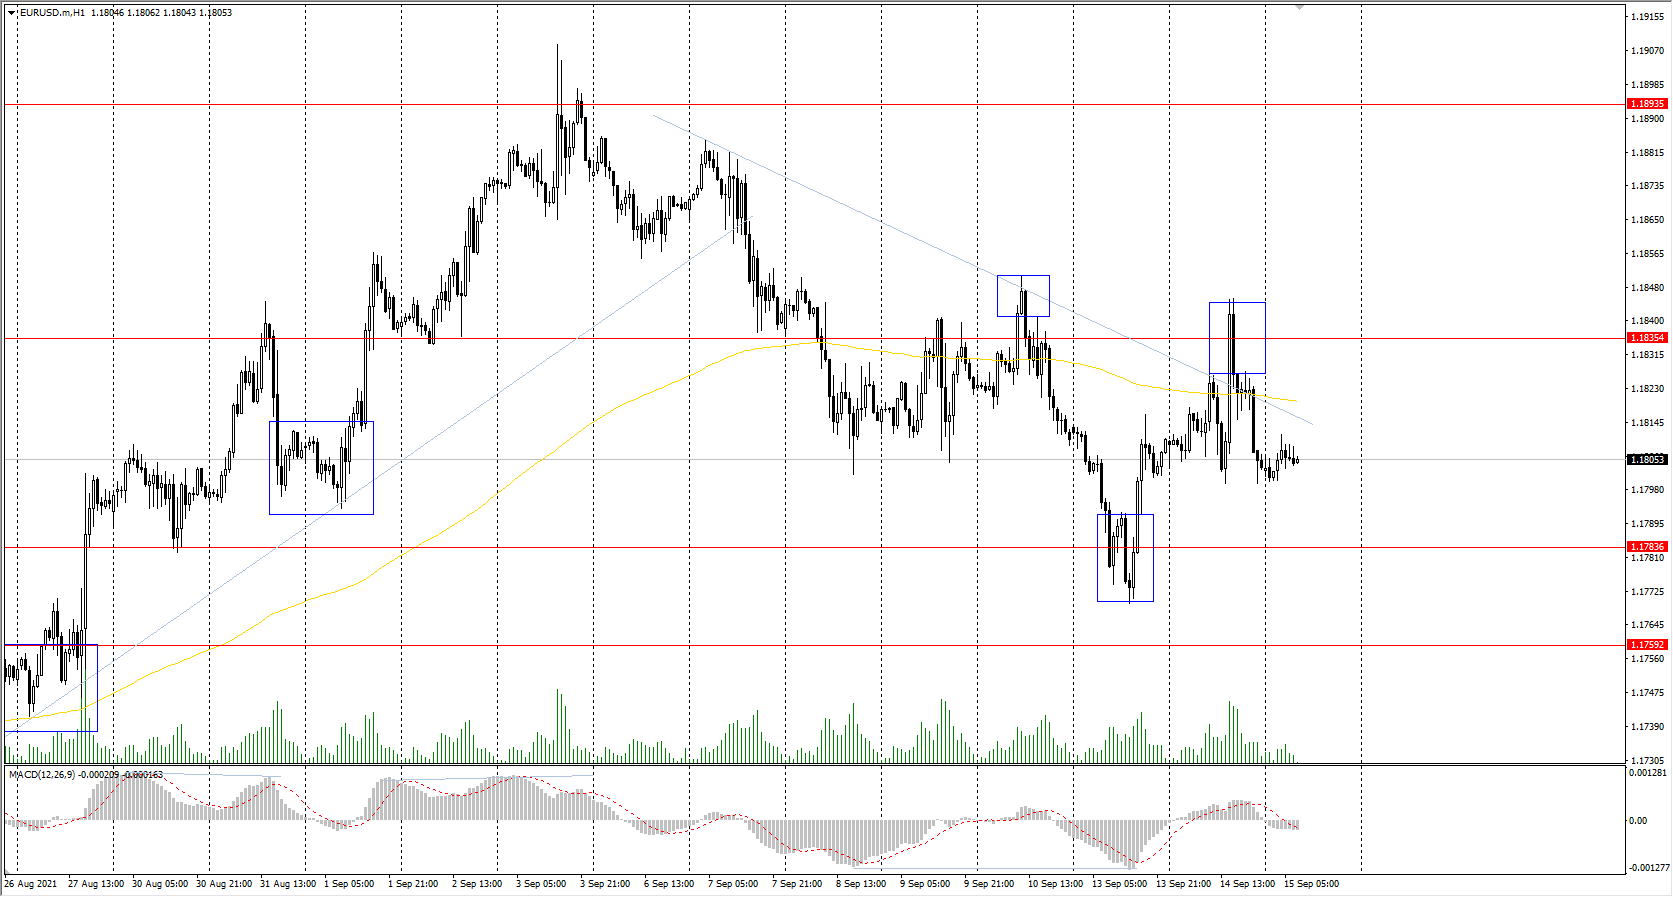
The EUR/USD currency pair
Technical indicators of the currency pair:
Prev Open: 1.1810
Prev Close: 1.1804
% chg. over the last day: -0.05%
The slowdown in consumer price growth in the US has slightly eased investors’ fears that the Federal Reserve may cut its stimulus program too soon. The dollar index has slightly strengthened during the release of this news, and now investors are waiting for the Eurozone inflation data to be released on Thursday.
Trading recommendations
Support levels: 1.1783, 1.1759, 1.1704, 1.1620
Resistance levels: 1.1835, 1.1894, 1.1934, 1.1969
From the technical point of view, the general trend on the EUR/USD currency pair is bullish. The MACD indicator is in the negative zone, but there are no signs of buyers’ and sellers’ strength. Under such market conditions, buy trades can be considered from the support levels where buyers show initiative. It is better to look for sell trades from the resistance levels above the moving average and only with short targets.
Alternative scenario: if the price breaks through the 1.1704 support level and fixes below, the mid-term uptrend will likely be broken.
News feed for 2021.09.15:
- Eurozone Industrial Production (m/m) at 12:00 (GMT+3);
- US Industrial Production (m/m) at 16:15 (GMT+3).
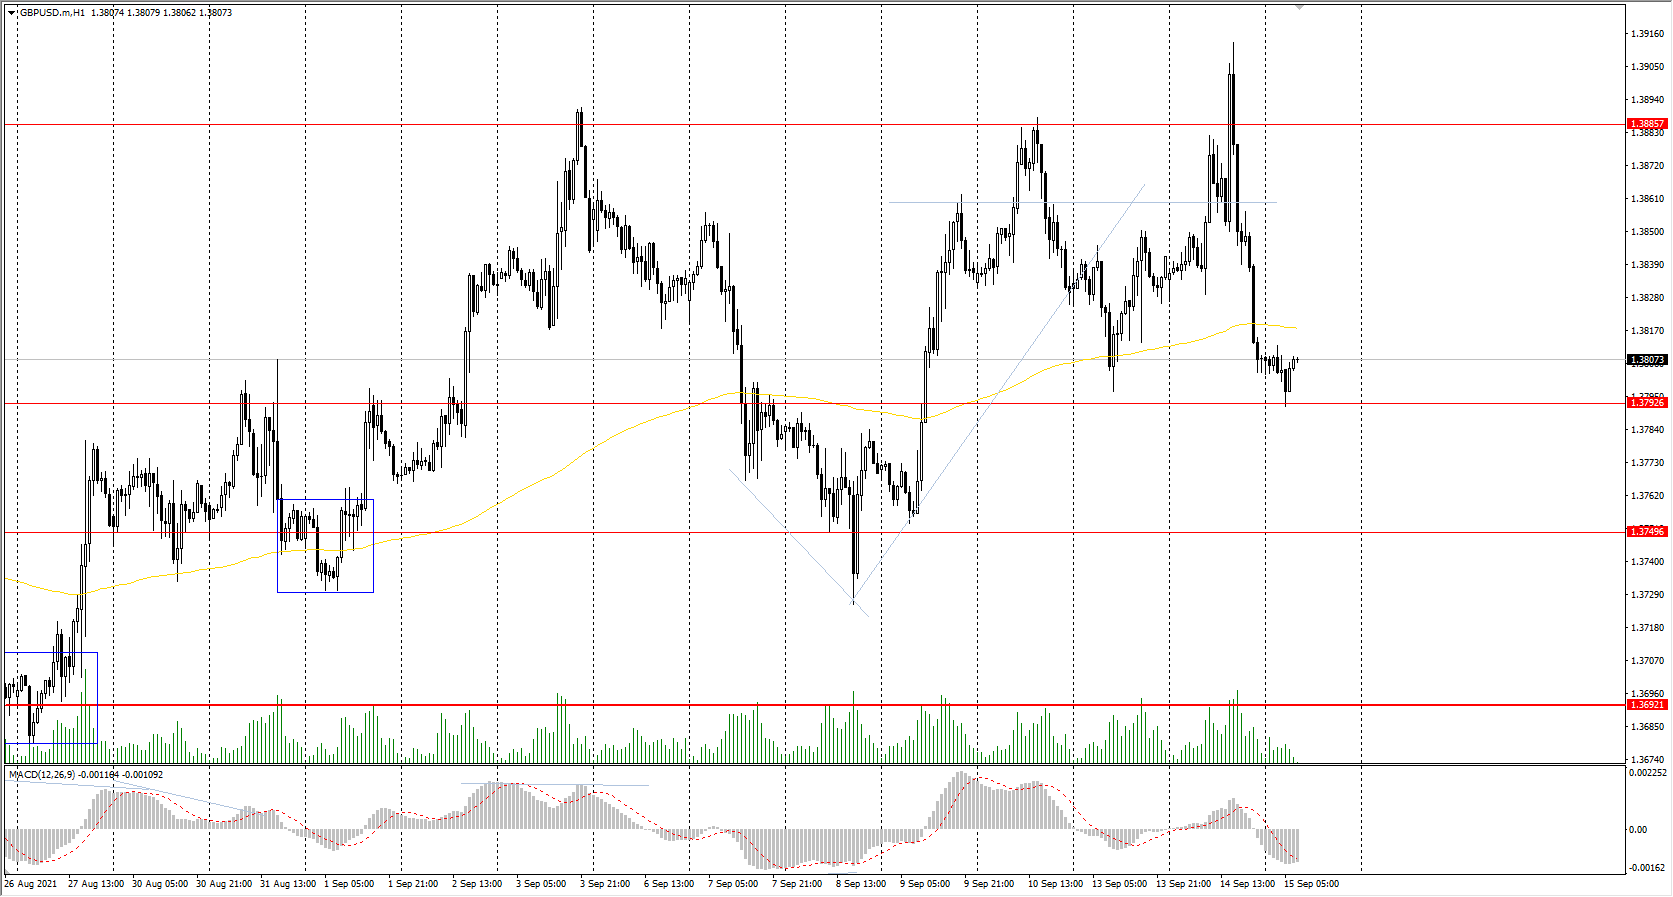
The GBP/USD currency pair
Technical indicators of the currency pair:
Prev Open: 1.3834
Prev Close: 1.3808
% chg. over the last day: -0.19%
In the UK, labor market data showed that the total employment exceeded the pre-pandemic level, and the unemployment rate fell to 4.6% (previous – 4.7%). Inflation data will be released today. The Bank of England expects inflation to rise sharply this year and reach a peak of 4%. Strong inflation will strengthen expectations that the Bank of England will tighten monetary policy faster than the European Central Bank or the US Federal Reserve.
Trading recommendations
Support levels: 1.3793, 1.3750, 1.3692, 1.3632, 1.3614, 1.3525
Resistance levels: 1.3886, 1.3935, 1.4002
On the hourly time frame, the GBP/USD trend is bullish. But against the background of the dollar index growth, the growth of GBP/USD quotes is limited. The MACD indicator has become negative. Under such market conditions, it is better to look for buy trades from the support levels near the moving average line. Sell positions can be considered from the resistance levels with short targets throughout the day.
Alternative scenario: if the price breaks through the 1.3692 support level and consolidates below, the bearish scenario will likely resume.
News feed for 2021.09.15:
- UK Consumer Price Index (m/m) at 09:00 (GMT+3).
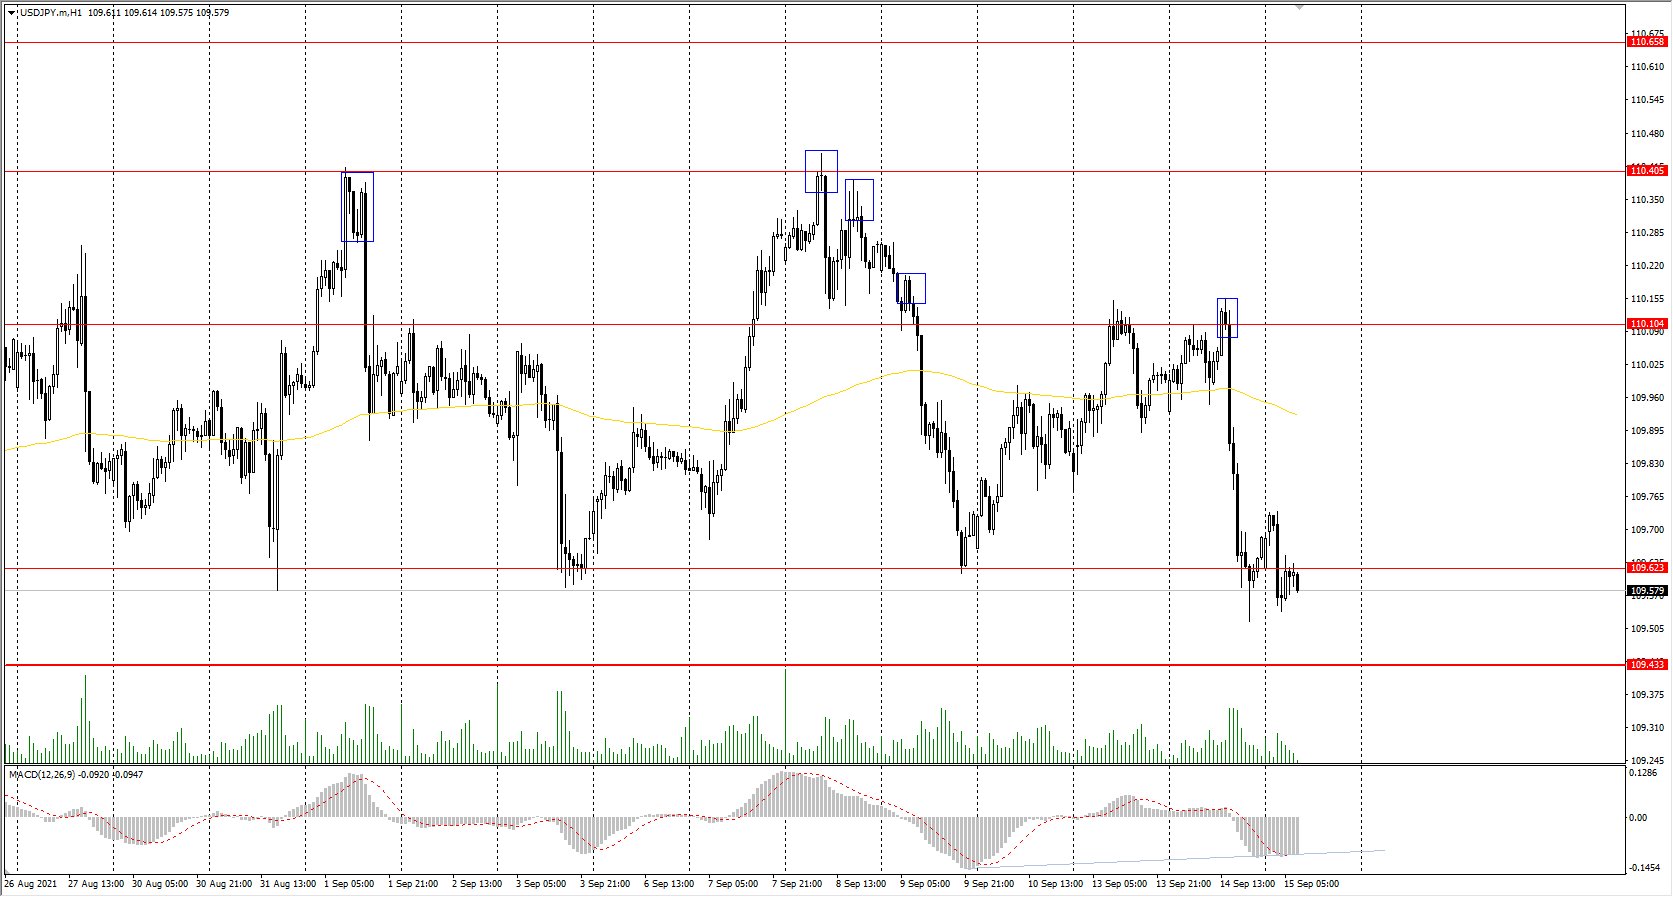
The USD/JPY currency pair
Technical indicators of the currency pair:
Prev Open: 109.93
Prev Close: 109.68
% chg. over the last day: -0.23%
Japan’s economic prospects remain bleak. Japan’s automotive sector is experiencing difficulties due to delays in global supply chains. Japan’s economy grew at a faster-than-expected pace in the second quarter of this year. Still, due to tight restrictions in most of the country, economists expect a slowdown in the pace of recovery based on the results of the third quarter.
Trading recommendations
Support levels: 109.62, 109.43, 109.19, 108.65
Resistance levels: 110.11, 110.40, 110.66, 110.95, 111.48
The main trend on the USD/JPY currency pair is bullish. But the Japanese yen has been showing strength recently, even despite the rise in the dollar index. The MACD indicator has become negative, but there are signs of sellers’ weakness. Under such market conditions, traders should look for buy trades from the support level of 109.43, which is also a priority change level. Sell positions should be considered on the lower time frames with short targets from the zones where sellers show initiative.
Alternative scenario: if the price falls below 109.43, the uptrend is likely to be broken.
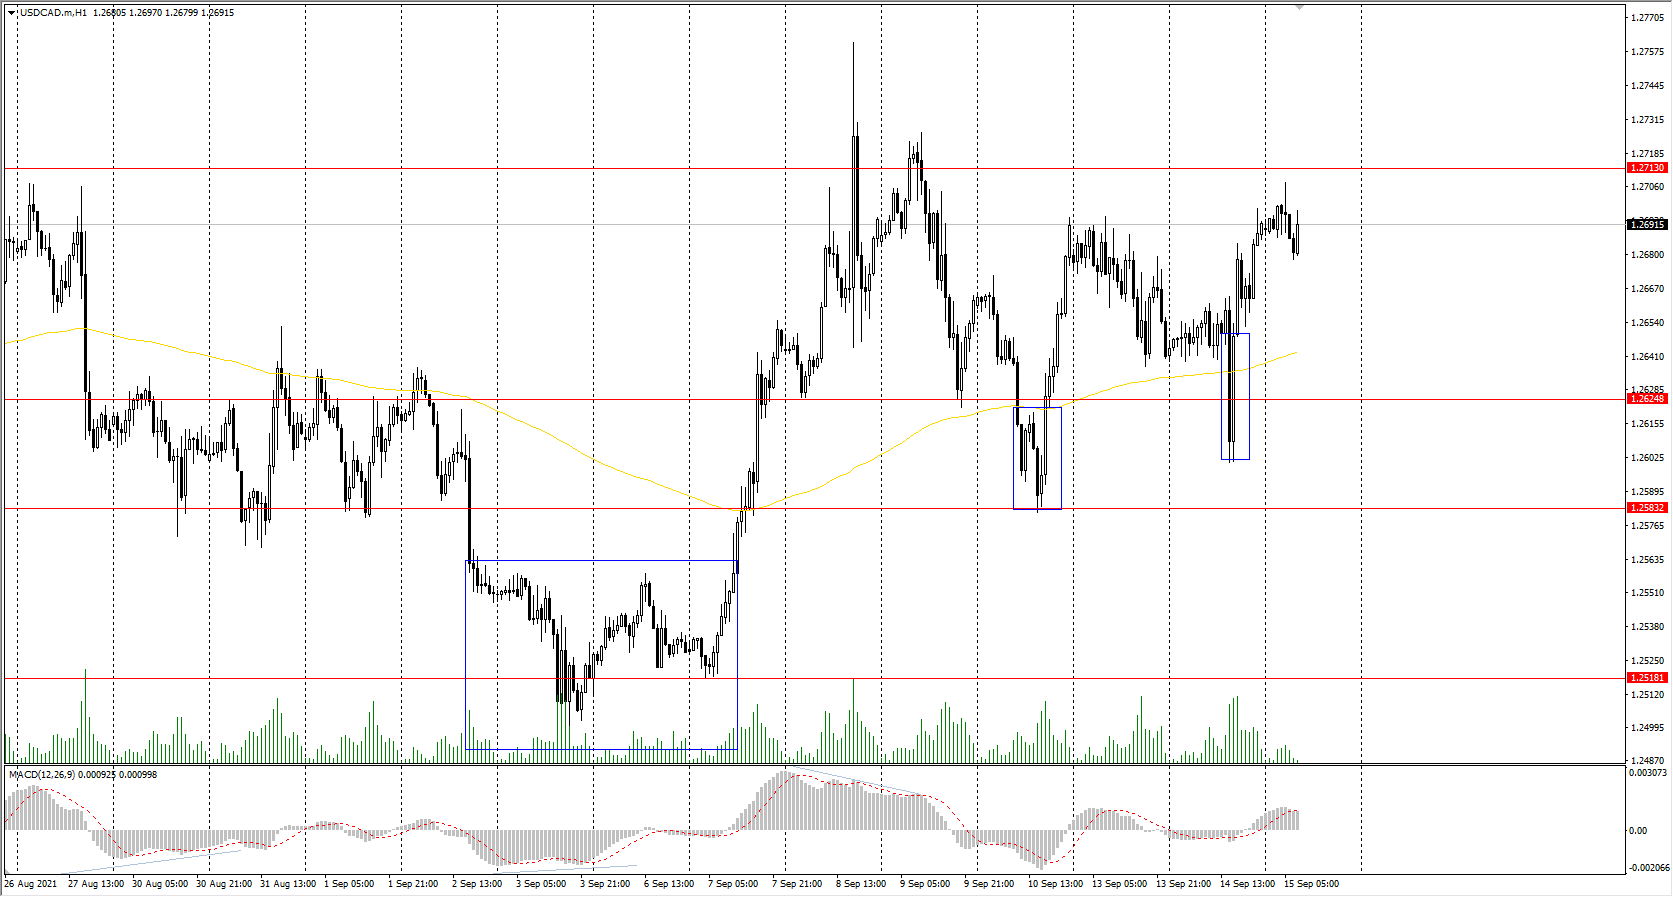
The USD/CAD currency pair
Technical indicators of the currency pair:
Prev Open: 1.2642
Prev Close: 1.2692
% chg. over the last day: +0.40%
The Canadian dollar is a commodity currency, so the USD/CAD currency pair is highly dependent on the dynamics of the dollar index and oil prices. Yesterday, the dollar index increased while oil prices went down. As a result, the price of USD/CAD increased by almost half a percent.
Trading recommendations
Support levels: 1.2625, 1.2583, 1.2518, 1.2425
Resistance levels: 1.2713, 1.2812, 1.2891, 1.2951
In terms of technical analysis, the trend on the USD/CAD currency pair is bearish. But due to the growth of the dollar index, the price has consolidated in a local correctional upward movement. The MACD indicator is in the positive zone again. Buy positions can be considered from the support levels where buyers show initiative, and only with short targets. It is better to look for sell positions from the resistance levels of a higher time frame.
Alternative scenario: if the price breaks through the 1.2812 resistance level and fixes above, the uptrend will likely resume.