
The Swiss Market Index (SMI) is one of the other Capital Markets worldwide that is building motive wave from the lows of March 2020. We can clearly see that it has already completed 3 waves to the upside and we are correcting on wave 4 now.
SMI daily chart
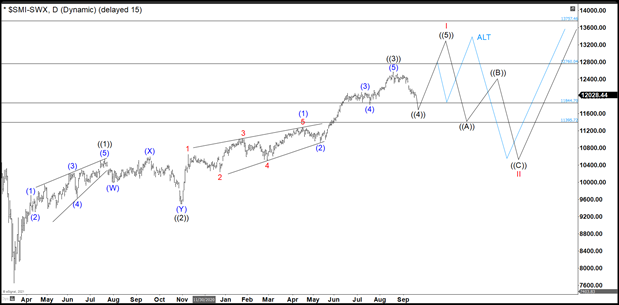
Wave ((1)) ends at 10534 as leading diagonal. Wave ((2)) did a double correction to complete at 9498. Then the SMI bounce from there developed another impulse as wave ((3)). The wave (1) of ((3)) did another leading diagonal. If you want to learn more about Elliott Wave Theory, please follow this link: Elliott Wave Theory). Then wave (2) of ((3)) was short ending at 10922. Wave (3) of ((3)) impulse ends at 12088 and wave (4) of ((3)) pullback at 11800. Last push to complete wave (v) of ((3)) and wave ((3)) peak at 12582.
Currently, we are developing wave ((4)) that should find support in 11844 – 11395 area and continue higher to complete the impulse from March 2020 low. This last swing should end in 13757 – 12760 area where wave I of upper degree will end and we should correct the whole cycle in wave II. As SMI ALT view in blue, wave ((3)) could not be completed and needs one more swing high to finish it and then we will see a pullback an a last push to complete the impulse.


