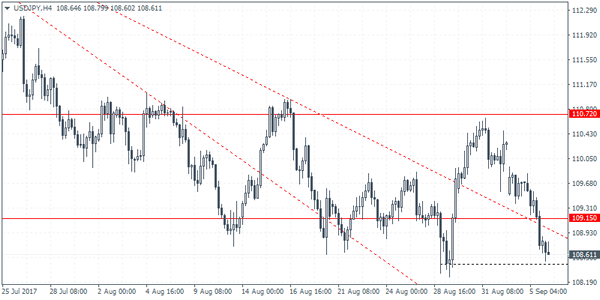
USDJPY (108.61): The USDJPY turned bearish yesterday as price action closed below 109.15. The declines could now see the US dollar slip towards the lower end of the support at 108.26. On the daily chart, this also increases the downside risk as the price is trading in this support level. With the descending triangle pattern being formed, a breakdown below 108.26 support could spell further declines. However, there is scope for USDJPY to form a double bottom pattern near 108.46 which falls with the daily chart’s support zone. A reversal off this level cannot be ruled out, however, which could build the upside bias. The previously established support level at 109.15 will likely serve as resistance in the near term with further gains coming on a breakout above this level only.