The EUR/USD currency pair
Technical indicators of the currency pair:
Prev Open: 1.1565
Prev Close: 1.1553
% chg. over the last day: -0.10%
The European Commission will consider joint gas purchases for EU countries as a response to the energy price hike. European companies are switching to the tight coal market due to soaring gas prices, but coal prices are also breaking records. Europe’s energy crisis could accelerate inflation in the region.
Trading recommendations
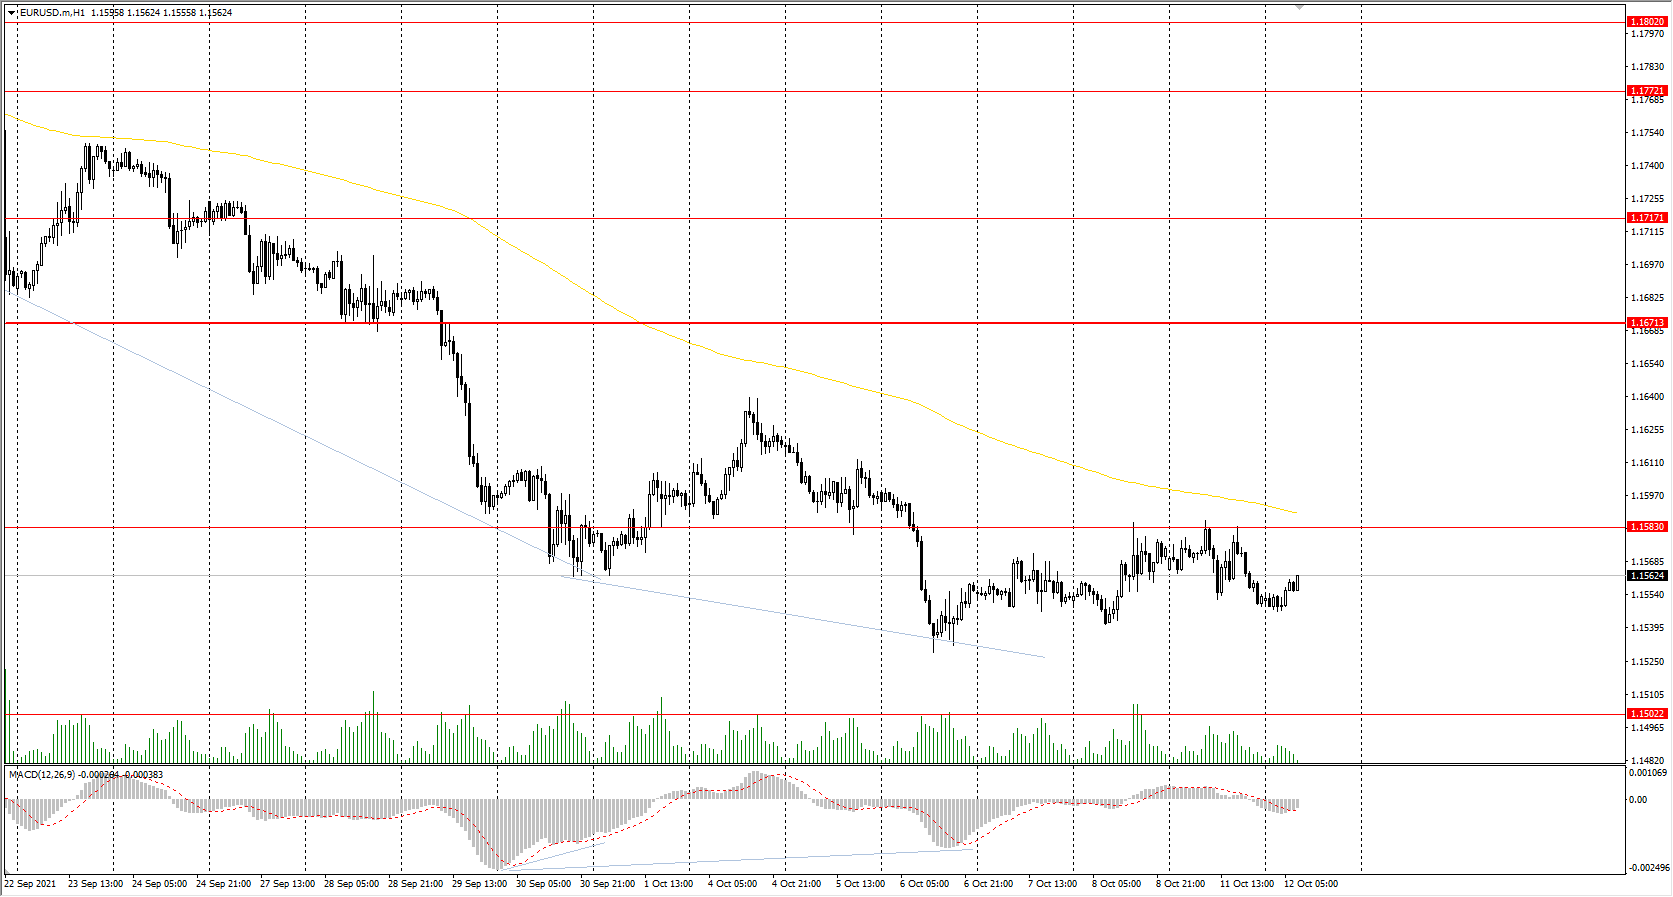
Support levels: 1.1502, 1.1453
Resistance levels: 1.1583, 1.1671, 1.1717, 1.1772, 1.1802, 1.1835
From the technical point of view, the EUR/USD trend is bearish. The MACD indicator has become inactive. The price is trading in a corridor. Under such market conditions, traders should consider sell deals from the resistance levels near the moving average. Buy trades should be considered only from the support levels with additional confirmation in the form of a buyers’ initiative.
Alternative scenario: if the price breaks out through the 1.1671 resistance level and fixes above, the mid-term uptrend will likely resume.
News feed for 2021.10.12:
- Germany ZEW Economic Sentiment (m/m) at 12:00 (GMT+3);
- Eurozone ZEW Economic Sentiment (m/m) at 12:00 (GMT+3);
- US JOLTs Job Openings (m/m) at 17:00 (GMT+3);
- US FOMC Member Clarida’s Speech at 18:15 (GMT+3);
- US FOMC Member Bostic’s Speech at 19:30 (GMT+3).
The GBP/USD currency pair
Technical indicators of the currency pair:
Prev Open: 1.3609
Prev Close: 1.3594
% chg. over the last day: -0.11%
The UK considers helping industries hit by high energy prices. Global bank analysts believe that the Bank of England will raise interest rates by 15 basis points as early as this December.
Trading recommendations
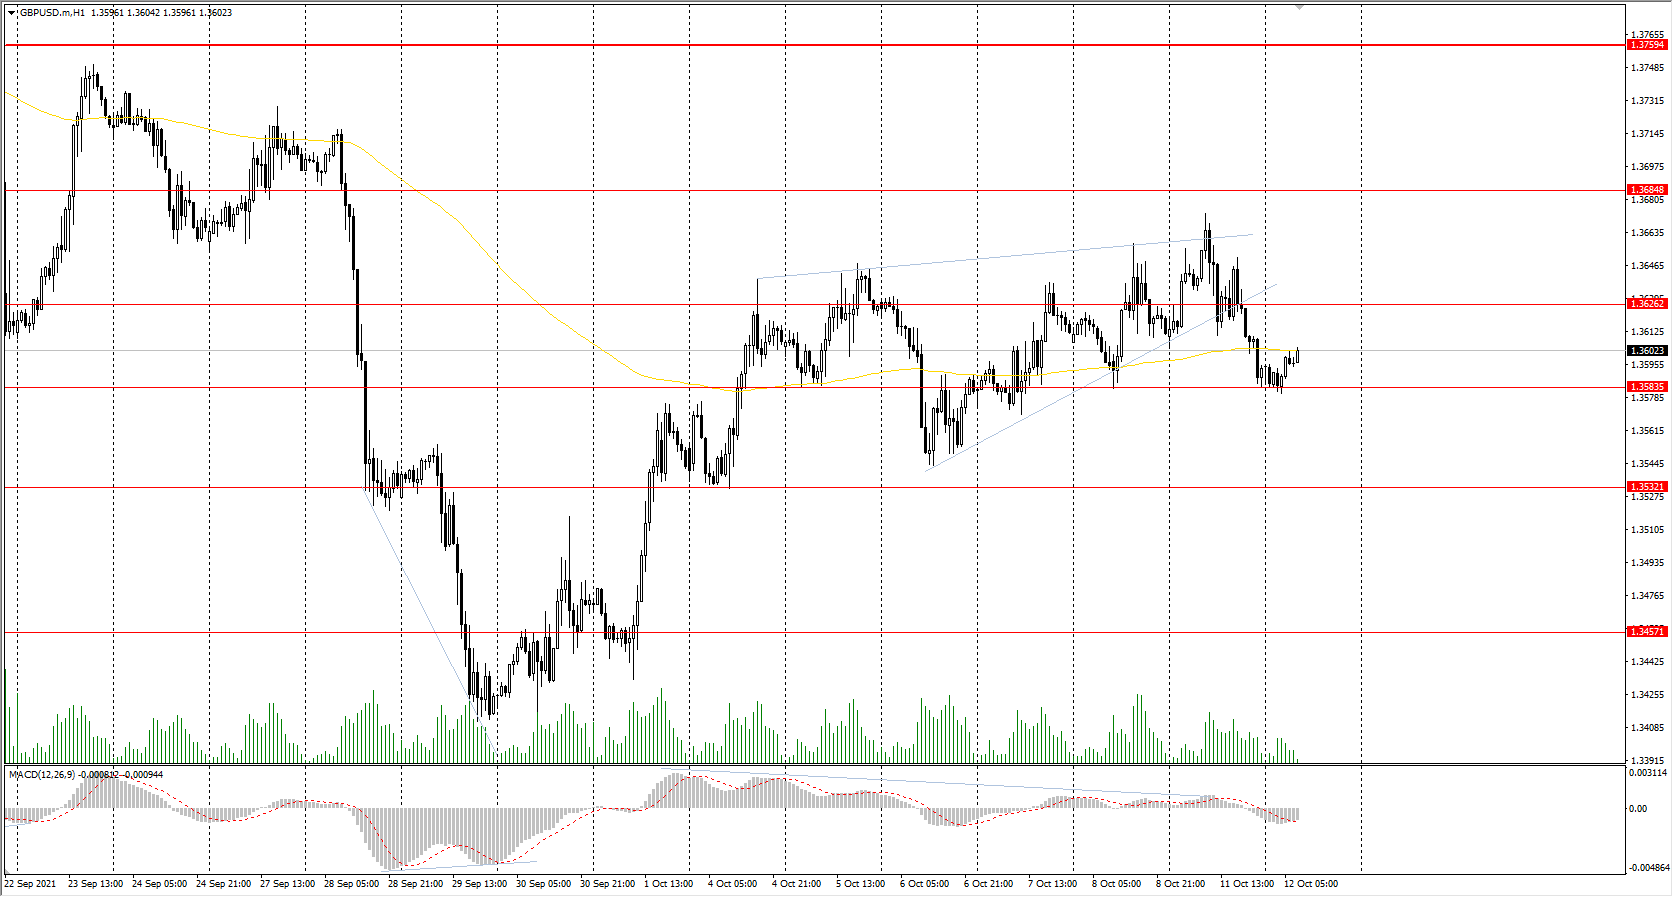
Support levels: 1.3584, 1.3532, 1.3457, 1.3360, 1.3282
Resistance levels: 1.3626, 1.3685, 1.3759, 1.3812, 1.3886
On the hourly time frame, the GBP/USD trend is bearish. However, the British currency looks more confident than the euro due to its direct correlation with oil prices. The MACD indicator has turned negative. The price broke down the triangle pattern. Buy trades should be considered only within the day and after the initiative price returns to the triangle. It is best to look for sell trades from the nearest resistance levels.
Alternative scenario: if the price breaks out through the 1.3759 resistance level and consolidates above, the bullish scenario is likely to resume.
News feed for 2021.10.12:
- UK Average Earnings Index (m/m) at 09:00 (GMT+3);
- UK Claimant Count Change (m/m) at 09:00 (GMT+3);
- UK Unemployment Rate (m/m) at 09:00 (GMT+3).
The USD/JPY currency pair
Technical indicators of the currency pair:
Prev Open: 112.14
Prev Close: 113.32
% chg. over the last day: +1.05%
The producer price index, which reflects the inflation rate for corporate goods or business-to-business inflation, reached 6.3% (previous value 5.8%), the highest level since August 2008.
Trading recommendations
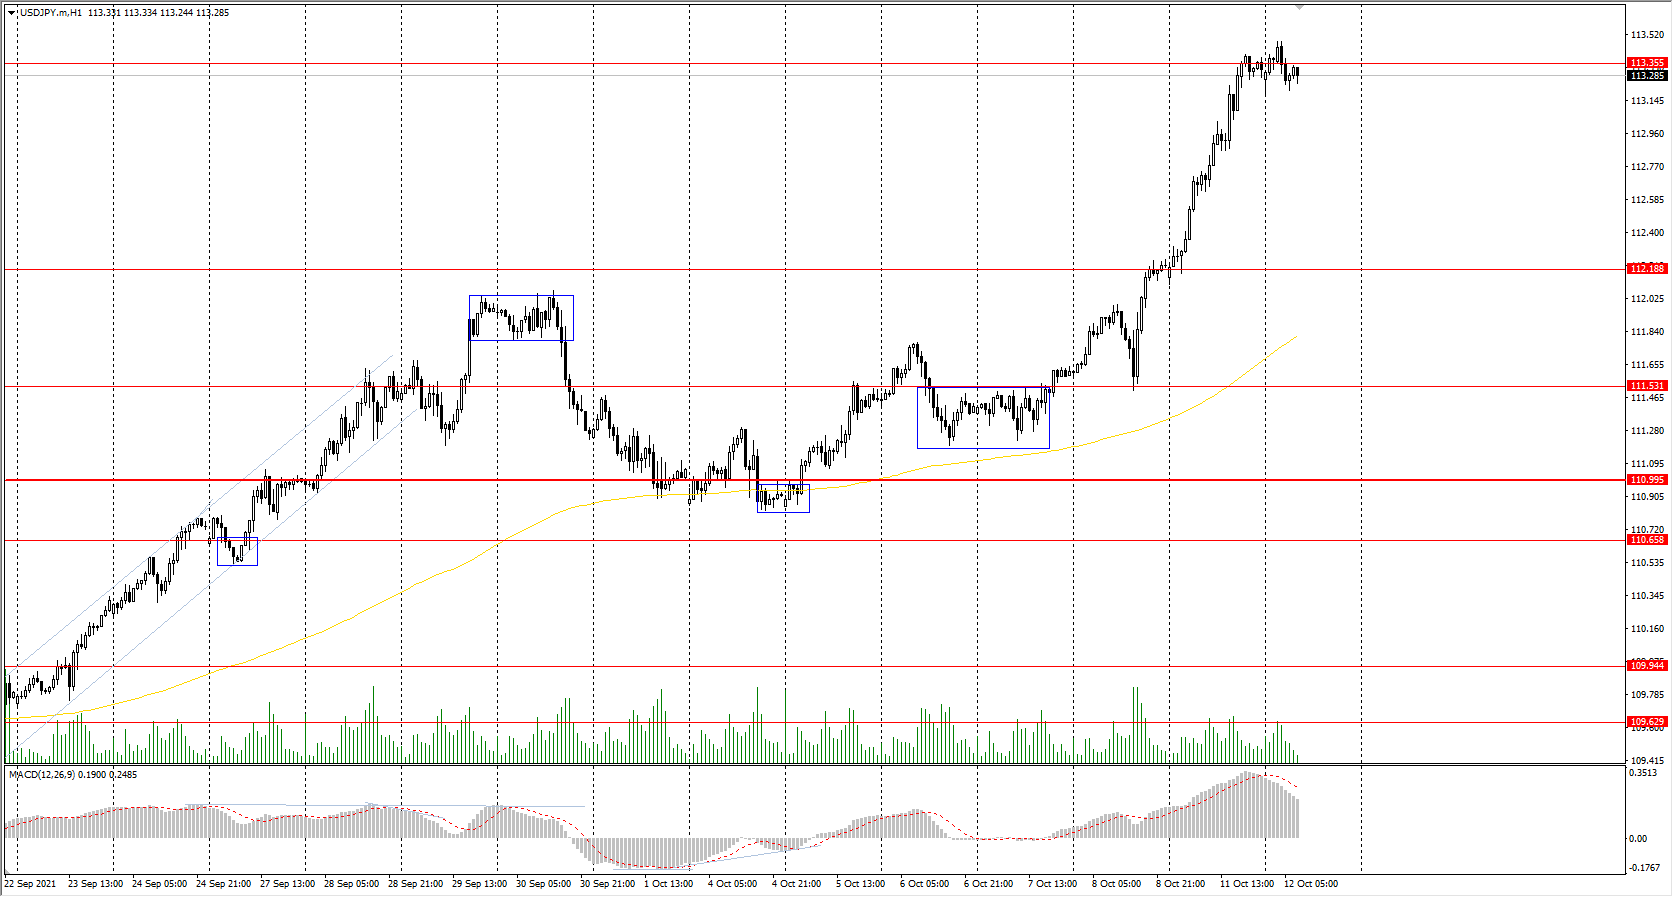
Support levels: 112.19, 111.53, 110.99, 110.65, 109.95, 109.63
Resistance levels: 113.35
The main trend of the USD/JPY currency pair is bullish. The Japanese yen is rapidly declining against the US dollar; the last time such a price was in 2019. The MACD indicator is positive. There are signs of overbuying, but no signs of reversal. Under such market conditions, it’s better to look for buy positions from the support levels near the moving average, since the price has deviated greatly from the average line. Sell positions should be considered only throughout the day from the resistance levels, given there is sellers’ initiative.
Alternative scenario: if the price falls below 110.99, the uptrend is likely to be broken.
News feed for 2021.10.12:
- UK Average Earnings Index (m/m) at 09:00 (GMT+3);
- UK Claimant Count Change (m/m) at 09:00 (GMT+3);
- UK Unemployment Rate (m/m) at 09:00 (GMT+3).
The USD/JPY currency pair
Technical indicators of the currency pair:
Prev Open: 112.14
Prev Close: 113.32
% chg. over the last day: +1.05%
The producer price index, which reflects the inflation rate for corporate goods or business-to-business inflation, reached 6.3% (previous value 5.8%), the highest level since August 2008.
Trading recommendations
Support levels: 112.19, 111.53, 110.99, 110.65, 109.95, 109.63
Resistance levels: 113.35
The main trend of the USD/JPY currency pair is bullish. The Japanese yen is rapidly declining against the US dollar; the last time such a price was in 2019. The MACD indicator is positive. There are signs of overbuying, but no signs of reversal. Under such market conditions, it’s better to look for buy positions from the support levels near the moving average, since the price has deviated greatly from the average line. Sell positions should be considered only throughout the day from the resistance levels, given there is sellers’ initiative.
Alternative scenario: if the price falls below 110.99, the uptrend is likely to be broken.