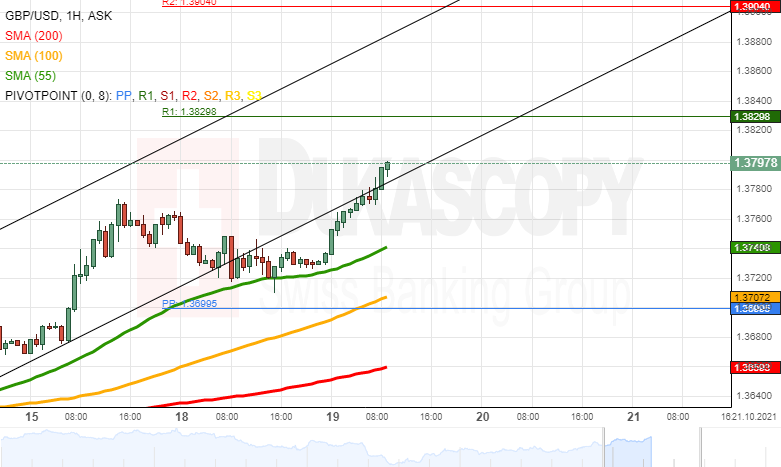
The GBP/USD passed the support of the channel up pattern. However, as the rate approached the 55-hour simple moving average and the 1.3710 level, a recovery began. By the start of Tuesday’s European trading hours, the pair had almost reached the 1.3800 mark.
If the rate finds resistance at the 1.3800 mark, it could either trade sideways below it or decline. A potential decline might look for support in the 55-hour simple moving average. Below the 55-hour SMA, the pair might find support in the 100-hour SMA near 1.3700 and the weekly simple pivot point exactly at 1.3700.
A move above the 1.3800 level could aim at the resistance of the weekly R1 simple pivot point at 1.3830. Above the pivot point, resistance would be found at the 1.3900 mark, which is strengthened by the weekly R2 simple pivot point.