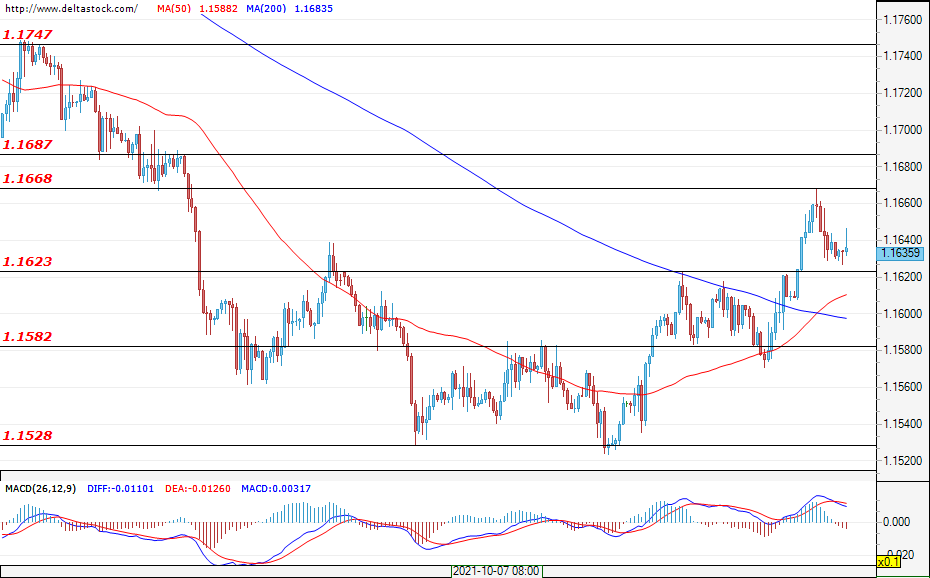
EUR/USD
Current level – 1.1638
After the successful breach of the resistance at around 1.1623, there is a reversal of the trend in the currency pair. The sentiment remains positive – for continued growth and an attack of the resistance zone between 1.1668 and 1.1687. If this zone is successfully breached, the next target for the bulls would likely be the area at around 1.1750. The first daily support for the bulls is 1.1623, followed by the key level of 1.1582. Today, an increase in activity can be expected around the announcement of the consumer price index data for the euro area at 09:00 GMT.
| Resistance | Support | ||
| intraday | intraweek | intraday | intraweek |
| 1.1640 | 1.1750 | 1.1582 | 1.1410 |
| 1.1687 | 1.1800 | 1.1528 | 1.1280 |
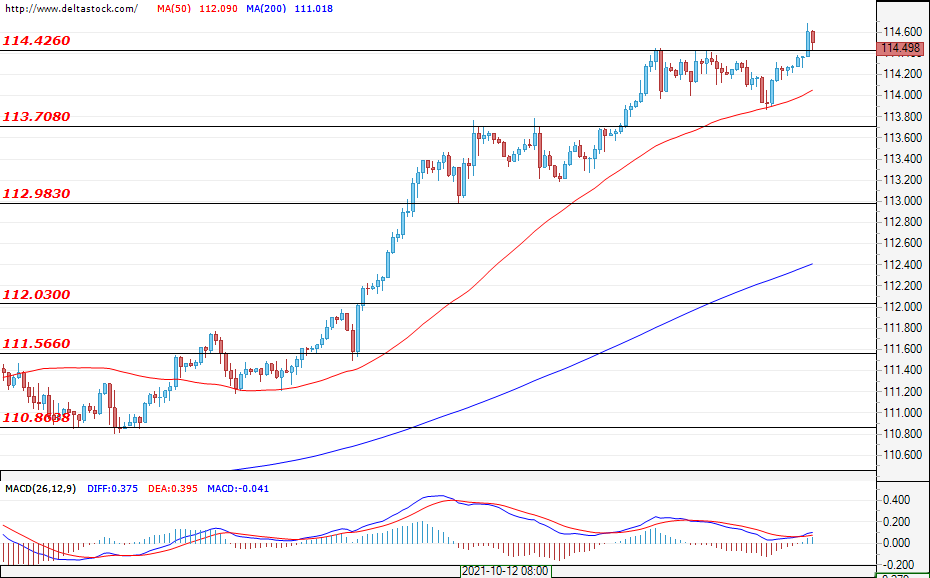
USD/JPY
Current level – 114.49
The uptrend here is strong and any corrective movements are being reduced to consolidations in the price movement. The pair managed to breach the resistance of 114.42 and it seems that the bulls are preparing for their next assault, with their goal possibly being 115.50. As long as the momentum of the trend is maintained, prices may even reach 118.60. The first support for the buyers is 114.42, followed by the already confirmed one at 113.70.
| Resistance | Support | ||
| intraday | intraweek | intraday | intraweek |
| 114.34 | 117.90 | 113.64 | 112.00 |
| 115.60 | 118.50 | 113.00 | 111.56 |
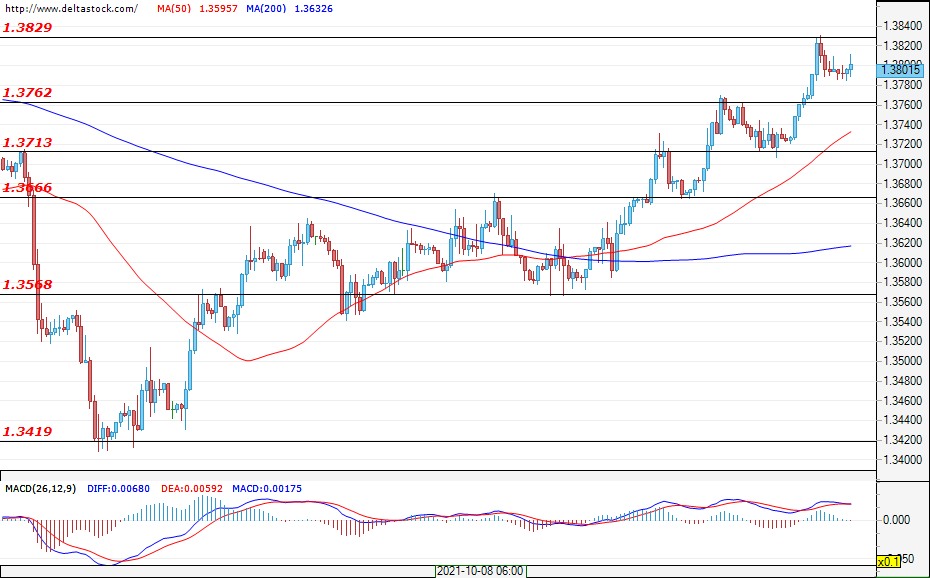
GBP/USD
Current level – 1.3801
The sterling managed to reach the resistance of 1.3830. However, the strength of the bulls was not enough for a breach and the market entered a pullback phase. It is possible that a test of the support of 1.3762 will follow, but in the early hours of today, the pair holds steady above 1.3800. The 1.3830 level comes from the higher time frames, so the market may need more time to break through. If the zone is conquered, an attack of the next resistance at around 1.3890 can be expected. The key support for the current trend is 1.3720.
| Resistance | Support | ||
| intraday | intraweek | intraday | intraweek |
| 1.3762 | 1.3830 | 1.3713 | 1.3570 |
| 1.3830 | 1.3900 | 1.3666 | 1.3420 |