The EUR/USD currency pair
Technical indicators of the currency pair:
Prev Open: 1.1631
Prev Close: 1.1651
% chg. over the last day: +0.17%
The ECB’s balance continues to grow despite the rising inflationary pressures. The total assets increased by another €22.4 billion, reaching a new level of €8,336.7 billion. The ECB continues to fill the economy with “cheap” money.
Trading recommendations
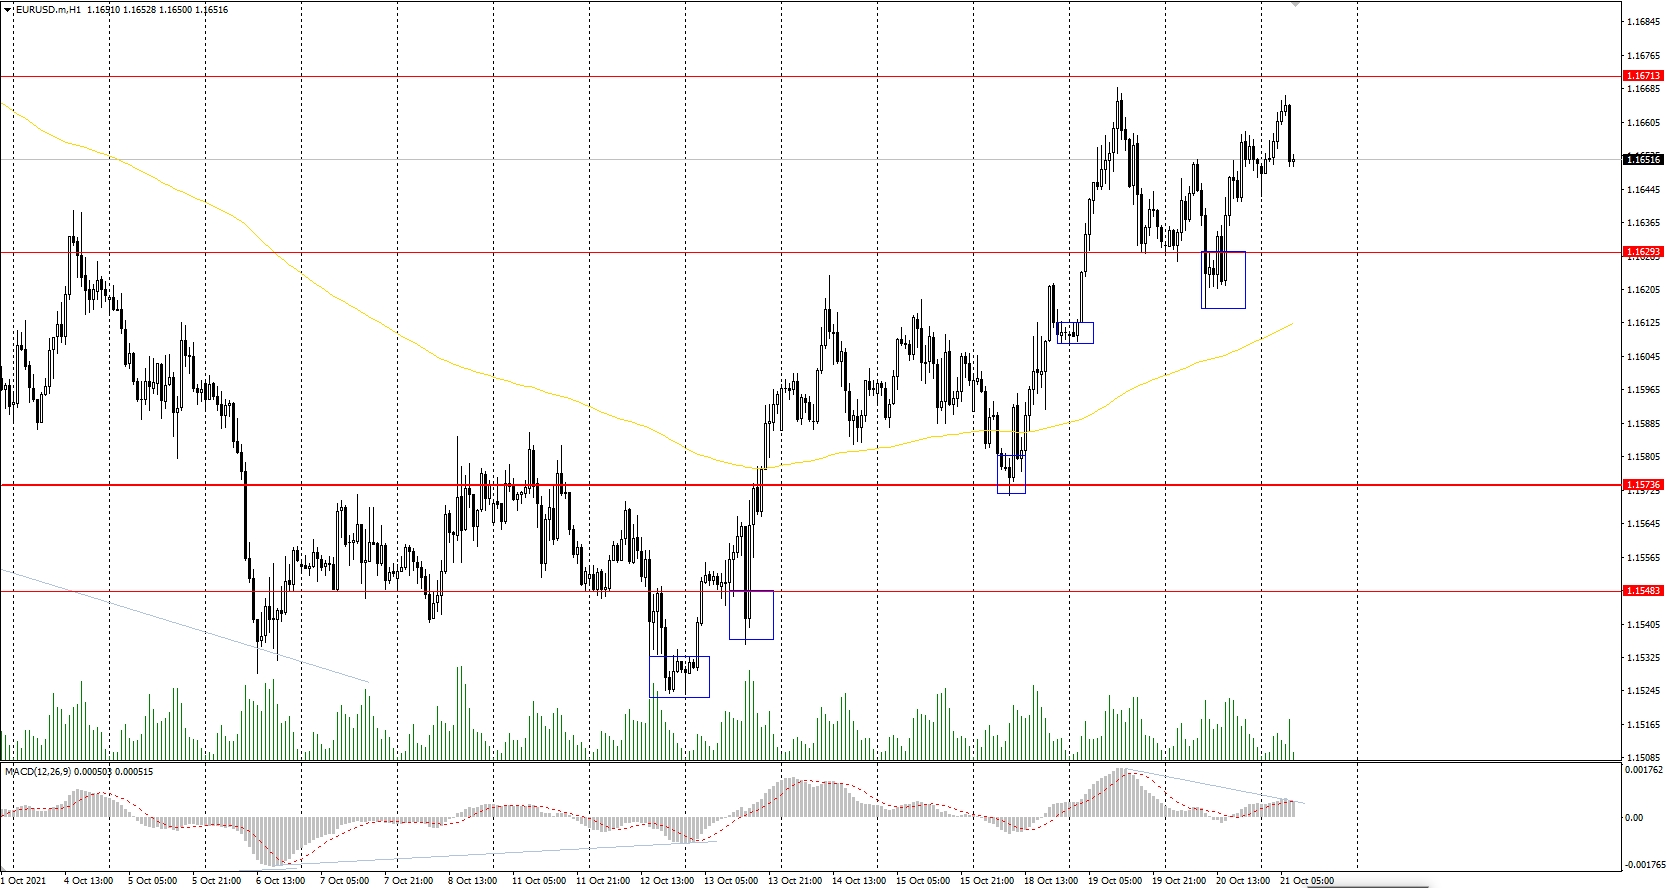
Support levels: 1.1629, 1.1548, 1.1502, 1.1453
Resistance levels: 1.1671, 1.1717, 1.1772, 1.1802, 1.1835
From the technical point of view, the EUR/USD on the hour timeframe is bullish. The MACD indicator is in the positive zone, but there are signs of buyer’s weakness. Under such market conditions, traders should consider buying positions from the support levels near the moving average or from the buyer’s initiative areas. It is best to look for sell trades from the resistance levels of the higher timeframe.
Alternative scenario: if the price breaks down through the 1.1548 support level and fixes below, the mid-term uptrend will likely be broken.
News feed for 2021.10.21:
- US Philadelphia Fed Manufacturing Index (m/m) at 15:30 (GMT+3);
- US Initial Jobless Claims (w/w) at 15:30 (GMT+3).
The GBP/USD currency pair
Technical indicators of the currency pair:
Prev Open: 1.3789
Prev Close: 1.3823
% chg. over the last day: +0.25%
The UK Consumer Price Index was 3.1% (previous 3.2%), indicating that inflation in the United Kingdom is slowing. Core inflation, which excludes food and energy prices, also declined from 3.1% to 2.9%. The UK Secretary of State for Business, Kwasi Kwarteng, is confident that the government will contain inflation.
Trading recommendations
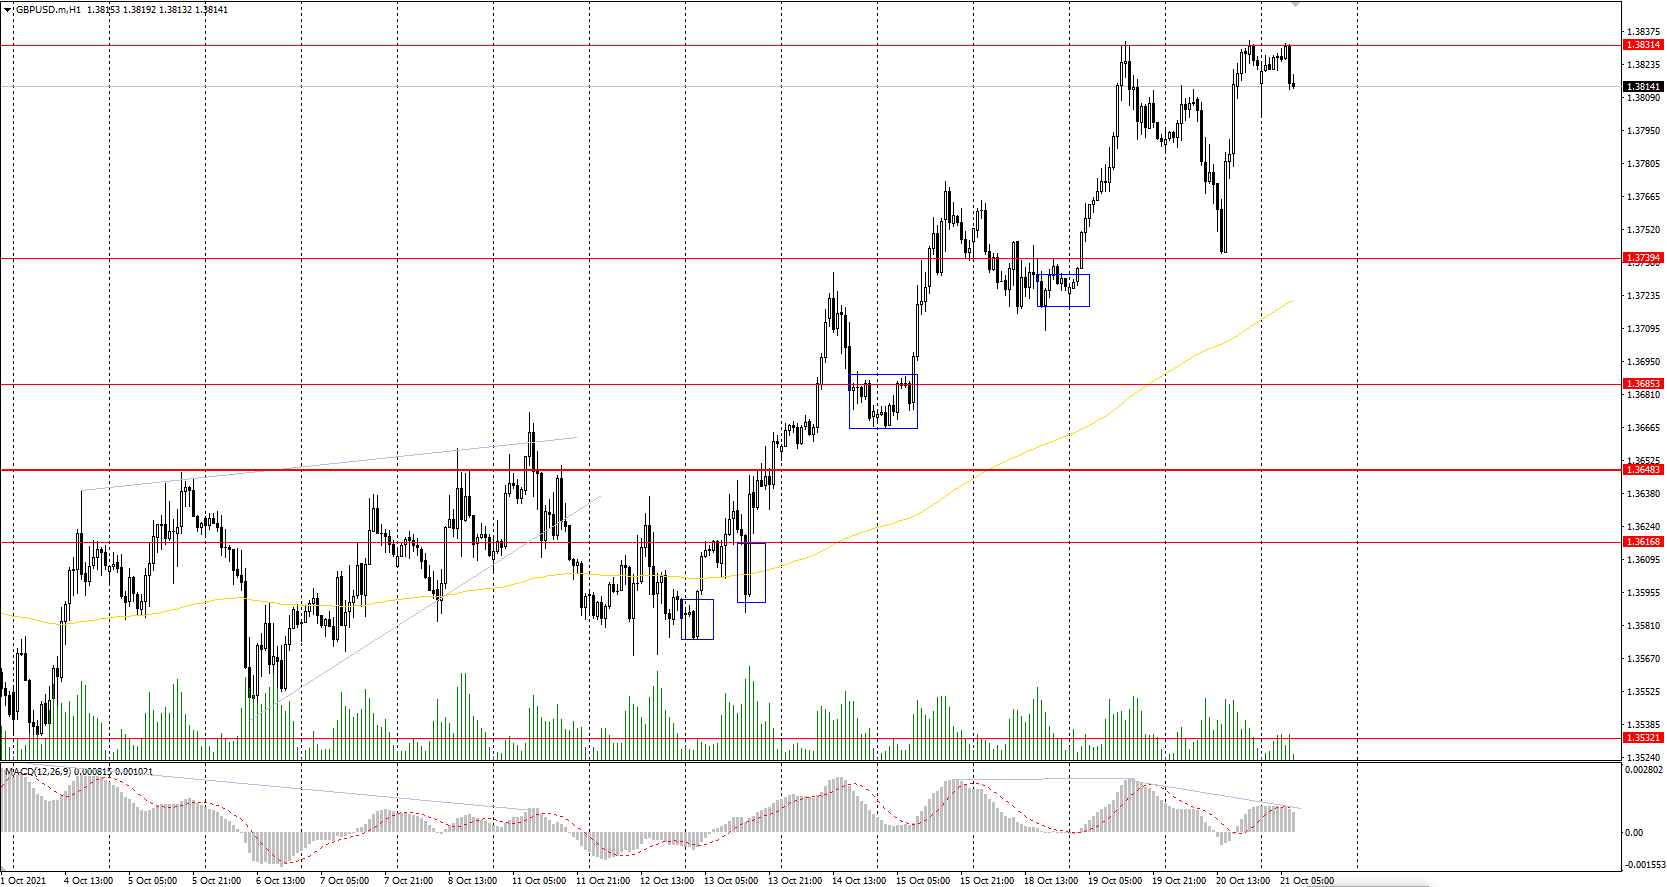
Support levels: 1.3739, 1.3685, 1.3648, 1.3617, 1.3532, 1.3457, 1.3360, 1.3282
Resistance levels: 1.3831, 1.3886
On the hourly time frame, the GBP/USD trend is bullish. The British pound is strengthening due to its direct correlation with oil prices and the weakness of the dollar index. The MACD indicator is in the positive zone, but there are the first signs of buyers’ weakness. Buy trades should be considered only within the day and only from the initiative zone of the buyers. It is better to look for sell deals from the resistance levels of the higher timeframe, but after an additional confirmation in the form of a sellers’ initiative because the buyers’ pressure is higher now.
Alternative scenario: if the price breaks down through the 1.3648 support level and consolidates below, the bullish scenario is likely to be broken.
The USD/JPY currency pair
Technical indicators of the currency pair:
Prev Open: 114.32
Prev Close: 114.32
% chg. over the last day: 0.00%
Concerns about high energy prices are growing in Japan as it leads to lower corporate profits. The Japanese yen is still trading at highs against the US dollar, and this trend might intensify further.
Trading recommendations
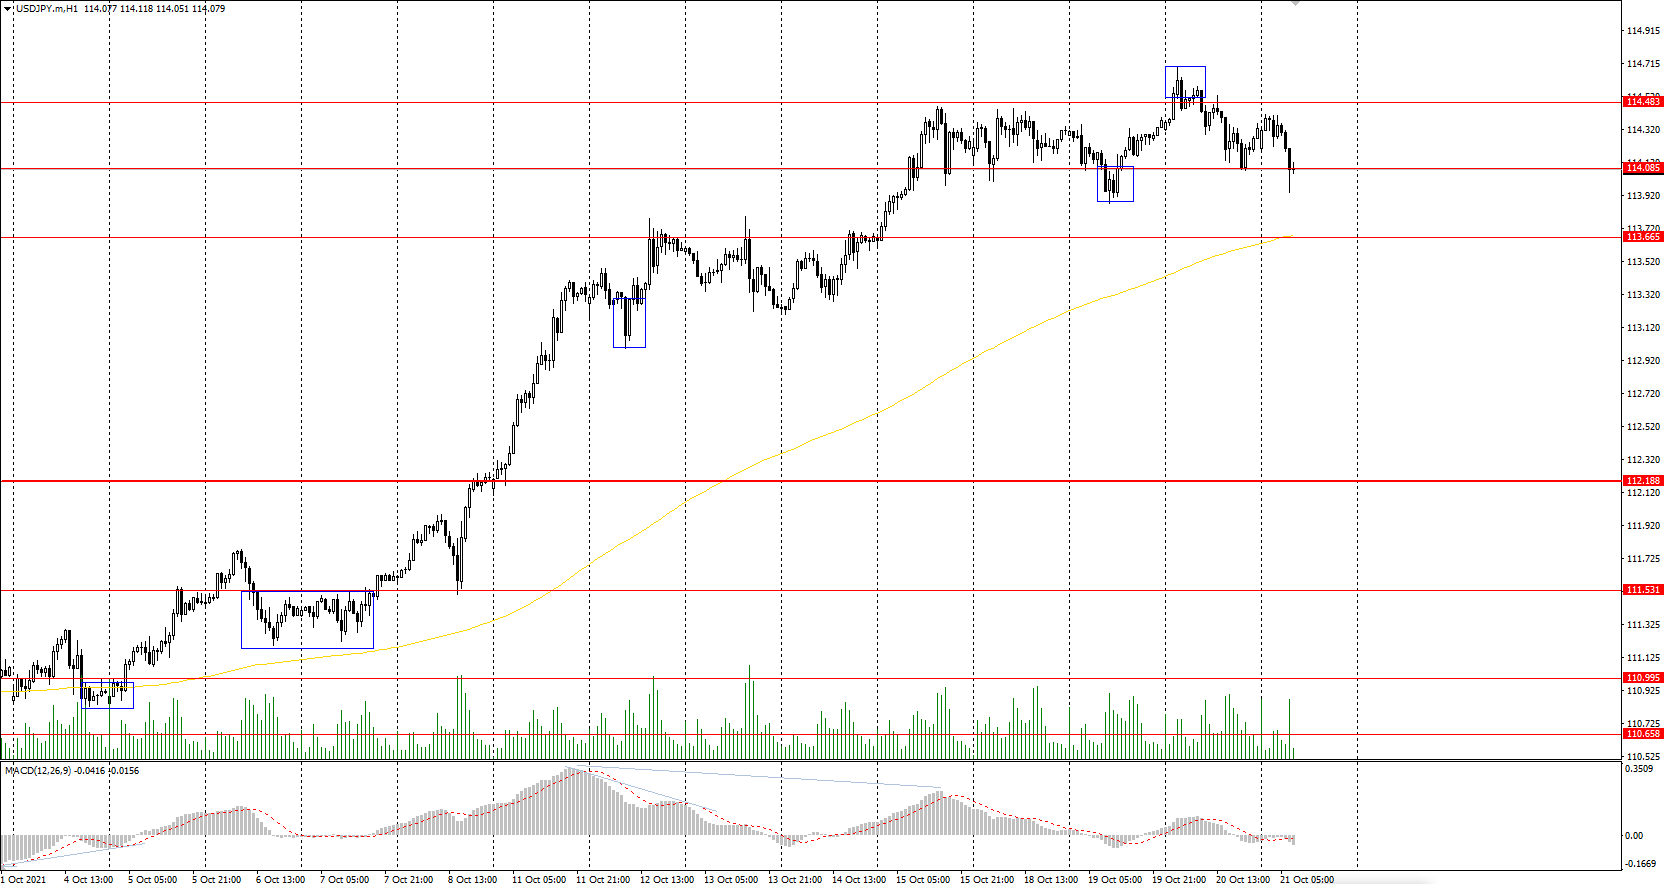
Support levels: 114.08, 113.66, 112.19, 111.53, 110.99, 110.65
Resistance levels: 114.48, 115.15
The main trend of the USD/JPY currency pair is bullish. At the moment, the price is trading flat and has formed false break zones on both sides. The MACD indicator has become inactive. However, there is still a divergence on higher time frames, which means that growth is limited, and correction is expected soon. Under such market conditions, it’s better to look for buy positions from the support levels near the moving average or the buyers’ initiative zones on the lower timeframes. Sell positions should be considered from the resistance levels of a higher timeframe, given there is sellers’ initiative.
Alternative scenario: if the price falls below 112.19, the uptrend is likely to be broken.
The USD/JPY currency pair
Technical indicators of the currency pair:
Prev Open: 114.32
Prev Close: 114.32
% chg. over the last day: 0.00%
Concerns about high energy prices are growing in Japan as it leads to lower corporate profits. The Japanese yen is still trading at highs against the US dollar, and this trend might intensify further.
Trading recommendations
Support levels: 114.08, 113.66, 112.19, 111.53, 110.99, 110.65
Resistance levels: 114.48, 115.15
The main trend of the USD/JPY currency pair is bullish. At the moment, the price is trading flat and has formed false break zones on both sides. The MACD indicator has become inactive. However, there is still a divergence on higher time frames, which means that growth is limited, and correction is expected soon. Under such market conditions, it’s better to look for buy positions from the support levels near the moving average or the buyers’ initiative zones on the lower timeframes. Sell positions should be considered from the resistance levels of a higher timeframe, given there is sellers’ initiative.
Alternative scenario: if the price falls below 112.19, the uptrend is likely to be broken.