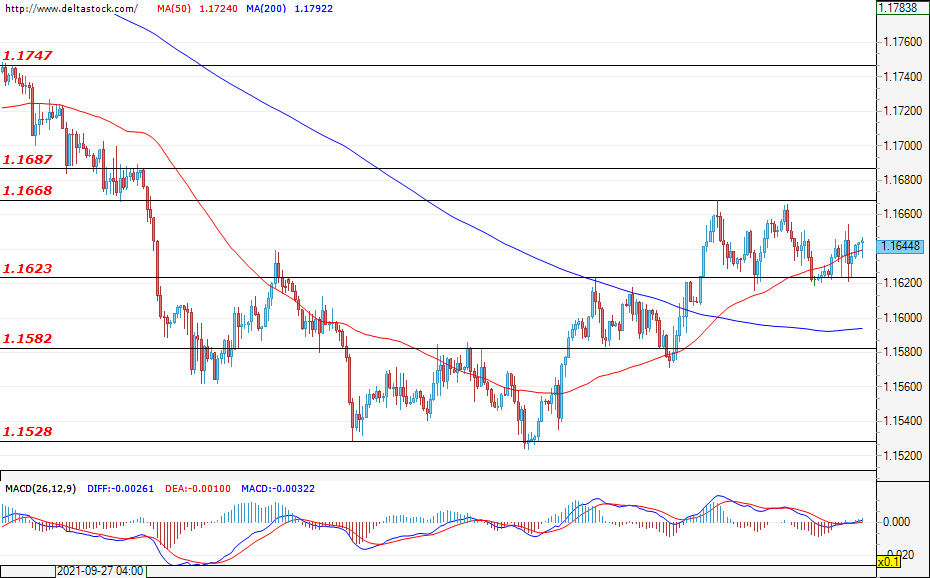
EUR/USD
Current level – 1.1644
During most of last week, the currency pair was trading in the relatively narrow range between 1.1623 and 1.1668, and neither the bulls, nor the bears were able to take control and get the pair out of this channel. However, a breach of the resistance of 1.1668 would confirm that the corrective phase is continuing and the bulls would probably attack the next resistance of 1.1747. In the negative direction, a violation of 1.1623 would bring back the negative sentiment, leading the pair towards the support zone of 1.1582. This week, investors will focus on the European Central Bank rate decision (Thursday; 11:45 GMT) and on the U.S. initial jobless claims data (Thursday; 12:30 GMT).
| Resistance | Support | ||
| intraday | intraweek | intraday | intraweek |
| 1.1668 | 1.1750 | 1.1623 | 1.1410 |
| 1.1687 | 1.1800 | 1.1582 | 1.1280 |
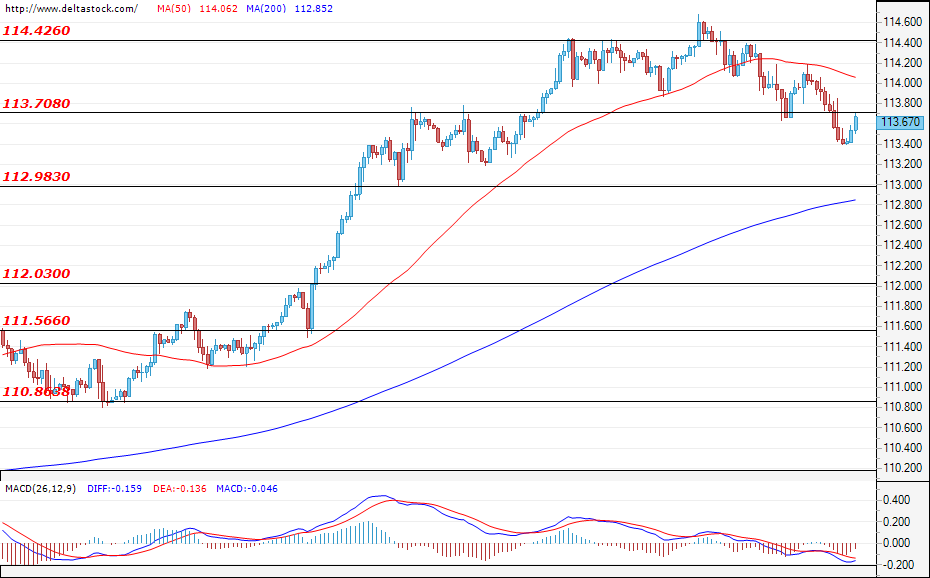
USD/JPY
Current level – 113.67
Following a couple of unsuccessful attempts to violate the key resistance level of 114.42, the Ninja entered a corrective phase, which should remain limited above the support level of 112.98 and where investors should also be able to find better levels for market entry. In case the bulls return to the market, the expectations are for the pair to re-test the resistance of 114.42 and rise towards the resistance zone of 115.50 that is coming from the higher time frames. Increased volatility is expected around the announcement of the Bank of Japan’s interest rate decision (Thursday; 03:00 GMT).
| Resistance | Support | ||
| intraday | intraweek | intraday | intraweek |
| 113.70 | 117.90 | 113.00 | 112.00 |
| 114.42 | 118.60 | 112.00 | 111.56 |
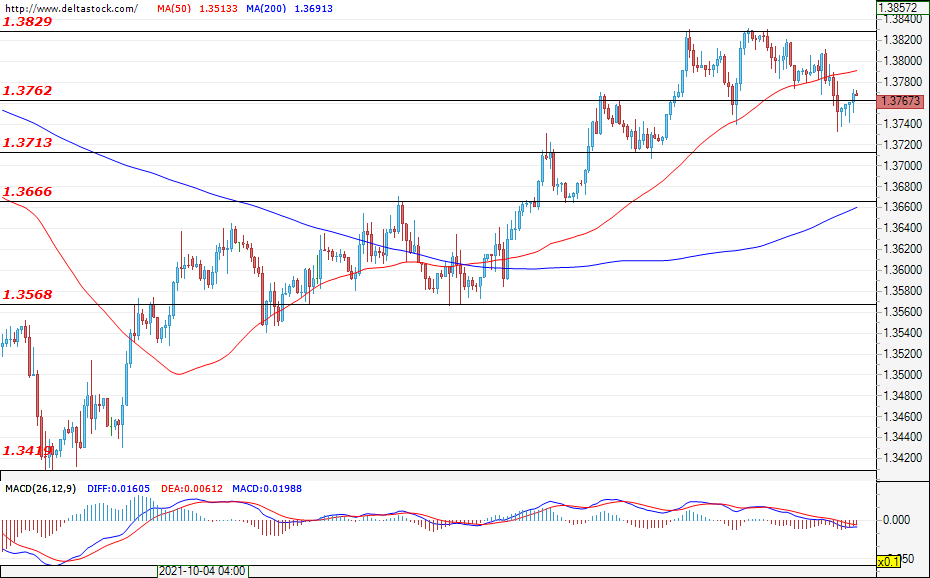
GBP/USD
Current level – 1.3767
During last week, the Cable was trading in the range between 1.3762 and 1.3829, and neither the bulls, nor the bears were able to take control and get the pair out of this channel. However, the expectations are for the pair to re-test and violate the upper border and a key resistance level of 1.3829, which would take the pair towards the 1.3900-1.4000 zone.
| Resistance | Support | ||
| intraday | intraweek | intraday | intraweek |
| 1.3830 | 1.3900 | 1.3762 | 1.3666 |
| 1.3900 | 1.4000 | 1.3713 | 1.3570 |