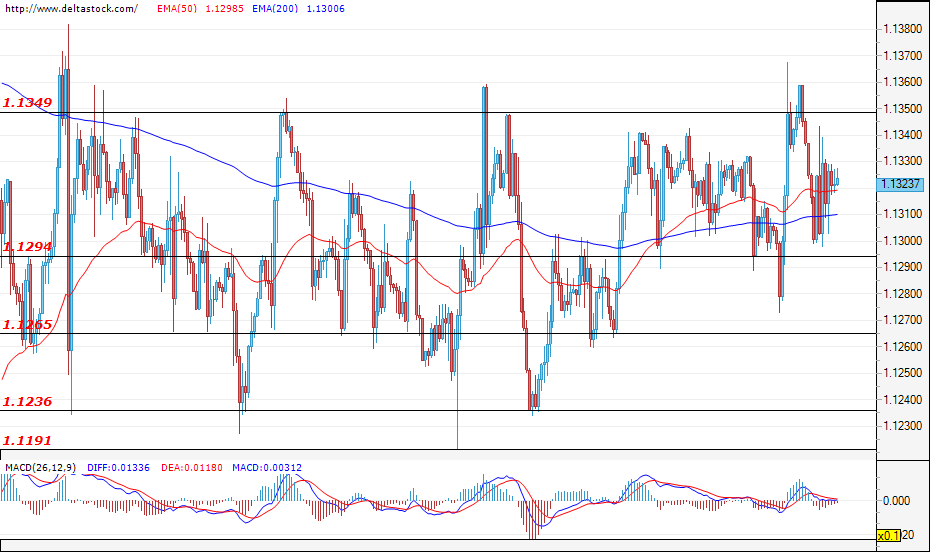
EUR/USD
Current level – 1.1323
In the last couple of days, the currency pair has been trading in the range of 1.1294 – 1.1349 and neither the bulls nor the bears have so far managed to take control. A confirmed breach of either of the borders of the range would set the future direction for the EUR/USD. At the time of writing the analysis, the most likely scenario is for the pair to test the resistance level of 1.1349 and head towards the next resistance zone at 1.1460. An unsuccessful breach of the mentioned level would most likely lead to a price reduction towards the support zone at 1.1294. This, in turn, could strengthen the bearish mood and pave the way for the currency pair towards the next zone from the higher time frames at 1.1236.
| Resistance | Support | ||
| intraday | intraweek | intraday | intraweek |
| 1.1350 | 1.1460 | 1.1294 | 1.1235 |
| 1.1460 | 1.1500 | 1.1265 | 1.1190 |
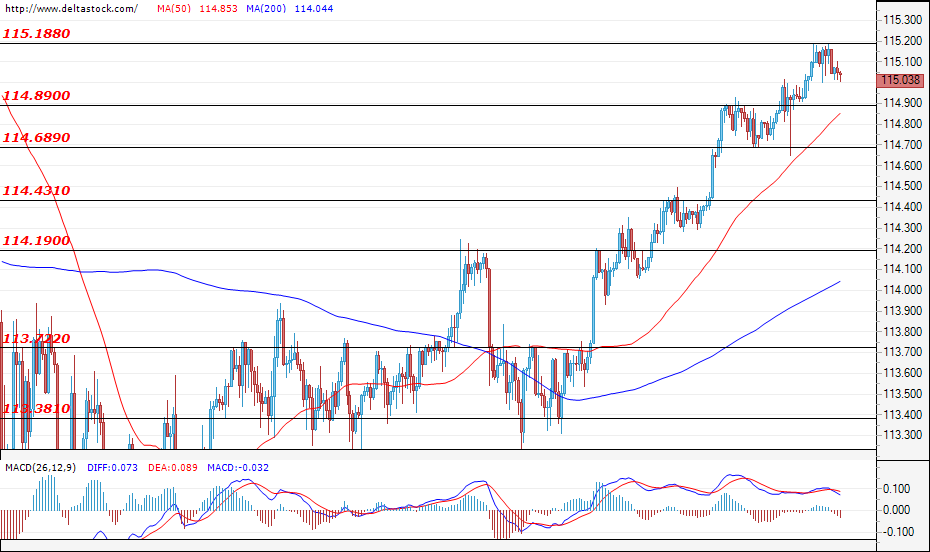
USD/JPY
Current level – 115.03
The pair failed to violate the resistance at 115.18 and, in the early hours of today, activity is rather low. However, the positive sentiment for an appreciation of the U.S. dollar against the yen still remains. If the bulls manage to overcome the resistance zone at 115.18, then this would probably lead to an appreciation of the U.S. dollar and the next target for the bulls would be the resistance at 115.44. In the opposite direction, if the mentioned resistance crumbles to the bullish pressure, then the pair may head towards a test of the support at 114.89.
| Resistance | Support | ||
| intraday | intraweek | intraday | intraweek |
| 115.20 | 115.44 | 114.89 | 114.43 |
| 115.44 | 116.00 | 114.68 | 114.20 |
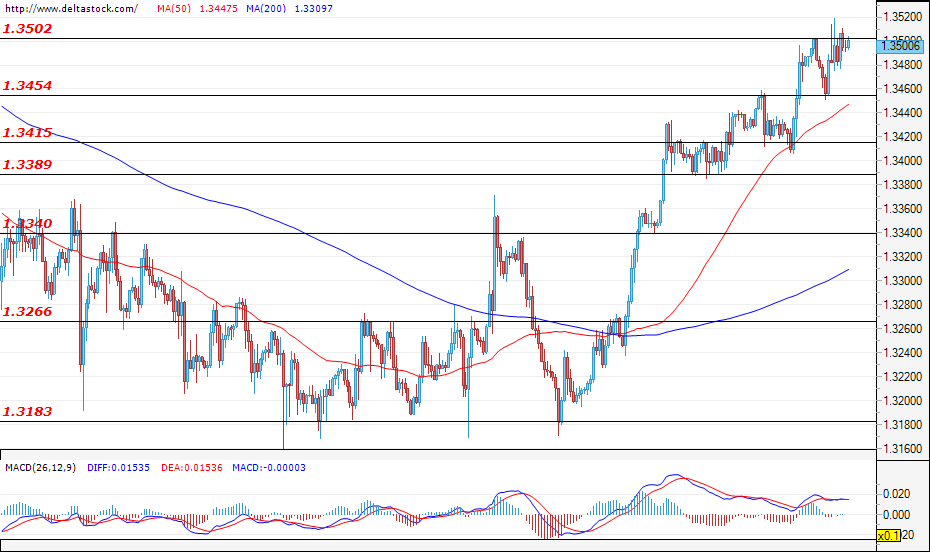
GBP/USD
Current level – 1.3500
Yesterday’s test of the resistance zone at 1.3500 was unsuccessful and, at the time of writing, the sterling is trying to violate this level. If it is successfully breached, then this would head the pair towards a test of the next resistance at 1.3580. If the pair stays below the mentioned level, then the most likely scenario would be for the Cable to head towards the support at 1.3454.
| Resistance | Support | ||
| intraday | intraweek | intraday | intraweek |
| 1.3500 | 1.3580 | 1.3454 | 1.3389 |
| 1.3580 | 1.3603 | 1.3415 | 1.3340 |