
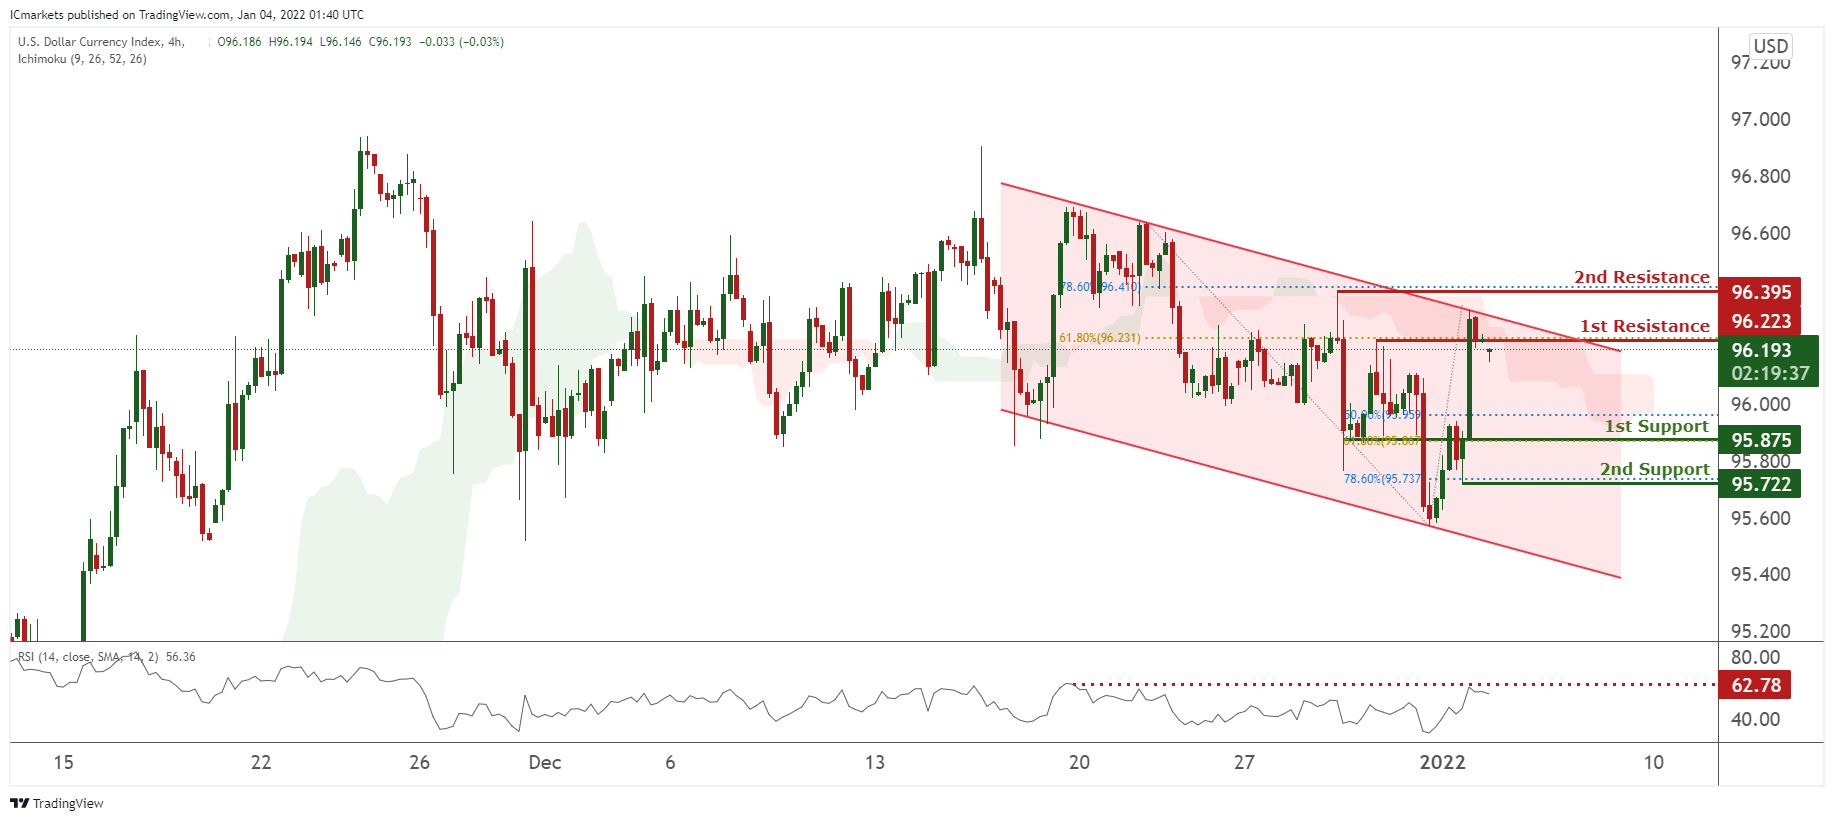
DXY:
On the H4, prices are on bearish momentum and consolidating in a bearish channel. We see the potential for a dip from our 1st resistance at 96.223 in line with 96.223 in line with 61.8% Fibonacci retracement towards our 1st support in line 95.875 with 61.8% Fibonacci retracement. RSI are at levels where dips previously occurred, further supporting our bearish bias.
Areas of consideration:
- H4 time frame, 1st resistance at 96.223
- H4 time frame, 1st support at 95.875
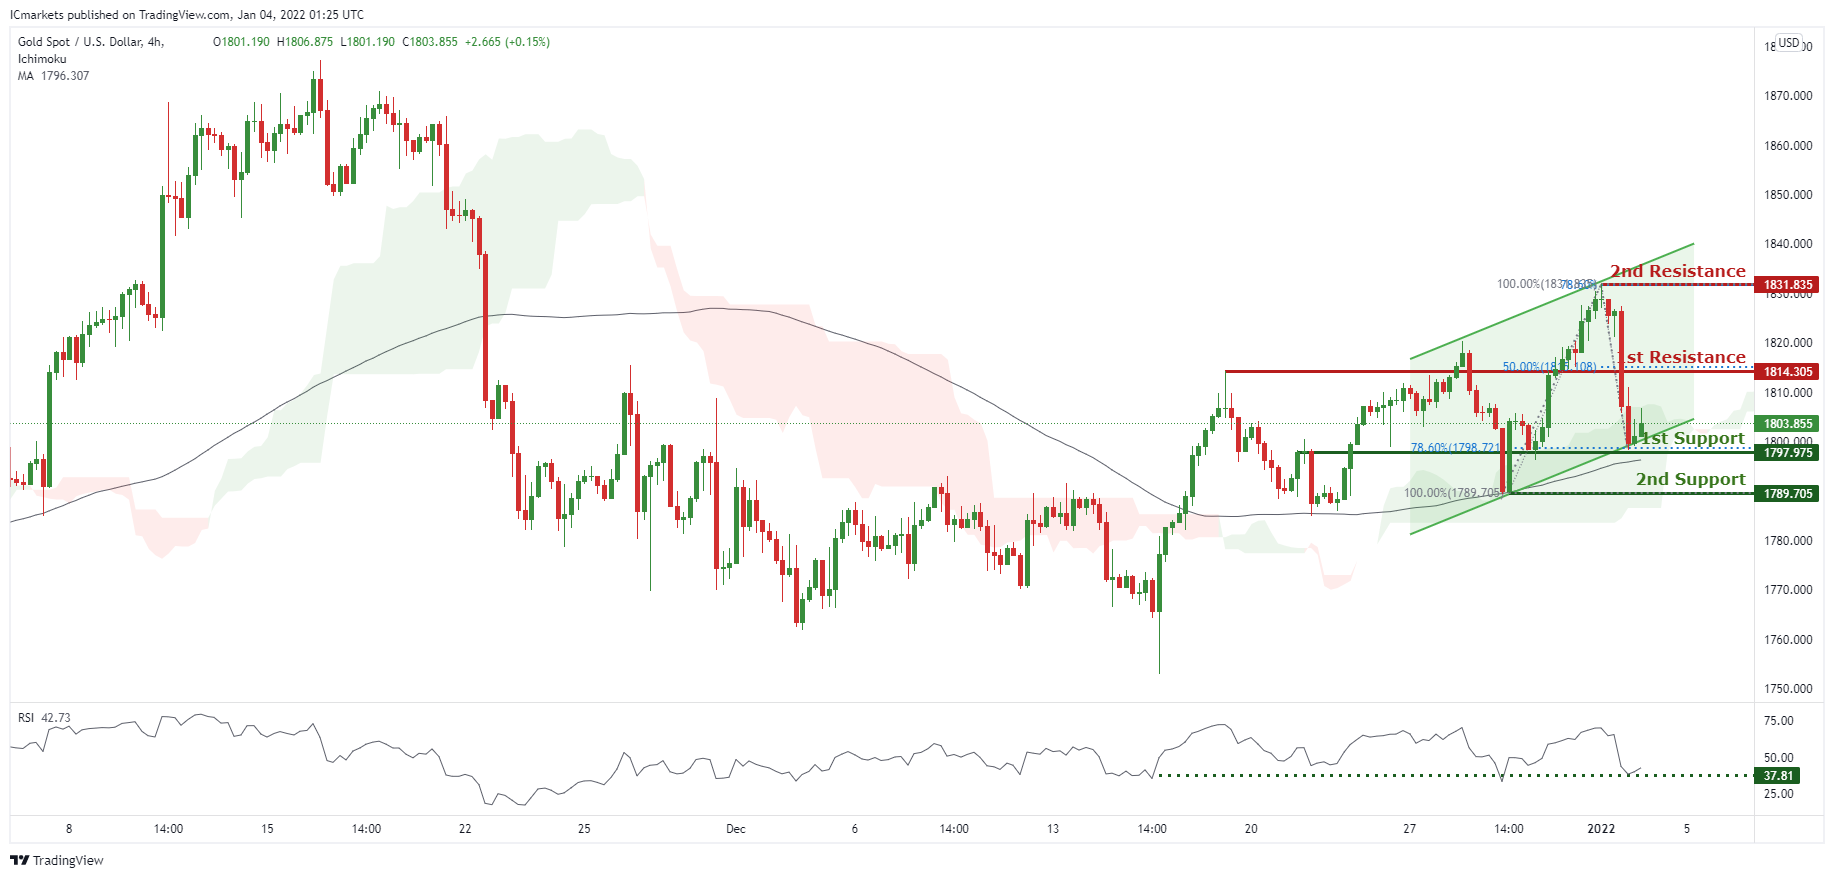
XAU/USD (GOLD):
On the H4, prices are consolidating in a parallel channel and on bullish momentum. We see the potential for a bounce from our 1st support at 1797.975 in line with 78.6% Fibonacci retracement towards our 1st resistance at 1814.305 in line with 50% Fibonacci retracement. RSI are at levels where bounces previously occurred. Alternatively, breaking our 1st resistance could find prices could climb higher towards our 2nd resistance at 1831.835 in line with 100% Fibonacci retracement and 78.6% Fibonacci extension.
Areas of consideration:
- H4 1st support at 1797.975
- H4 1st resistance at 1814.305
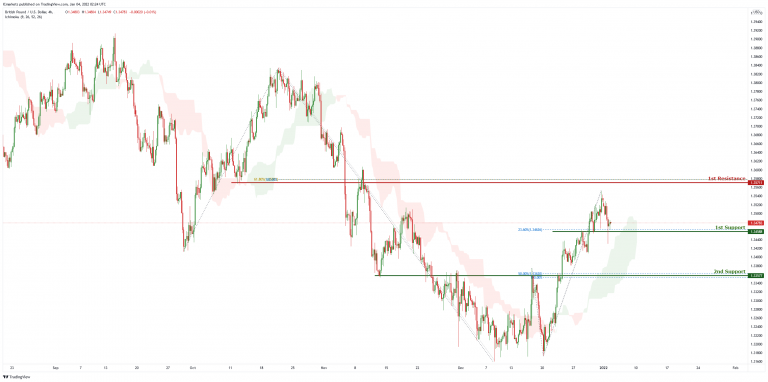
GBP/USD
On the H4 chart price is near 1st support level of 1.34588 which is also 23.6% Fibonacci retracement. Price can potentially go to the 1st resistance level of 1.35711 which is also 61.8% Fibonacci retracement and 100% Fibonacci projection. Our bullish bias is supported by the ichimoku cloud indicator as price is trading above it.
Areas of consideration:
- H4 1st support level at 1.34588
- H4 1st resistance level at 1.35711
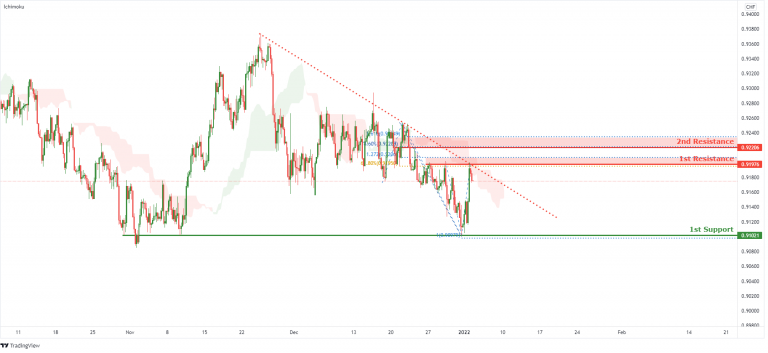
USD/CHF:
On the H4 timeframe, price is abiding to the descending trendline resistance, signifying an overall bearish momentum. We can expect price to drop from the 1st Resistance level in line with 61.8% Fibonacci retracement and 127.2% Fibonacci projection towards 1st Support in line with 100% Fibonacci projection. Our bearish bias is further supported by the price holding below the Ichimoku Cloud.
Areas of consideration:
- Watch 1st Support at 0.91021
- Watch 1st Resistance at 0.91976
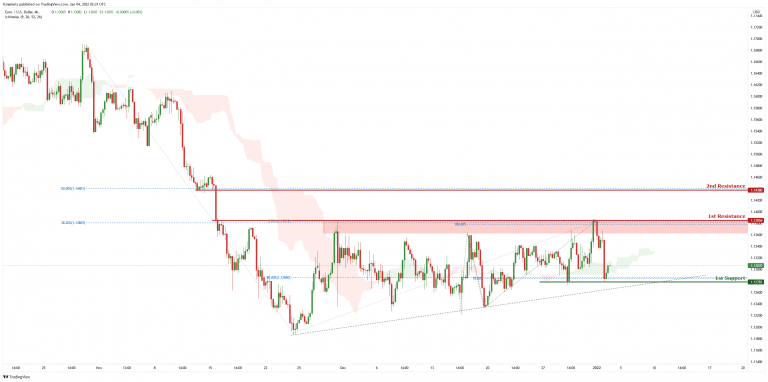
EUR/USD :
On the H4 chart, price is abiding by an ascending trendline and is near 1st support level of 1.12783 which is also 50% Fibonacci retracement and 78.6% Fibonacci projection. Price can potentially go to the 1st resistance of 1.13854 which is also 100% Fibonacci projection and 38.2% Fibonacci retracement. Our bullish bias is supported by the ichimoku cloud indicator.
Areas of consideration :
- H4 1st support at 1.12783
- H4 1st resistance at 1.13854
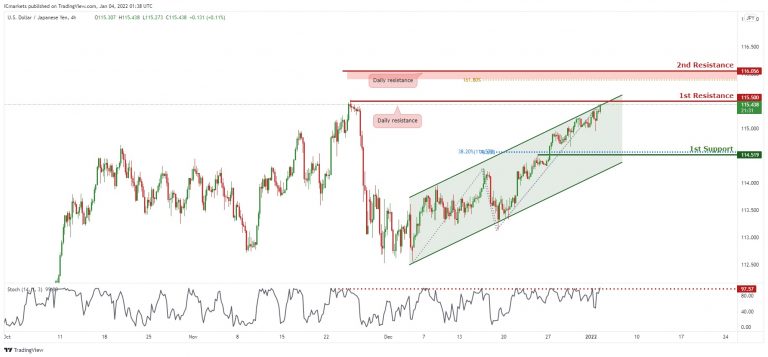
USD/JPY
On the H4 timeframe, price is abiding to the ascending channel, showing an overall bullish momentum. However, we can expect a short term bearish momentum and drop from 1st resistance in line with previous swing high and daily resistance towards 1st Support in line with graphical overlap support, 78.6% Fibonacci projection and 38.2% Fibonacci retracement. Our bearish bias is further supported by stochastic where the %K line dropped from the resistance.
Areas of consideration:
- H4 1st resistance level 115.500
- H4 1st support level 114.519
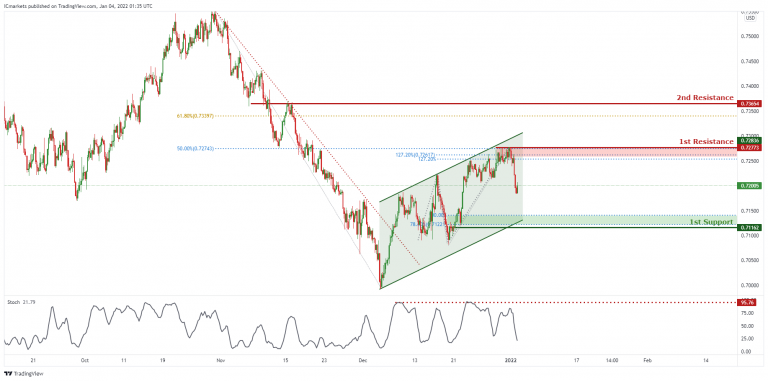
AUD/USD:
In reference to yesterday’s analysis, price is falling nicely towards 1st Support. On the H4, price is reacting in an ascending channel, signifying bullish momentum. However, price is currently at a resistance, we can expect price to drop from 1st Resistance in line with 127.2% Fibonacci projection ,127.2% Fibonacci Extension and 50% Fibonacci retracement towards 1st Support in line with 100% Fibonacci projection and 78.6% Fibonacci retracement. Our short-term bearish bias is further supported by the stochastic indicator where the %K line is approaching the resistance level. Traders should wait for price to swing higher or lower before entering.
Areas of consideration:
- H4 1st Support level 0.71203
- H4 1st resistance level 0.72773
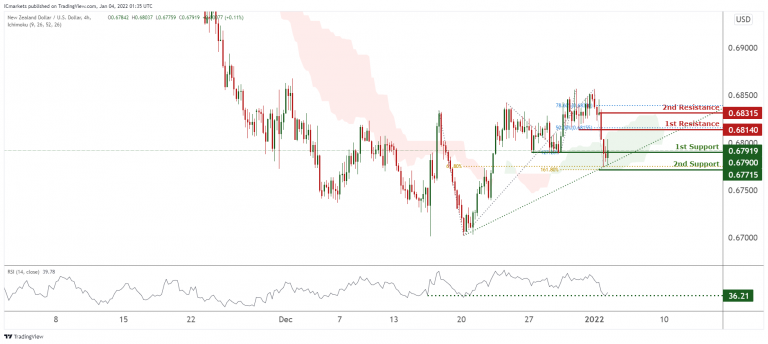
NZD/USD:
On the H4, prices are on bullish momentum and abiding to our ascending trendline. We see the potential for further bullish movement towards our 1st resistance at 0.68140 in line with 127.2% Fibonacci extension and 50% Fibonacci retracement. Technical indicators are showing momentum. Alternatively, breaking our 1st support may find prices dipping towards our 2nd support at 0.67715.
Areas of consideration:
- H4 time frame, 1st resistance at 0.68140
- H4 time frame, 1st support at 0.67919
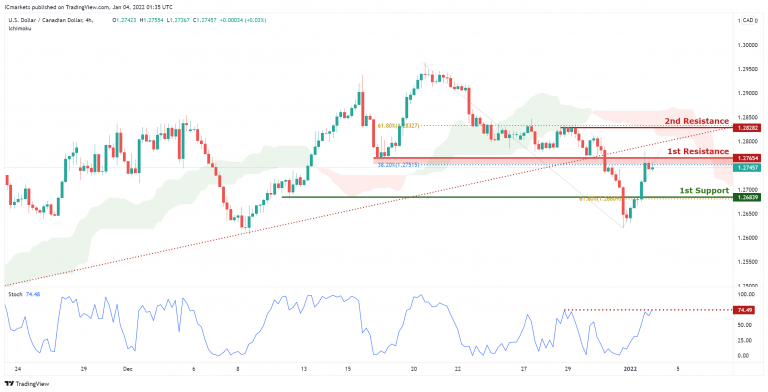
USD/CAD:
On the H4, with price at the resistance of the ichimoku indicator and horizontal swing high resistance, we have a bearish bias that price will drop from our 1st resistance at 1.27654 which is in line with horizontal overlap resistance, 38.2% Fibonacci retracement level to 1st support at 1.26839, which is in line with horizontal overlap support and 61.8% Fibonacci retracement. Alternatively, price may rise up to our 2nd resistance at 1.28282, which coincides with horizontal swing high resistance, 61.8% Fibonacci retracement level .
Areas of consideration:
- H4 time frame, 1st support at 26839
- H4 time frame, 1st resistance at 27654
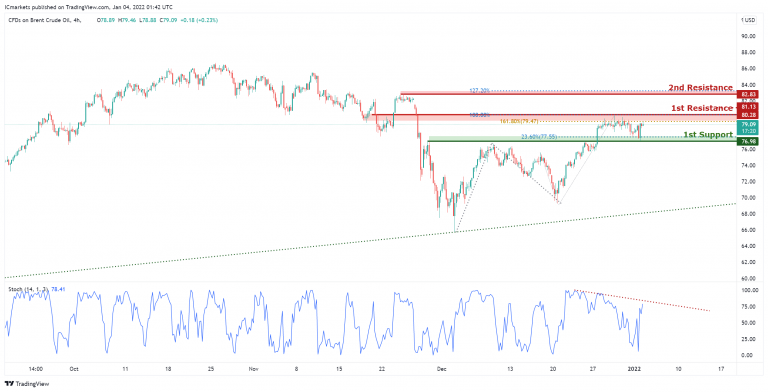
OIL:
On the H4, with price on a downwards trend on the stochastics indicator and approaching the resistance on the indicator, we have a bearish bias that price will drop from our 1st resistance at 80.28 which is in line with horizontal overlap resistance, 161.8% Fibonacci extension and 100% Fibonacci projection level to 1st support at 76.98, which is in line with horizontal overlap support, 23.6% Fibonacci retracement level. Alternatively, price may rise up to our 2nd resistance at 82.83, which coincides with horizontal swing high resistance and 127.2% Fibonacci extension level .
Areas of consideration:
- H4 time frame, 1st resistance of 80.28
- H4 time frame, 1st support of 76.98
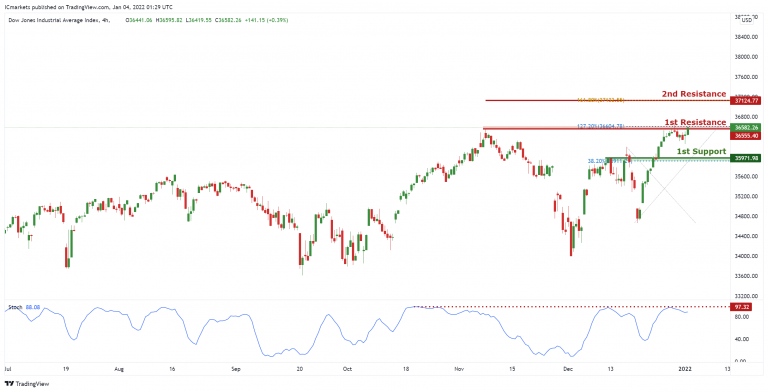
Dow Jones Industrial Average:
On the H4, with price rejecting the resistance on the stochastics indicator, we have a bearish bias that price will drop from our 1st resistance at 36555 area which is in line with horizontal swing high resistance and 127.2% Fibonacci extension level to 1st support at 35971, which is in line with horizontal overlap support, 38.2% Fibonacci retracement level. Alternatively, price may rise up to our 2nd resistance at 37124, which coincides with horizontal swing high resistance and 161.8% Fibonacci extension .
Area of consideration:
- 4H resistance at 36555
- 4H support at 35971


