
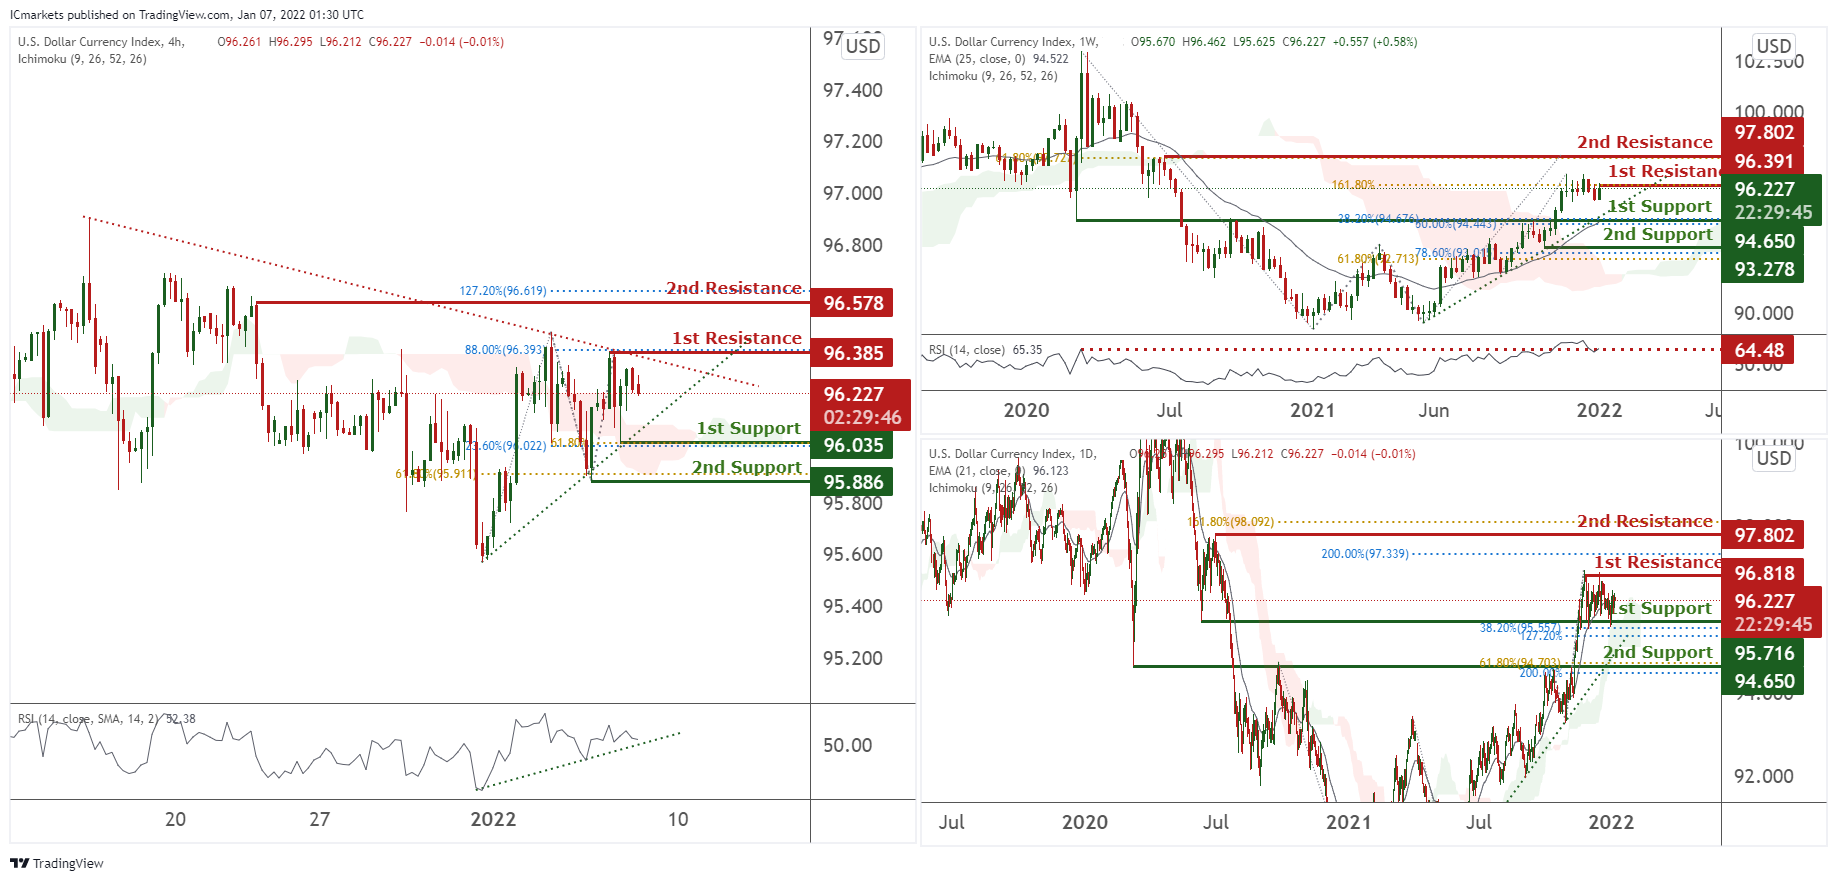
DXY:
On the weekly, prices are on bullish momentum and abiding to our ascending trendline. We see potential for prices to dip from our 1st resistance at 96.391 in line with 161.8% Fibonacci extension and 161.8% Fibonacci retracement towards our 1st support at 94.650 in line with 38.6% Fibonacci retracement and 50 5 Fibonacci retracement. RSI is at oversold levels.
On the daily, prices are on a bullish momentum and abiding to a bullish trendline. We see potential for prices to bounce from our 1st support at 95.716 in line with 38.2% Fibonacci retracement and 127.2% Fibonacci extension towards our 1st resistance at 96.818 in line with 200% Fibonacci projection. Our EMA 21 and ichimoku clouds are showing bullish momentum.
On the H4 timeframe, prices are consolidating in a triangle pattern. We would expect a bounce from our 1st support at 96.035 in line with 61.8% Fibonacci extension and 23.6% Fibonacci retracement towards our 1st resistance at 96.385 in line with 88% Fibonacci extension. RSI are depicting bullish momentum and also ichimoku clouds are showing bullish momentum.
Areas of consideration:
- H4 time frame, 1st resistance at 96.385
- H4 time frame, 1st support at 96.035
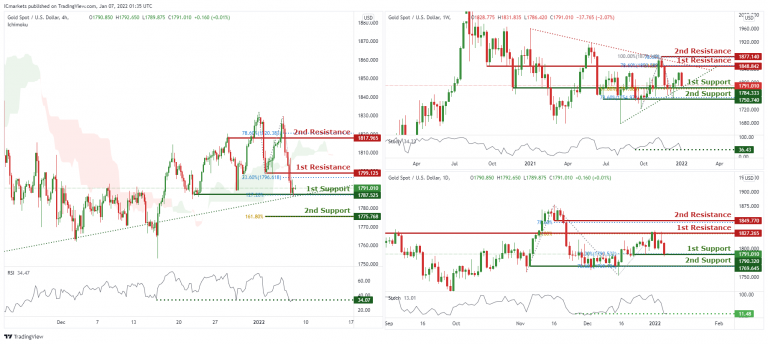
XAU/USD (GOLD):
On the weekly, prices have broken out of our triangle and are testing our 1st support at 1784.333 in line with 61.8% Fibonacci extension towards our 1st resistance at 1848.842 which is an area of Fibonacci confluences. RSI are at levels where bounces previously occurred. Alternatively our stop loss will be placed at our 2nd support at 1750.740.
On the daily, prices have approached our pivot. We see potential for a bounce from our 1st support at 1791.010 in line with 50% Fibonacci retracement and 78.6% Fibonacci retracement towards our 1st resistance at 1827.265 in line with 61.8% Fibonacci retracement. Our bias is further supported by Stochastics at levels where bounces previously occurred.
On the H4 chart, prices are abiding to our daily bullish trendline. We see potential for prices to climb from our 1st support at 1787.525 in line with 127.2% Fibonacci extension towards our 1st resistance at 1799.125 in line with 23.6% Fibonacci retracement. RSI is at a level where bounces previously occurred. Alternatively, breaking our 1st support will find prices climbing further towards our 2nd support at 1775.768 in line with 161.8% Fibonacci projection.
Areas of consideration:
- H4 1st support at 1787.525
- H4 1st resistance at 1799.125
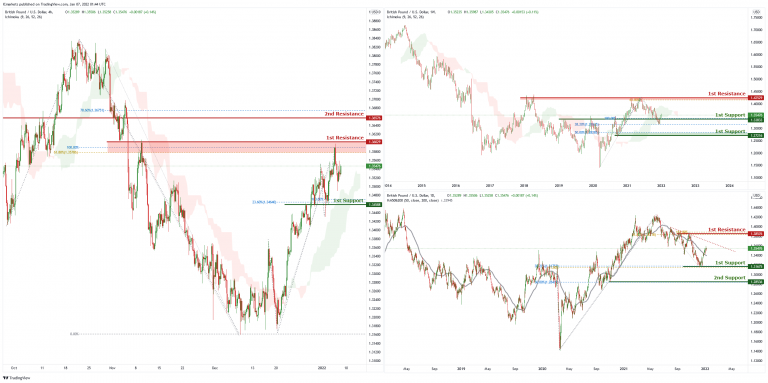
GBP/USD
On the weekly chart price is 1st support of 1.33833 which is also 100% Fibonacci projection and 38.2% Fibonacci retracement. Price can potentially go to the 1st resistance level of 1.42529 which is also 61.8% Fibonacci projection and graphical swing high level . Our bullish bias is supported by the ichimoku cloud indicator.
On the daily chart, price is abiding by a descending trendline and has recently reacted off the 1st support level of 1.31675 which is 38.2% Fibonacci retracement and 61.8% Fibonacci projection. Price can potentially go to the 1st resistance level of 1.38576 which is also 61.8% Fibonacci retracement and 61.8% Fibonacci projection. Our bullish bias is supported by the moving average as price is trading above it.
On the H4 chart, price is currently heading towards the first resistance level of 1.36029 which is also 100% Fibonacci projection and 61.8% Fibonacci retracement. Price can potentially dip to the 1st support level of 1.34588 which is also 23.6% Fibonacci retracement and 100% Fibonacci projection. Our bearish bias is supported by the stochastic indicator as it is near resistance level.
Areas of consideration:
- H4 1st resistance at 1.36029
- H4 1st support 1.34588
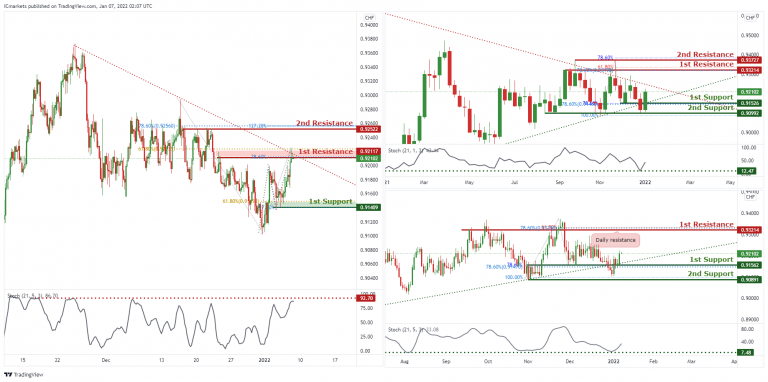
USD/CHF:
On the Weekly timeframe, price is reacting in a triangle pattern. Traders should wait for the price to swing higher or lower before entering. On the Daily timeframe, we can expect an overall bullish momentum. Price could bounce from 1st Support in line with 78.6% Fibonacci retracement and 78.6% FIbonacci projection towards 1st Resistance in line with 78.6% Fibonacci retracement and 61.8% Fibonacci projection. Our bullish bias is further supported by the stochastics indicator where the %D line is at the support level.
In reference to yesterday’s analysis, prices are on bearish momentum and abiding to our descending trendline. We can expect price to drop from 1st Resistance in line with 78.6% Fibonacci projection and 61.8% Fibonacci retracement towards 1st Support in line with 61.8% Fibonacci retracement and 127.2% Fibonacci projection. Our bearish bias is further supported by the stochastic indicator where the %K line is at the resistance level.
Areas of consideration:
- Watch 1st Support at 0.91409
- Watch 1st Resistance at 0.92117
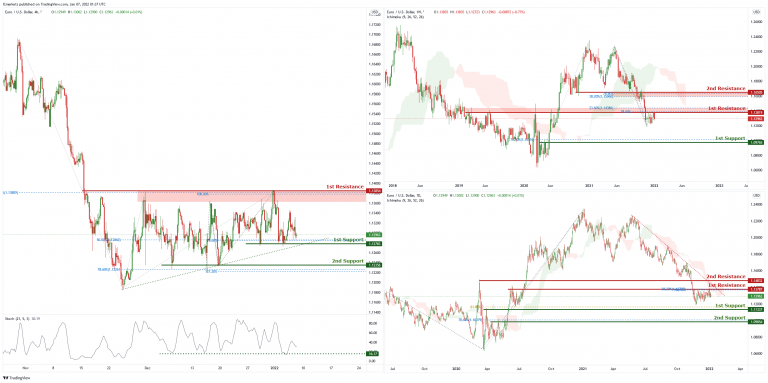
EUR/USD :
On the weekly chart price is near the 1st resistance level of 1.13819 which is also 23.6% Fibonacci retracement and 78.6% Fibonacci projection. Price can potentially dip to the 1st support level of 1.09765 which is 78.6% Fibonacci projection. Our bearish bias is supported by the ichimoku cloud indicator as price is trading below it.
On the daily chart price is abiding by a descending trendline and near 1st resistance level of 1.13787 which is also 38.2% Fibonacci retracement and 100% Fibonacci projection. Price can potentially dip to the 1st support level of 1.11337 which is 61.8% Fibonacci projection. Our bearish bias is supported by the ichimoku cloud indicator as price is trading below it.
On the H4 chart, price is abiding by an ascending trendline and is near 1st support level of 1.12783 which is also 50% Fibonacci retracement and 78.6% Fibonacci projection. Price can potentially go to the 1st resistance of 1.13854 which is also 100% Fibonacci projection and 38.2% Fibonacci retracement. Our bullish bias is supported by the stochastic indicator as it is near the support level.
Areas of consideration :
- H4 1st support at 1.12783
- H4 1st resistance at 1.13854
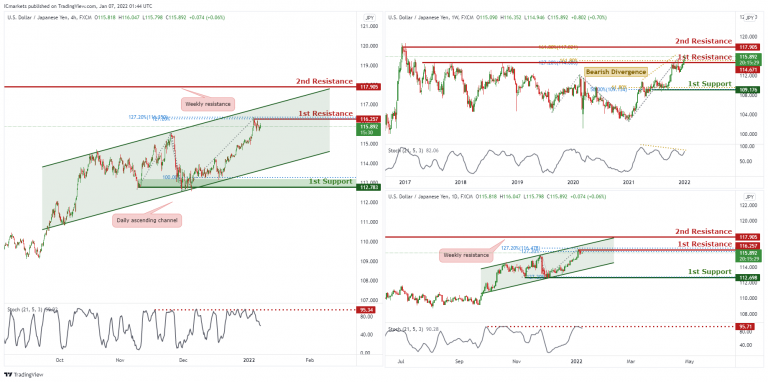
USD/JPY
On the Weekly timeframe, we can see that price touched the 1st resistance in line with horizontal swing highs and 127.2% FIbonacci Retracement and 161.8% Fibonacci Projection. We can expect the price to drop from the 1st Resistance towards the 1st Support in line with 61.8% Fibonacci projection and 50% Fibonacci retracement. Our short-term bearish momentum is further supported by the stochastic %K line holding below the descending trendline resistance and bearish divergence spotted. On the Daily timeframe, we can expect price to drop from 1st Resistance in line with 127.2% Fibonacci projection, 127.2% Fibonacci extension and previous swing high towards 1st Support in line with 127.2% Fibonacci projection and graphical overlap support. Our bearish bias is further supported by the stochastic indicator where the%K line is at the resistance level.
On the H4 timeframe, is abiding to the ascending channel on the daily, signifying an overall bullish momentum. However, we can expect price to make a short-term bearish drop from 1st Resistance in line with 127.2% Fibonacci projection and 127.2% Fibonacci extension towards 1st Support in line with 100% Fibonacci projection. Our short-term bearish bias is further supported by the stochastic indicator where the %K line dropped at resistance level.
Areas of consideration:
- H4 1st resistance level 116.257
- H4 1st support level 112.783
AUD/USD:
In reference to last week’s analysis, price has bounced nicely on the 1st Support. On the weekly, we can now expect the price to continue to push higher from the 1st Support in line with 61.8% Fibonacci projection, 38.2 % FIbonacci retracement and 127.2% Fibonacci extensions. Our bullish bias is further supported by the RSI indicator abiding to an ascending trendline. Traders should wait for price to swing higher or lower before entering again.
In reference to last week’s analysis price indeed bounced nicely on the 1st Support on the daily timeframe. On the Daily, the price is at the 1st support, we can expect the price to continue to push higher from 1st Support in line with 38.2% Fibonacci retracement towards 1st Resistance in line with 100% Fibonacci projection and 61.8% Fibonacci retracement. Our bullish bias is further supported by the MACD indicator where the MACD line is above the signal line.
On the H4, orice broke out of the ascending trendline support, signifying a bearish momentum. We can expect price to drop from 1st Resistance in line with 38.2% Fibonacci retracement and 61.8% Fibonacci projection towards 1st Support in line with 61.8% Fibonacci retracement. Our bearish bias is further supported by the price holding below the Ichimoku cloud.
Areas of consideration:
- H4 1st Support level 0.70894
- H4 1st resistance level 0.71844
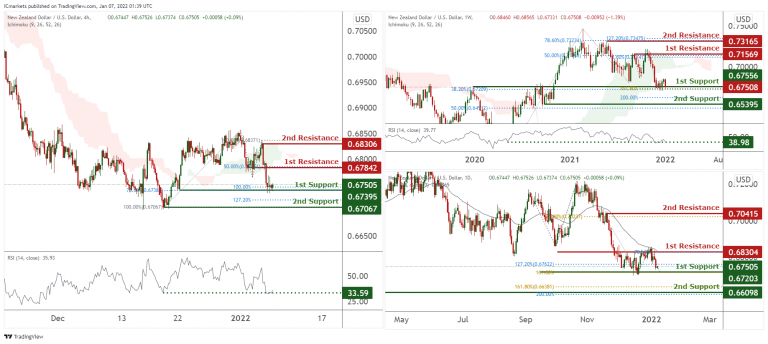
NZD/USD:
On the weekly, prices are on a bullish momentum. We see potential for a bounce at 1st support at 0.67556 in line with 38.2% Fibonacci retracement and 161.8% Fibonacci Projection towards 1st resistance in line with 50% Fibonacci retracement 78.6% Fibonacci extension. RSI is at levels where bounces happened previously. Alternatively, if prices break our 1st support, we might find it dipping towards our 2nd support at 0.65395 in line with 50% Fibonacci retracement and 200% Fibonacci projection.
On the daily, prices are on bearish momentum. We see potential for prices to dip from our 1st resistance at 0.68166 in line with 23.6% Fibonacci retracement towards our 1st support at 0.67203 in line with 127.2% Fibonacci retracement and 161.8% Fibonacci extension. Ichimoku clouds are forecasting the dips.
On the H4 timeframe, prices are at a Pivot and are experiencing a squeeze. We see potential for prices to bounce from our 1st support at 0.67505 in line with 100% Fibonacci extension and 78.6% Fibonacci retracement towards our 1st resistance at 0.67842 in line with 50% Fibonacci retracements. Our bias is further supported by RSI at a level where dips usually occur. If prices break our 1st support, prices can potentially dip towards our 2nd support at 0.67067 in line with 127.2% Fibonacci extensions and 100% Fibonacci retracement.
Areas of consideration:
- H4 time frame, 1st resistance at 0.67842
- H4 time frame, 1st support at 0.67395
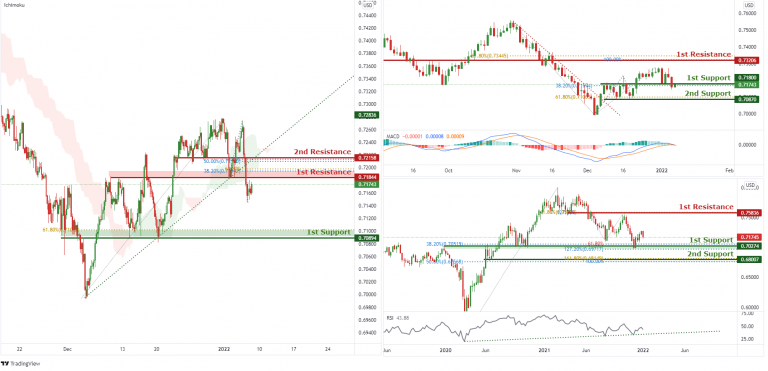
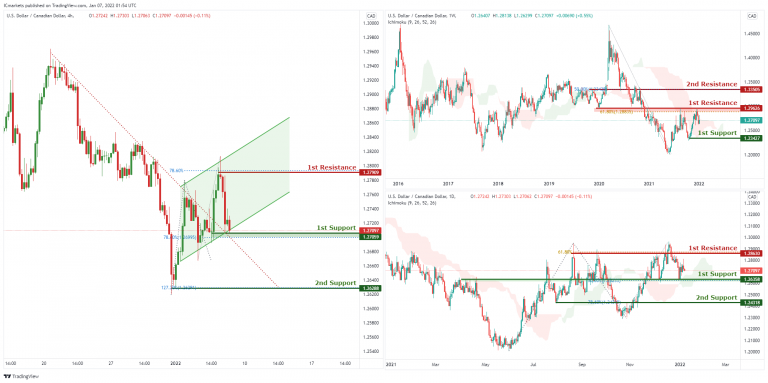
USD/CAD:
On the weekly, with price at the resistance of the ichimoku cloud, we have a bearish bias that price will drop from our 1st resistance at 1.29626 which is in line with horizontal horizontal resistance and 61.8% Fibonacci retracement to 1st support at 1.23427, which is in line with horizontal swing low support. Alternatively, price may break 1st resistance structure and head for 2nd resistance at 1.33505, which coincides with horizontal swing overlap resistance and the 50% Fibonacci retracement.
On the daily, with price moving above ichimoku cloud, we have a bullish bias that price will rise to our 1st resistance at 1.28630 which is in line with horizontal swing high resistance and 61.8% Fibonacci extension from 1st support at 1.26358, which is in line with horizontal overlap support and 50% Fibonacci retracement level. Alternatively, price may break 1st support structure and head for 2nd support at 1.24318, which coincides with horizontal overlap support and the 78.6% Fibonacci extension.
On the H4, with price moving within the ascending channel, we have a bullish bias that price will rise to our 1st resistance at 1.27909 which is in line with horizontal swing high resistance and 78.6% Fibonacci extension from 1st support at 1.27059, which is in line with horizontal swing low support and 78.6% Fibonacci retracement level. Alternatively, price may break 1st support structure and head for 2nd support at 1.26288, which coincides with horizontal swing low support and the 127.2% Fibonacci extension.
Areas of consideration:
- H4 time frame, 1st support at 1.27059
- H4 time frame, 1st resistance at 1.26288
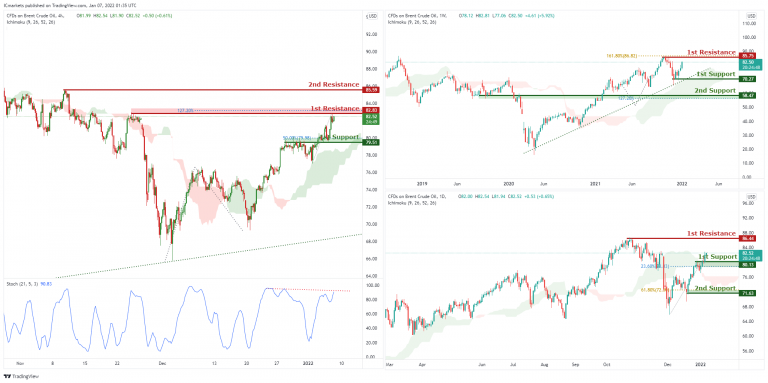
OIL:
On the weekly, with price moving above the ichimoku cloud, we have a bullish bias that price will rise to our 1st resistance at 85.75 which is in line with horizontal swing high resistance and 161.8% Fibonacci extension from 1st support at 70.27, which is in line with horizontal swing low support. Alternatively, price may break 1st support structure and head for 2nd support at 58.47, which coincides with horizontal overlap support and 127.2% Fibonacci extension level .
On the daily, with price moving above the ichimoku cloud, we have a bullish bias that price will rise to our 1st resistance at 86.44 which is in line with horizontal swing high resistance from 1st support at 80.13, which is in line with horizontal overlap support and 23.6% Fibonacci retracement level. Alternatively, price may break 1st support structure and head for 2nd support at 71.63, which coincides with horizontal overlap support and 61.8% Fibonacci retracement level .
On the H4, with price at the resistance of stochastics, we have a bearish bias that price will drop from our 1st resistance at 82.83 which is in line with horizontal swing high resistance and 127.2% Fibonacci extension to 1st support at 79.51, which is in line with horizontal swing overlap support and 50% fibonacci retracement. This is also where the support of the ichimoku cloud is. Alternatively, price may break 1st resistance structure and head for 2nd resistance at 85.59, which coincides with horizontal swing high resistance.
Areas of consideration:
- H4 time frame, 1st resistance of 82.83
- H4 time frame, 1st support of 79.51
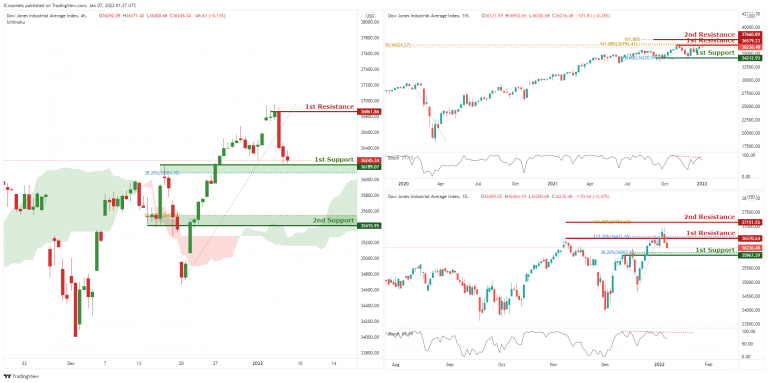
Dow Jones Industrial Average:
On the weekly, with price rejecting the resistance of stochastics, we have a bearish bias that price will drop from our 1st resistance at 36579 which is in line with horizontal swing high resistance and 161.8% Fibonacci extension to 1st support at 34212, which is in line with horizontal swing overlap support and 78.6% fibonacci retracement. This is also where the support of the ichimoku cloud is. Alternatively, price may break 1st resistance structure and head for 2nd resistance at 37660, which coincides with horizontal swing high resistance and 161.8% Fibonacci extension.
On the daily, with price rejecting the resistance of stochastics, we have a bearish bias that price will drop from our 1st resistance at 36570 which is in line with horizontal swing high resistance and 127.2% Fibonacci extension to 1st support at 35967, which is in line with horizontal swing overlap support and 38.2% fibonacci retracement. This is also where the support of the ichimoku cloud is. Alternatively, price may break 1st resistance structure and head for 2nd resistance at 37151, which coincides with horizontal swing high resistance and 161.8% Fibonacci extension.
On the H4, with price moving above the ichimoku cloud, we have a bullish bias that price will rise to our 1st resistance at 36861 which is in line with horizontal swing high resistance from 1st support at 36189, which is in line with horizontal overlap support and 32.8% Fibonacci retracement level. Alternatively, price may break 1st support structure and head for 2nd support at 35415, which coincides with horizontal overlap support and 61.8% Fibonacci retracement level .
Area of consideration:
- 4H resistance at 36861
- 4H support at 36189


