
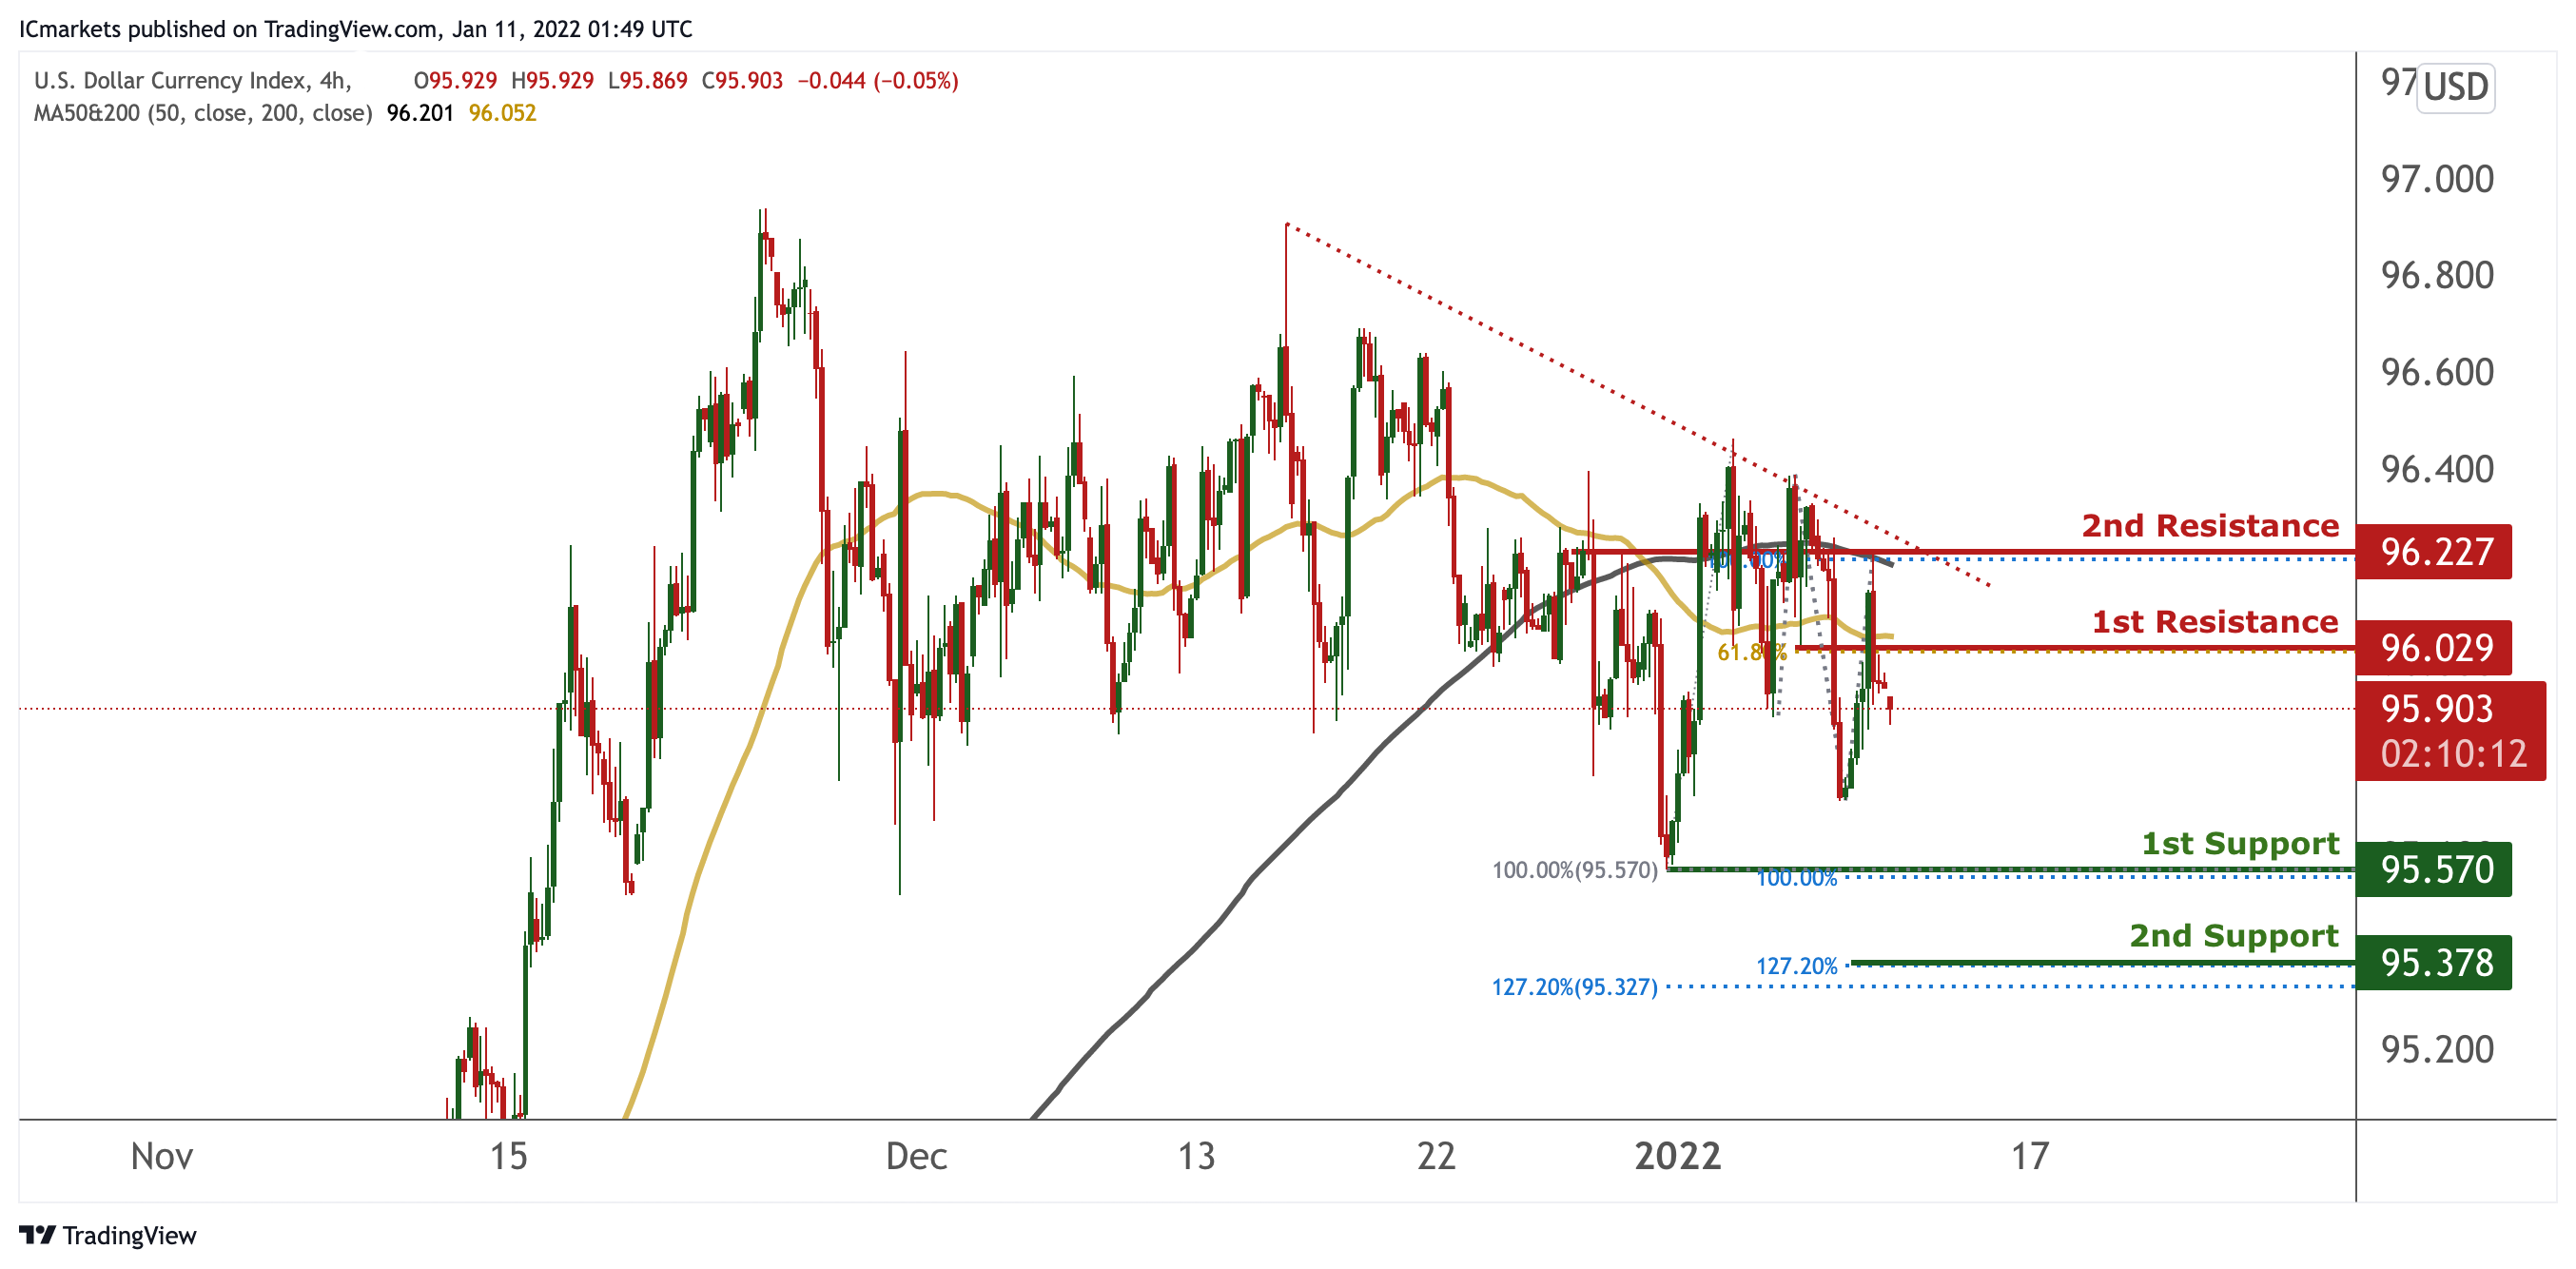
DXY:
On the H4 timeframe, prices are on bearish momentum and abiding to our bearish trendline. We would expect further bearish continuation from our 1st resistance at 96.029 in line with 61.8% Fibonacci extension towards our 1st support at 95.570 in line with 100% Fibonacci extension and 100% Fibonacci retracement. Our bearish bias is further supported by MA 50 and 200 forming a death cross.
Areas of consideration:
- H4 time frame, 1st resistance at 96.029
- H4 time frame, 1st support at 95.570
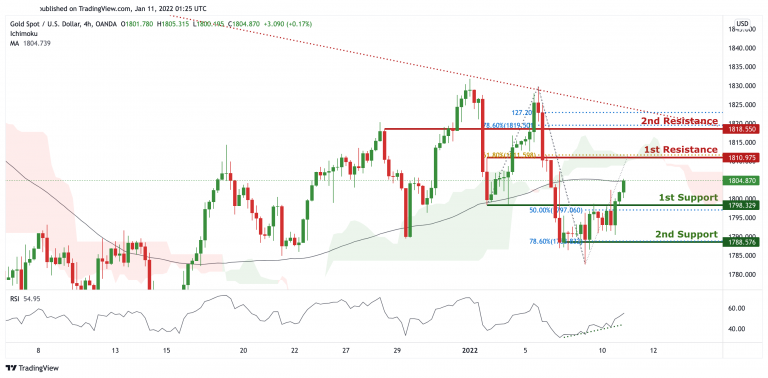
XAU/USD (GOLD):
On the H4 chart, prices are consolidating sideways and hovering in between our 1st support and 1st resistance. We see the potential for further bullish movement towards our 1st resistance at 1810.975 in line with 61.8% Fibonacci extension. RSI is also portraying bullish momentum and prices are surpassing our MA, further supporting our hypothesis. Alternatively, breaking our 1st support will find prices dipping towards our 2nd support at 1788.576 in line with 78.6% Fibonacci retracement.
Areas of consideration:
- H4 1st support at 1798.329
- H4 1st resistance at 1810.945
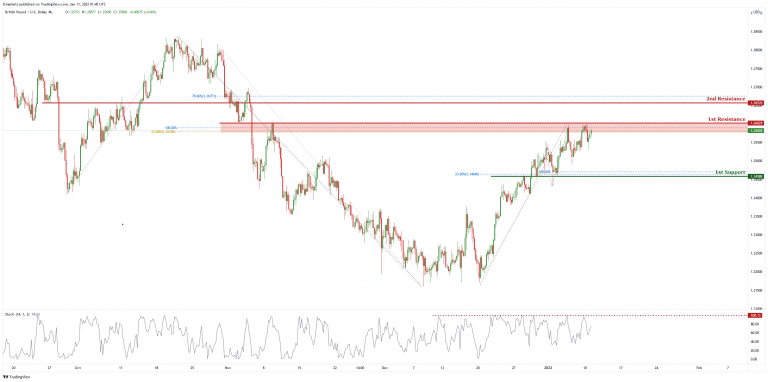
GBP/USD
On the H4 chart, price is at the first resistance level of 1.36029 which is also 100% Fibonacci projection and 61.8% Fibonacci retracement. Price can potentially dip to the 1st support level of 1.34588 which is also 23.6% Fibonacci retracement and 100% Fibonacci projection. Our bearish bias is supported by the stochastic indicator as it is near resistance level.
Areas of consideration:
- H4 1st resistance at 1.36029
- H4 1st support 1.34588
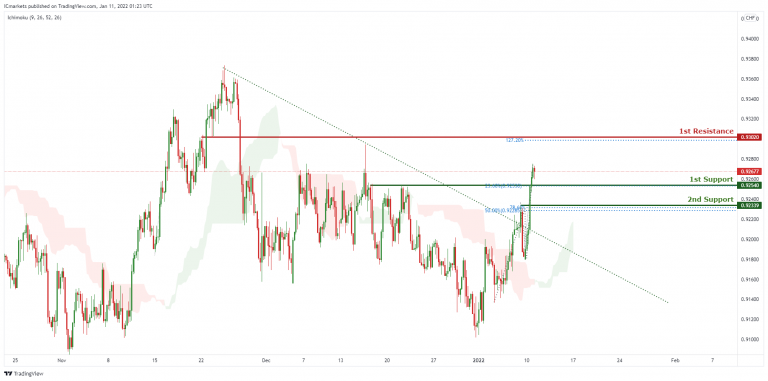
USD/CHF
On the H4 timeframe, price recently broke out of the descending trendline resistance, signifying an overall bullish momentum. We can expect price to bounce from the 1st Support level in line with 23.6% Fibonacci retracement towards the 1st Resistance in line with 127.2% Fibonacci projection. Our bullish bias is further supported by the Ichimoku cloud indicator where the price is holding above it.
Areas of consideration:
- Watch 1st Support at 0.92540
- Watch 1st Resistance at 0.93020
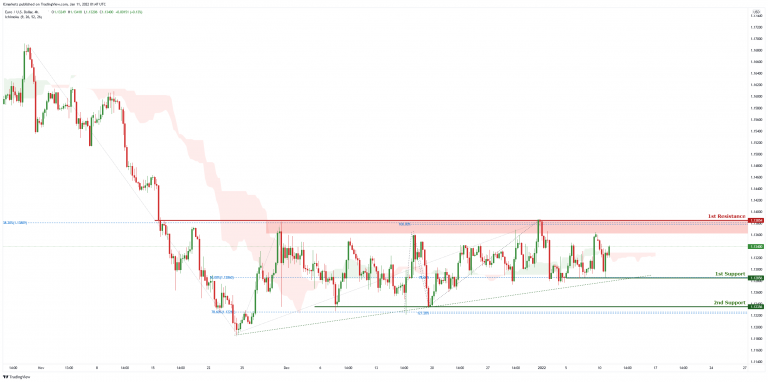
EUR/USD :
On the H4 chart, price is abiding by an ascending trendline and is heading to the 1st resistance level of 1.13854 which is also 100% Fibonacci projection and 38.2% Fibonacci retracement. Price can potentially dip to the 1st support level of 1.12783 which is also 50% Fibonacci retracement and 78.6% Fibonacci projection. Our bearish bias is supported by the ichimoku cloud indicator
Areas of consideration :
- H4 1st support at 1.12783
- H4 1st resistance at 1.13854
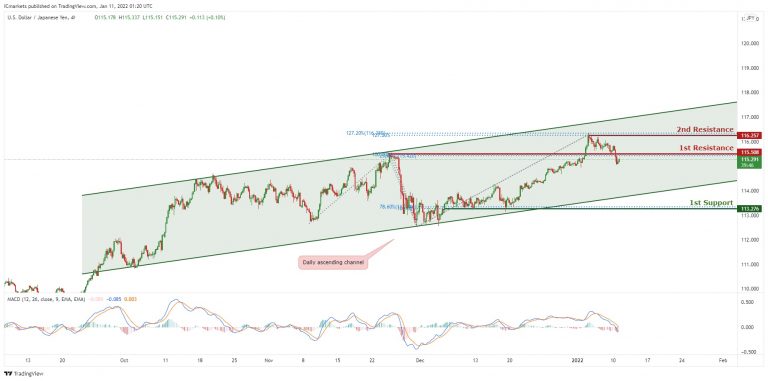
USD/JPY:
In reference to yesterday’s analysis, price is moving down nicely towards the 1st Support. On the H4 timeframe, is abiding to the ascending channel on the daily, signifying an overall bullish momentum. However, we can expect price to make a short-term bearish drop from 1st Resistance in line with 100% Fibonacci projection and 23.6% Fibonacci Retracement towards 1st Support in line with 78.6% Fibonacci retracement. Our short-term bearish bias is further supported by the MACD indicator where the signal line is above the MACD line.
Areas of consideration:
- H4 1st resistance level 115.508
- H4 1st support level 113.276
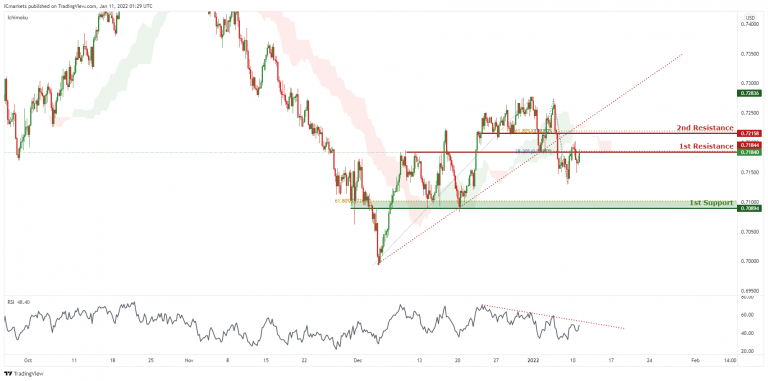
AUD/USD:
On the H4, price broke out of the ascending trendline support, signifying a bearish momentum. We can expect price to drop from 1st Resistance in line with 38.2% Fibonacci retracement and 61.8% Fibonacci projection towards 1st Support in line with 61.8% Fibonacci retracement. Our bearish bias is further supported by the price holding below the Ichimoku cloud and RSI indicator where it is abiding to the descending trendline resistance.
Areas of consideration:
- H4 1st Support level 0.70894
- H4 1st resistance level 0.71844
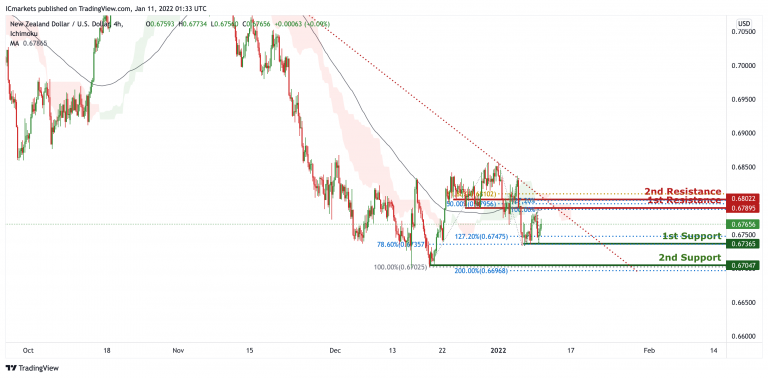
NZD/USD:
On the H4 timeframe, prices are on bearish momentum and abiding to our bearish trendline. We see potential for prices to dip further from our 1st resistance at 0.67895 in line with 100% Fibonacci extension and 50% Fibonacci retracement towards our 1st support at 0.67365 in line with 78.6% Fibonacci retracements and 127.2% Fibonacci extension. Our bias is further supported by ichimoku clouds forecasting the dip and also prices trading below our MA. If prices break our 1st support, prices can potentially dip towards our 2nd support at 0.67047 in line with 200% Fibonacci projection and 100% Fibonacci retracement.
Areas of consideration:
- H4 time frame, 1st resistance at 0.67895
- H4 time frame, 1st support at 0.67365
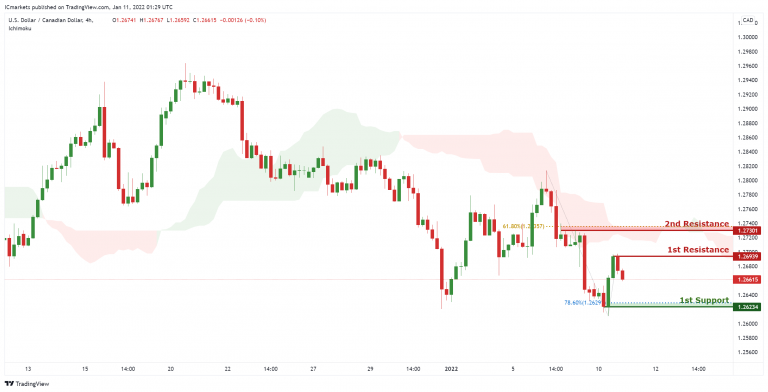
USD/CAD:
On the H4, with price moving below the ichimoku cloud, we have a bearish bias that price will drop from our 1st resistance at 1.26939 which is in line with horizontal swing high resistance to 1st support at 1.26234, which is in line with horizontal swing low support and 78.6% fibonacci retracement. Alternatively, price may break 1st resistance structure and head for 2nd resistance at 1.27301, which coincides with horizontal swing high resistance and 61.8% Fibonacci retracement.
Areas of consideration:
- H4 time frame, 1st support at 1.26234
- H4 time frame, 1st resistance at 1.26939
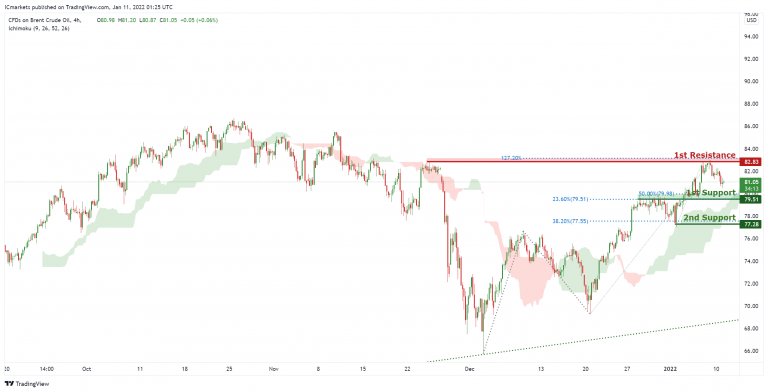
OIL:
On the H4, with price moving above the ichimoku cloud, we have a bullish bias that price will rise to our 1st resistance at 82.83 which is in line with horizontal swing high resistance and 127.2% Fibonacci extension from 1st support at 79.51, which is in line with horizontal overlap support and 23.6% and 50% Fibonacci retracement level. Alternatively, price may break 1st support structure and head for 2nd support at 77.28, which coincides with horizontal overlap support and 61.8% Fibonacci retracement level .
Areas of consideration:
- H4 time frame, 1st resistance of 82.83
- H4 time frame, 1st support of 79.51
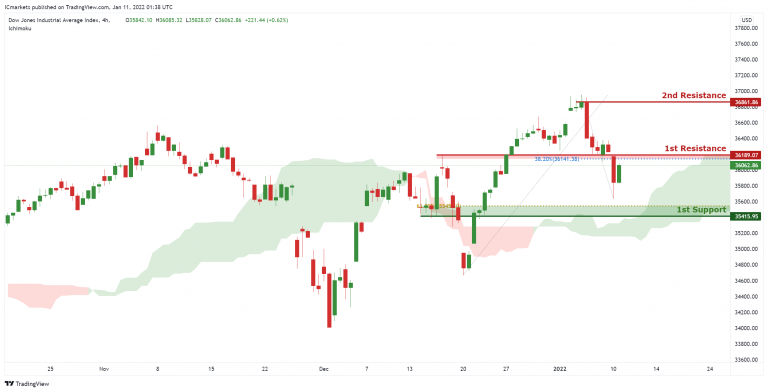
Dow Jones Industrial Average:
On the H4, with price moving below the ichimoku cloud, we have a bearish bias that price will drop from our 1st resistance at 36189 which is in line with horizontal swing overlap resistance to 1st support at 35415, which is in line with horizontal overlap support and 61.8% fibonacci retracement. Alternatively, price may break 1st resistance structure and head for 2nd resistance at 36861, which coincides with horizontal swing high resistance.
Areas of consideration:
- H4 time frame, 1st resistance of 36189
- H4 time frame, 1st support of 35415


