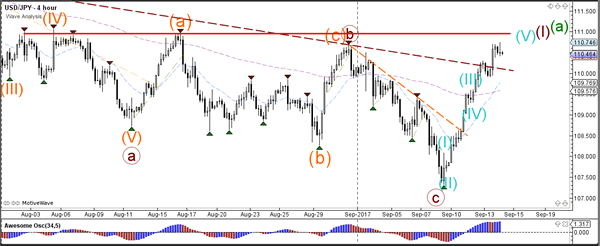
Currency pair USD/JPY
The USD/JPY bullish momentum broke above the resistance trend line (dotted brown) but price has a strong horizontal resistance level nearby (red). Price seems to be building 5 (blue) bullish waves within wave 1 or wave A.
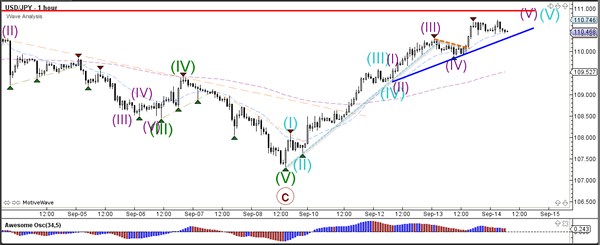
The USD/JPY is showing strong bullish momentum and is building 5 extended waves (purple). A break below support could indicate the start of a bearish correction.
Currency pair EUR/USD
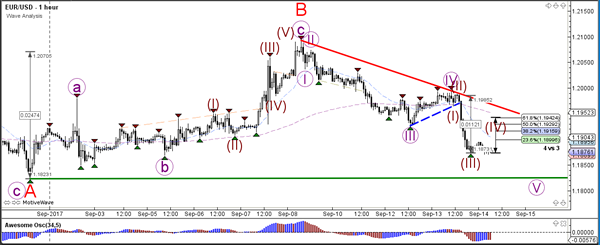
The EUR/USD broke below the support trend line (dotted blue) and extended the bearish price action. The wave structure is most likely indicating a wave C (red) within a larger wave 4 (blue). The Fibonacci levels of wave C vs A are most likely bouncing spots for further upside.
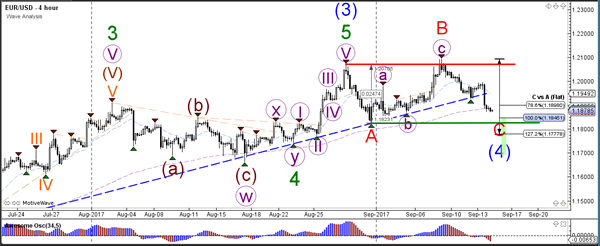
The EUR/USD broke below the minor support (dotted blue) and price is building 5 internal waves (brown) within wave 5 (purple). Price could bounce at the previous bottom (green line) of wave A for instance. A break of resistance (red) could indicate the start of a new uptrend.
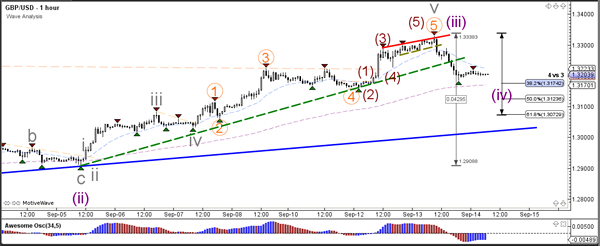
Currency pair GBP/USD
The GBP/USD broke below the support trend line (dotted green) and completed the 3rd wave (purple). Price could now be in a potential wave 4 (purple) retracement which could bounce at the Fibonacci levels of wave 4 vs 3.
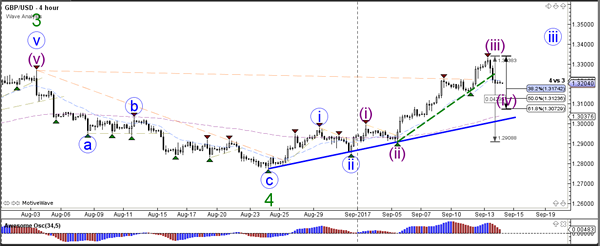
The GBP/USD did indeed complete multiple waves 5 at around 1.33. The retracement has broken below multiple support levels (dotted green) and is now testing the Fibonacci levels.