
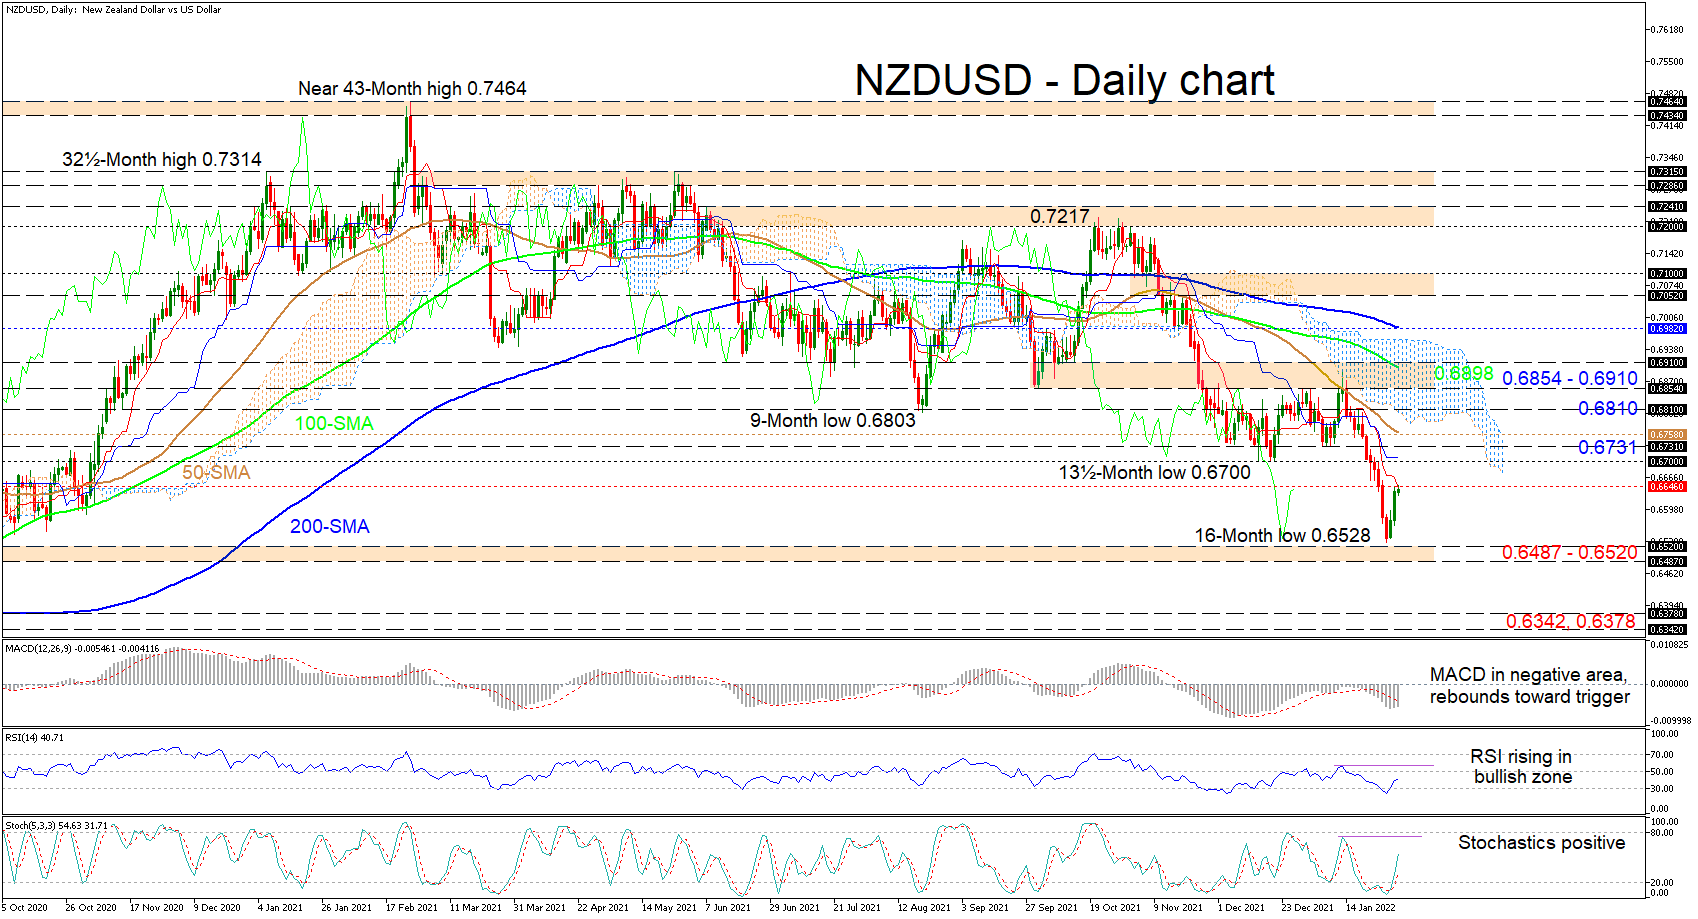
NZDUSD buyers emerged around the 0.6528 mark just shy of a key support base of the broader uptrend, where a five-month rally in the pair began, recording a 3½-year high of 0.7464. The diving simple moving averages (SMAs) are shielding the bearish mood in the pair.
Currently, the Ichimoku lines are indicating a pause in downward forces as buyers are opposing the decline. Moreover, the short-term oscillators are reflecting the fresh surge in positive momentum, which evolved at the 16-month low level. The MACD, some distance beneath zero, is improving towards its red trigger line, while the RSI is climbing towards the 50 neutral threshold. The strong positive charge in the stochastic oscillator hints that additional headways could unfold in the pair.
If the price runs past the red Tenkan-sen line at 0.6646, the pair could then test a zone of resistance between the inside swing lows of 0.6700 and 0.6731. Recouping additional portions of previously lost ground, the pair may meet the descending 50-day SMA at 0.6758 prior to confronting the Ichimoku cloud’s lower band and the adjacent 0.6810 resistance barrier. If buying interest remains elevated, the bulls could then encounter the 0.6854-0.6910 tough resistance section, which is weighing on bullish progress in the pair.
In the negative scenario, if the red Tenkan-sen line puts out the fire in the fresh rally from 0.6528, persisting negative pressures could drive the price back down, revisiting the 16-month low of 0.6528 and taking another crack at the critical 0.6487-0.6520 support base, which was moulded over the July to September 2020 period. A break of this significant upside defence may accelerate the decline in the pair, bringing the 0.6378 border – from June 2020 – and the 0.6342 obstacle into focus.
Summarizing, NZDUSD is sustaining a bearish bias below the falling SMAs and the 0.6854-0.6910 resistance zone. A break below the 0.6487-0.6520 support band could trigger considerable weakening in the pair, while a climb above the 50-day SMA at 0.6758 may soften recent downside pressures. However, buyers would need to steer north of the cloud to restore optimism in the pair.


