
DXY:
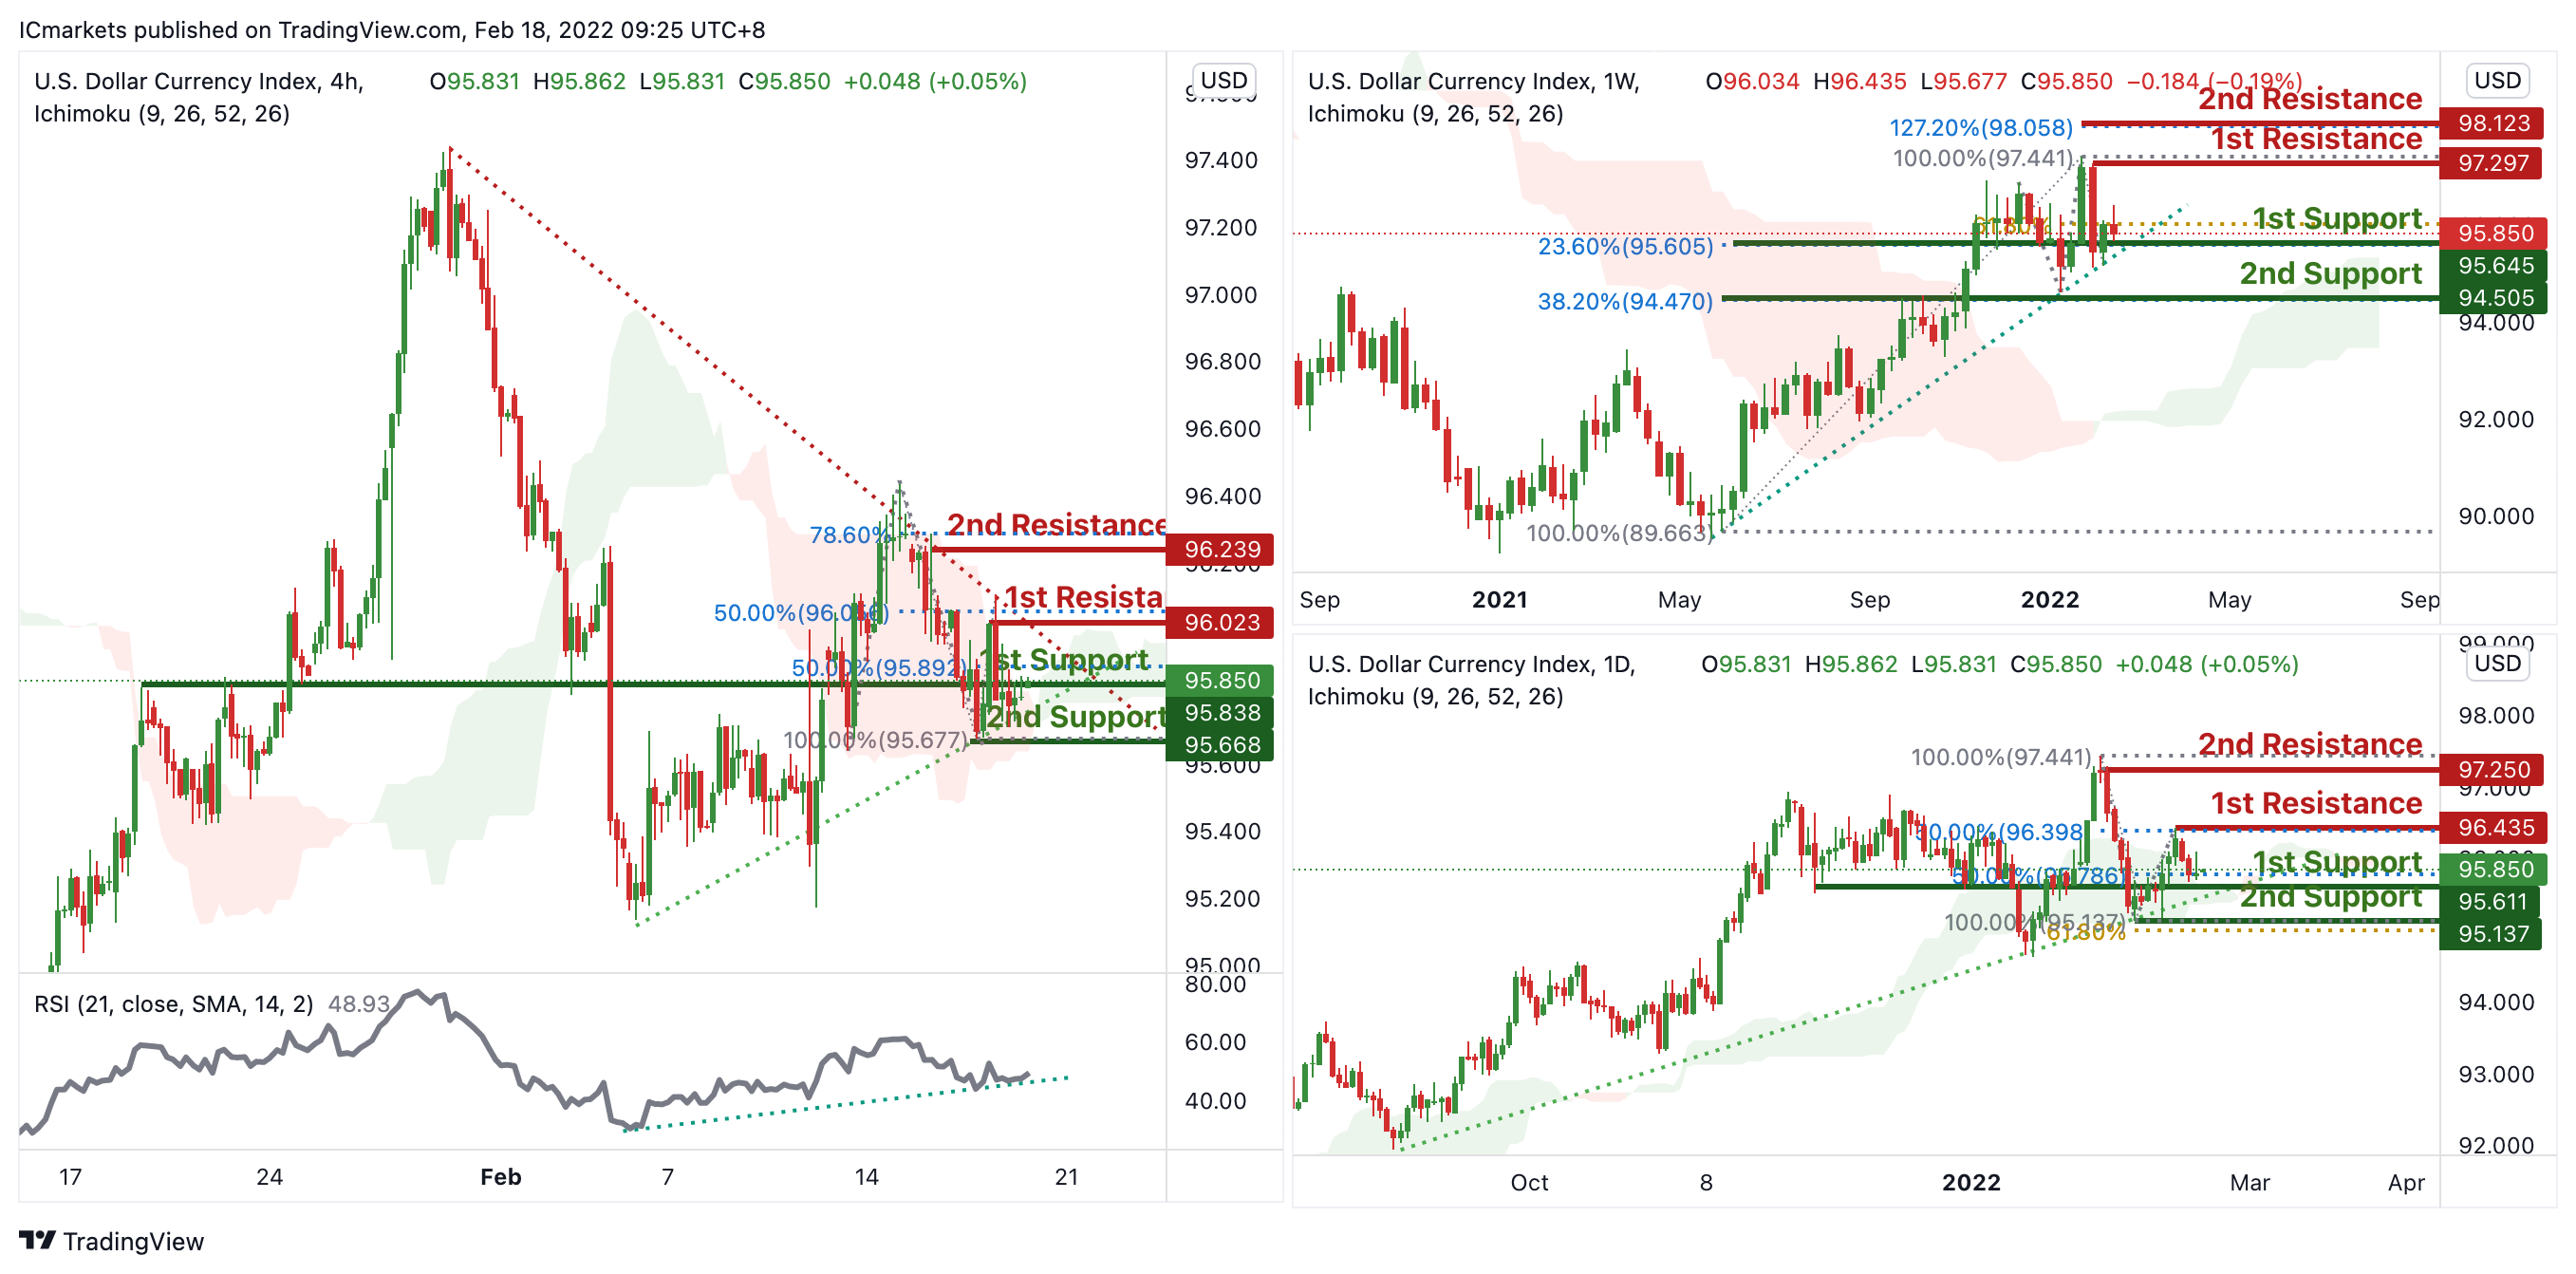
On the weekly, prices are on bullish momentum and abiding to our ascending trendline. We see potential for prices to bounce from our 1st support at 96.645 in line with 23.6% Fibonacci retracement and 61.8% Fibonacci extension towards our 1st resistance at 97.297 in line with 100% Fibonacci retracement. Prices are trading above our Ichimoku Cloud support, further supporting our bullish bias.
On the daily, prices are on a bullish momentum and abiding to a bullish trendline. We see potential for prices to bounce from our 1st support at 95.611 in line with 50% Fibonacci retracement towards our 1st resistance at 96.435 in line with 50% Fibonacci retracement. Prices are trading above our Ichimoku Cloud support, further supporting our bullish bias.
On the H4 timeframe, prices are consolidating in a triangle. We would expect a bounce from our 1st support at 95.850 in line with 50% Fibonacci retracement towards our 1st resistance at 96.023 in line with 50% Fibonacci retracement. Our bullish bias is further supported by RSI depicting bullish momentum and also prices trading our ichimoku clouds.
Areas of consideration:
- H4 time frame, 1st resistance at 96.023
- H4 time frame, 1st support at 95.838
XAU/USD (GOLD):
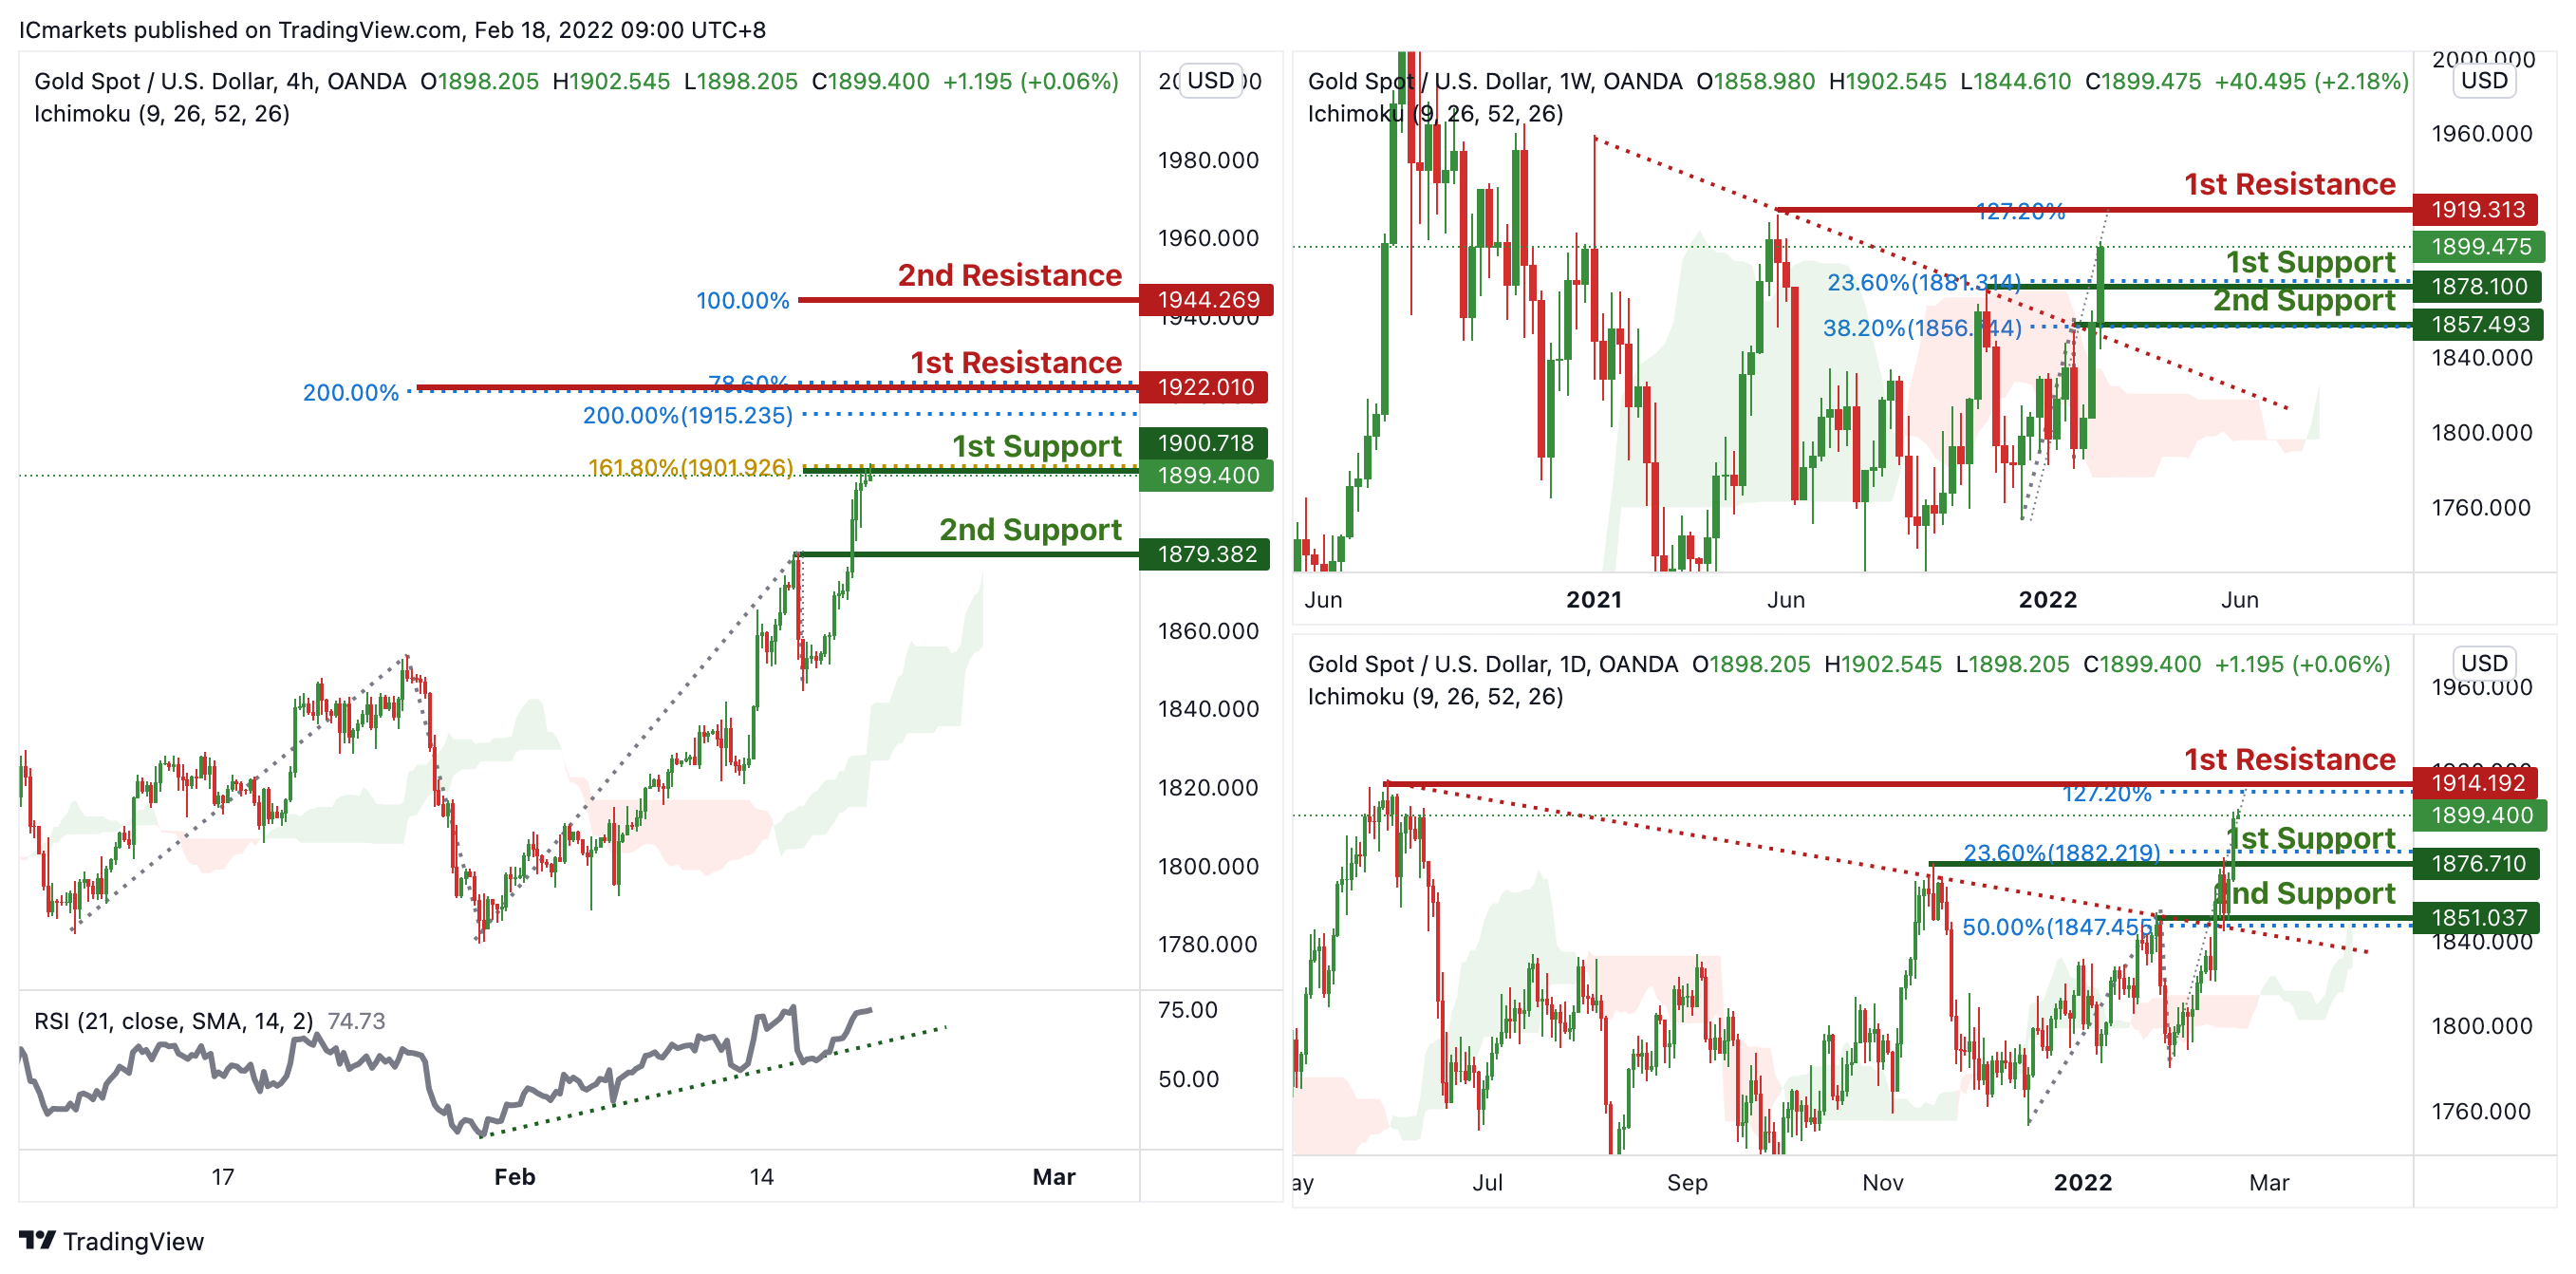
On the weekly, prices have broken out of our descending trendline resistance and are on bullish momentum. We see the potential for bullish continuation from our 1st support at 1878.1 in line with 23.6% Fibonacci retracement towards our 1st resistance at 1919.313 in line with 127.2% Fibonacci extension. Ichimoku is supporting our bias by forecasting green clouds.
On the daily, prices have broken out of our descending trendline resistance and are on bullish momentum. We see the potential for bullish continuation from our 1st support at 1876.71 in line with 23.6% Fibonacci retracement towards our 1st resistance at 1914.192 in line with 127.2% Fibonacci extension. Prices are trading above our Ichimoku support, further supporting our bullish bias.
On the H4 chart, prices are on bullish momentum. We see potential for bullish continuation from our 1st support at 1899.4 in line with 161.8% Fibonacci projection towards our 1st resistance at 1922.010 which is an area of Fibonacci confluences. Prices are trading above our Ichimoku support and RSI is depicting bullish momentum, further supporting our bullish bias.
Areas of consideration:
- 4h 1st support at 1899.4
- 4h 1st resistance at 1922.010
GBP/USD
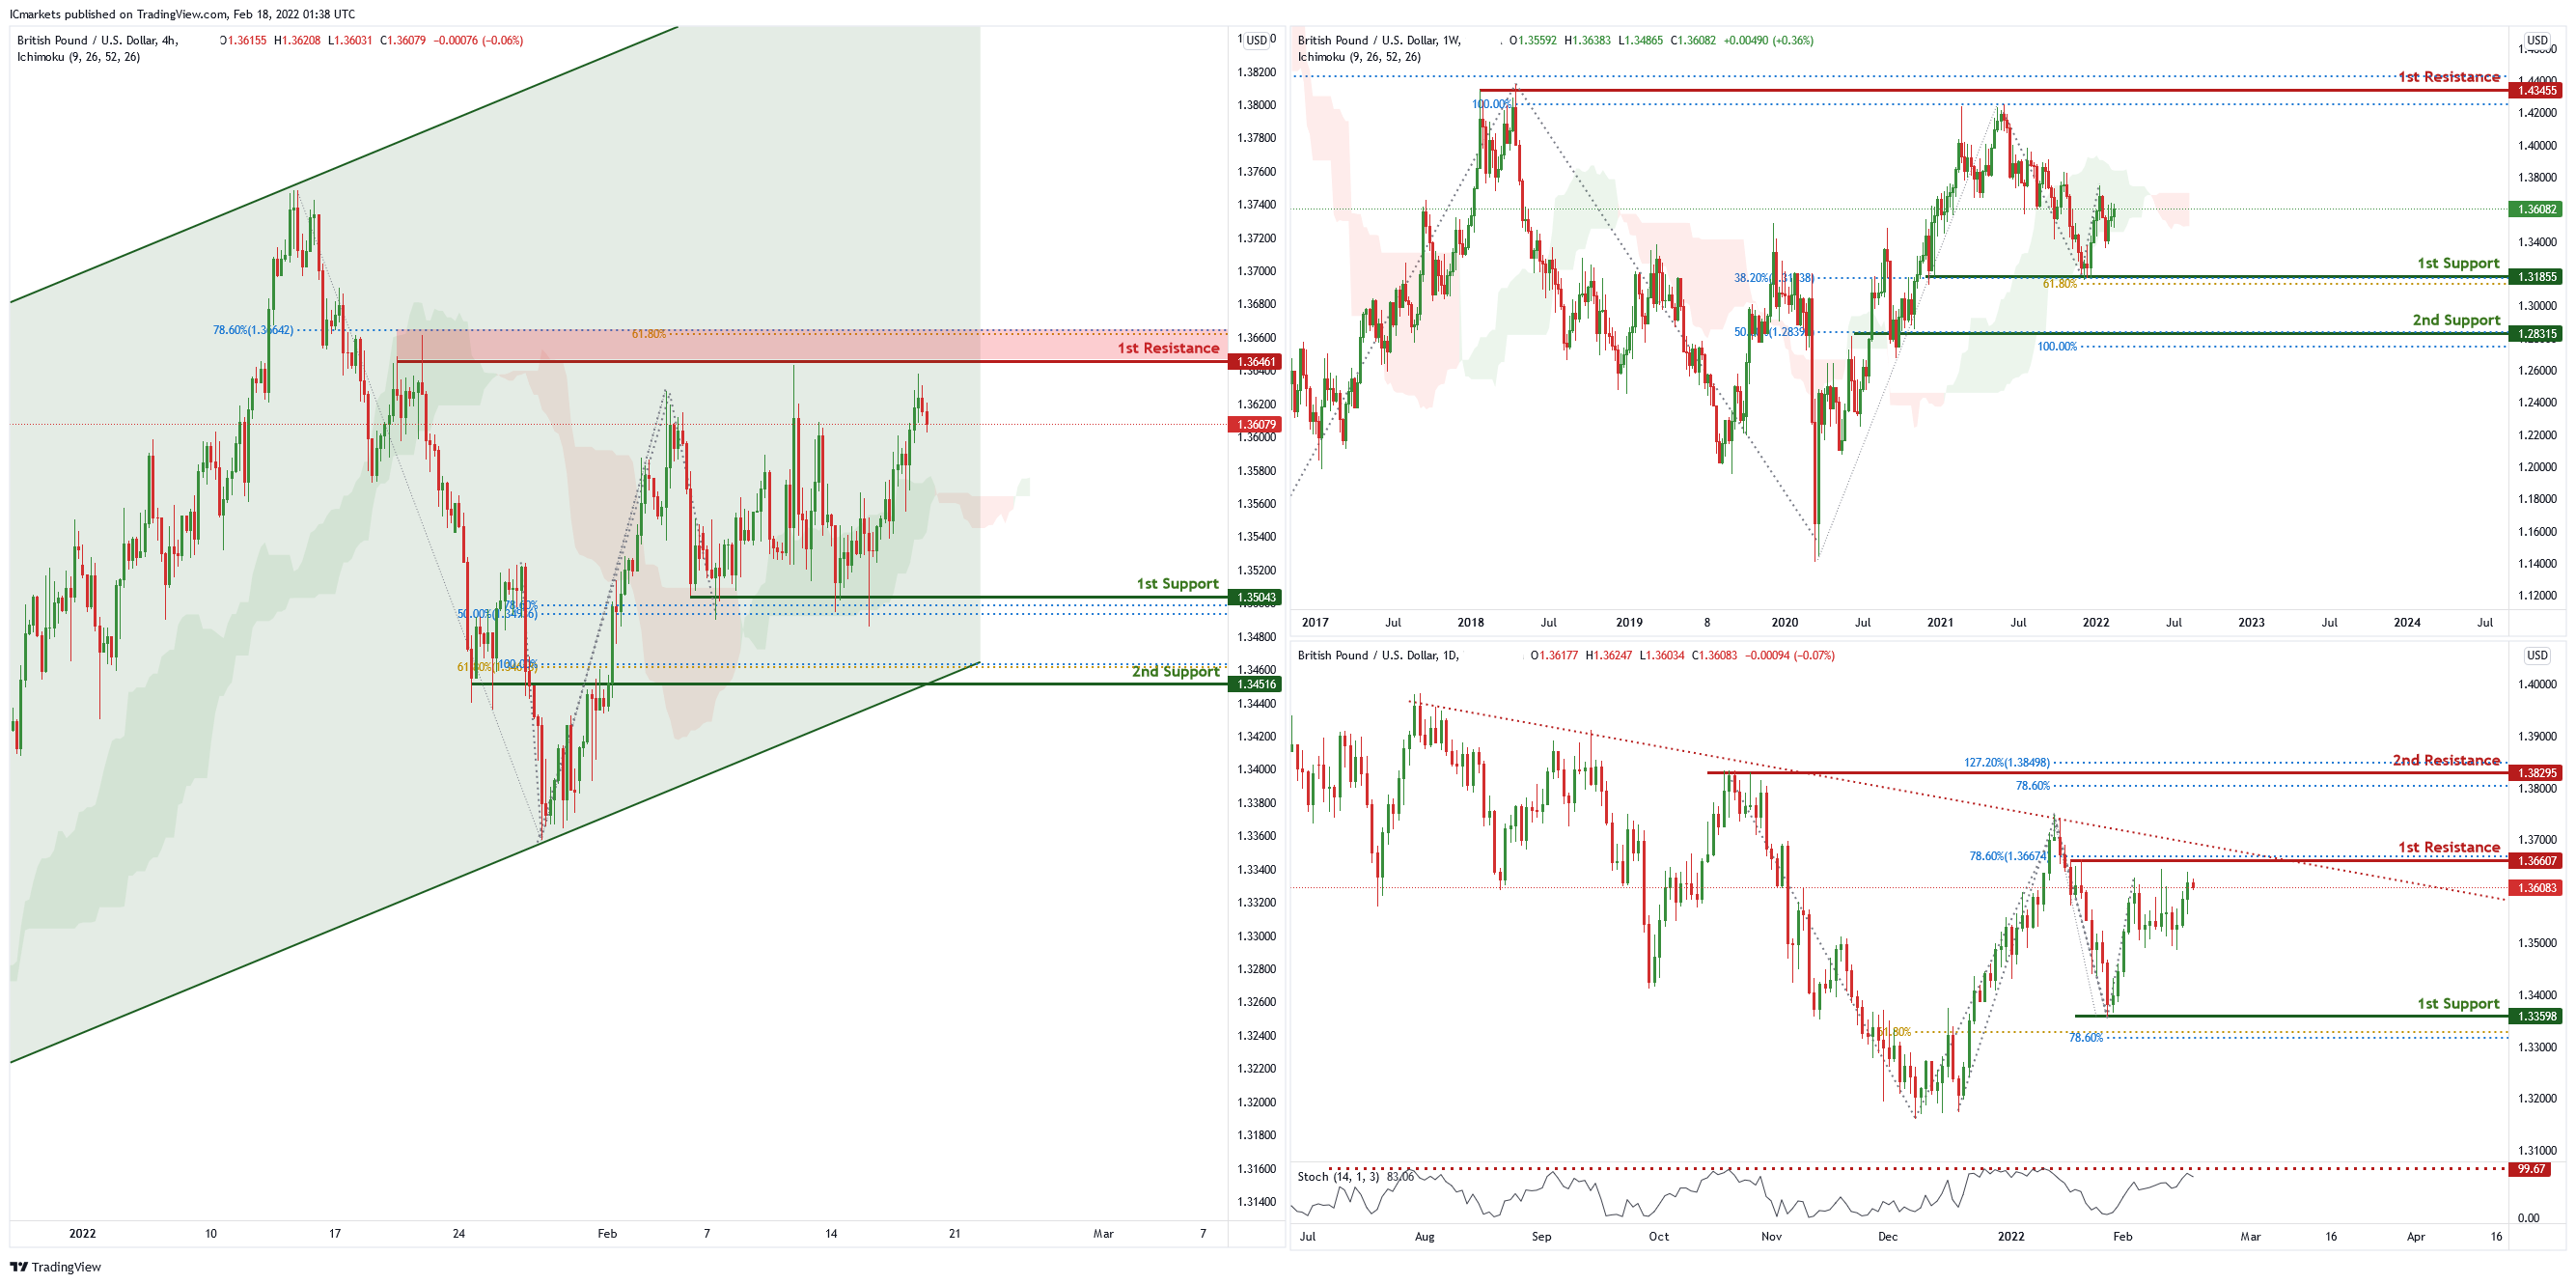
On the weekly chart , price has recently bounced off the 1st support level of 1.31885 which is also 38.2% Fibonacci retracement and 61.8% Fibonacci projection. Price can potentially go to the 1st resistance level of 1.42498 which is also 100% Fibonacci projection and 50% Fibonacci retracement. Our bullish bias is supported by the ichimoku cloud indicator.
On the daily chart , price is abiding by a descending trendline and near the 1st resistance level of 1.36607 which is 78.6% Fibonacci retracement. Price can potentially dip to the 1st support level of 1.33598 which is also 61.8% Fibonacci projection and 78.6% Fibonacci retracement. Our bearish bias is supported by the stochastic indicator as it is near resistance level.
On the H4 chart , price is near 1st resistance level of 1.36461 in line with 61.8% Fibonacci retracement and 78.6% Fibonacci projection. Price can potentially dip to the take profit level of 1.35026 in line with 50% Fibonacci retracement and 100% Fibonacci projection . Our bearish bias is supported by the stochastic indicator as it is near resistance level.
Areas of consideration
- H4 1st resistance at 1.36461
- H4 1st support at 1.35026
USD/CHF:
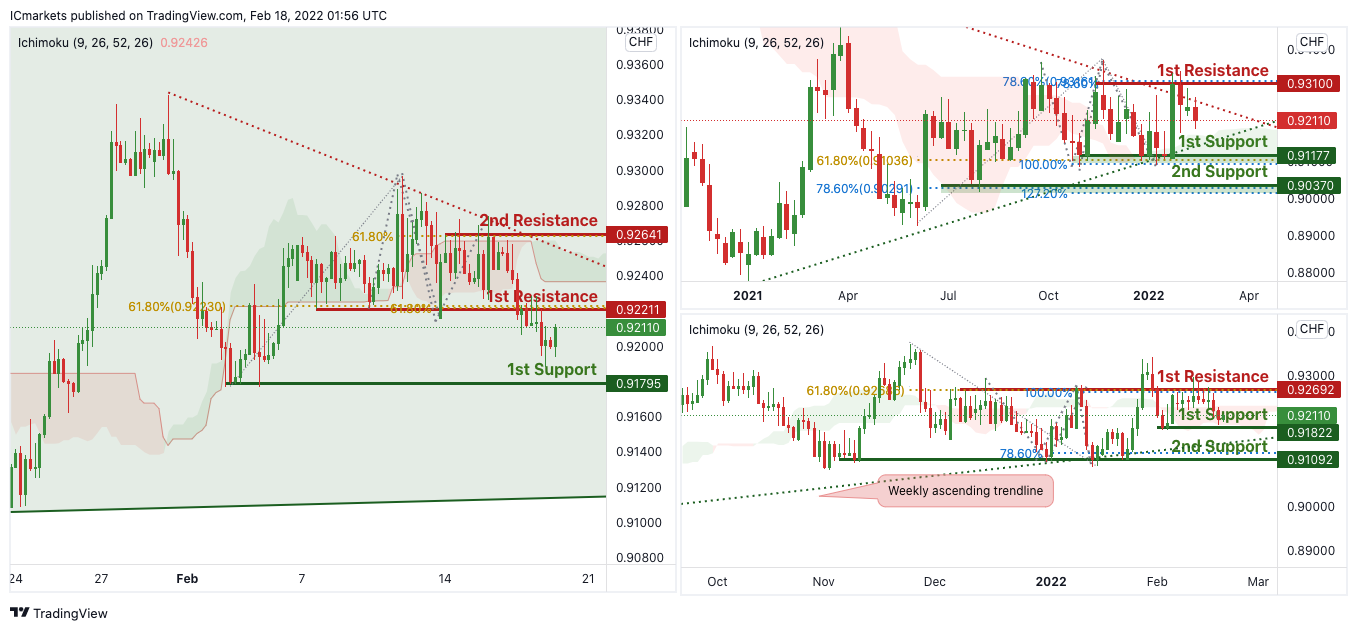
On the Weekly, with price expected to bounce off the support of the ichimoku cloud, signifying an overall bullish momentum. We can expect price to rise to our 1st resistance at 0.93100 in line horizontal graphical swing high resistance and 78.6% Fibonacci extension level from our 1st support in line with horizontal overlap support and 100% Fibonacci projection at 0.91177. Alternatively, price may break 1st support structure and head for 2nd support, which coincides with horizontal swing low support and 127.2% Fibonacci extension at 0.90370.
On the Daily, with price expected to bounce off the support of the ichimoku cloud, signifying an overall bullish momentum. We can expect price to rise to our 1st resistance at 0.92692 in line horizontal graphical swing high resistance and 100% Fibonacci projection level from our 1st support in line with horizontal overlap support at 0.91822. Alternatively, price may break 1st support structure and head for 2nd support, which coincides with horizontal swing low support and 78.6% Fibonacci extension at 0.92692.
On the H4 timeframe, price is abiding to the daily ascending channel and descending trendline resistance on the H4. We can expect the price to drop from 1st Resistance in line with 61.8% Fibonacci projection towards 1st Support in line with 61.8% Fibonacci projection and 61.8% Fibonacci retracement. Our bearish bias is further supported by the RSI indicator where it is abiding to the descending trendline resistance. Traders should wait for prices to swing higher or lower before entering.
Areas of consideration:
- Watch 1st Support at 0.91795
- Watch 1st Resistance at 0.92211
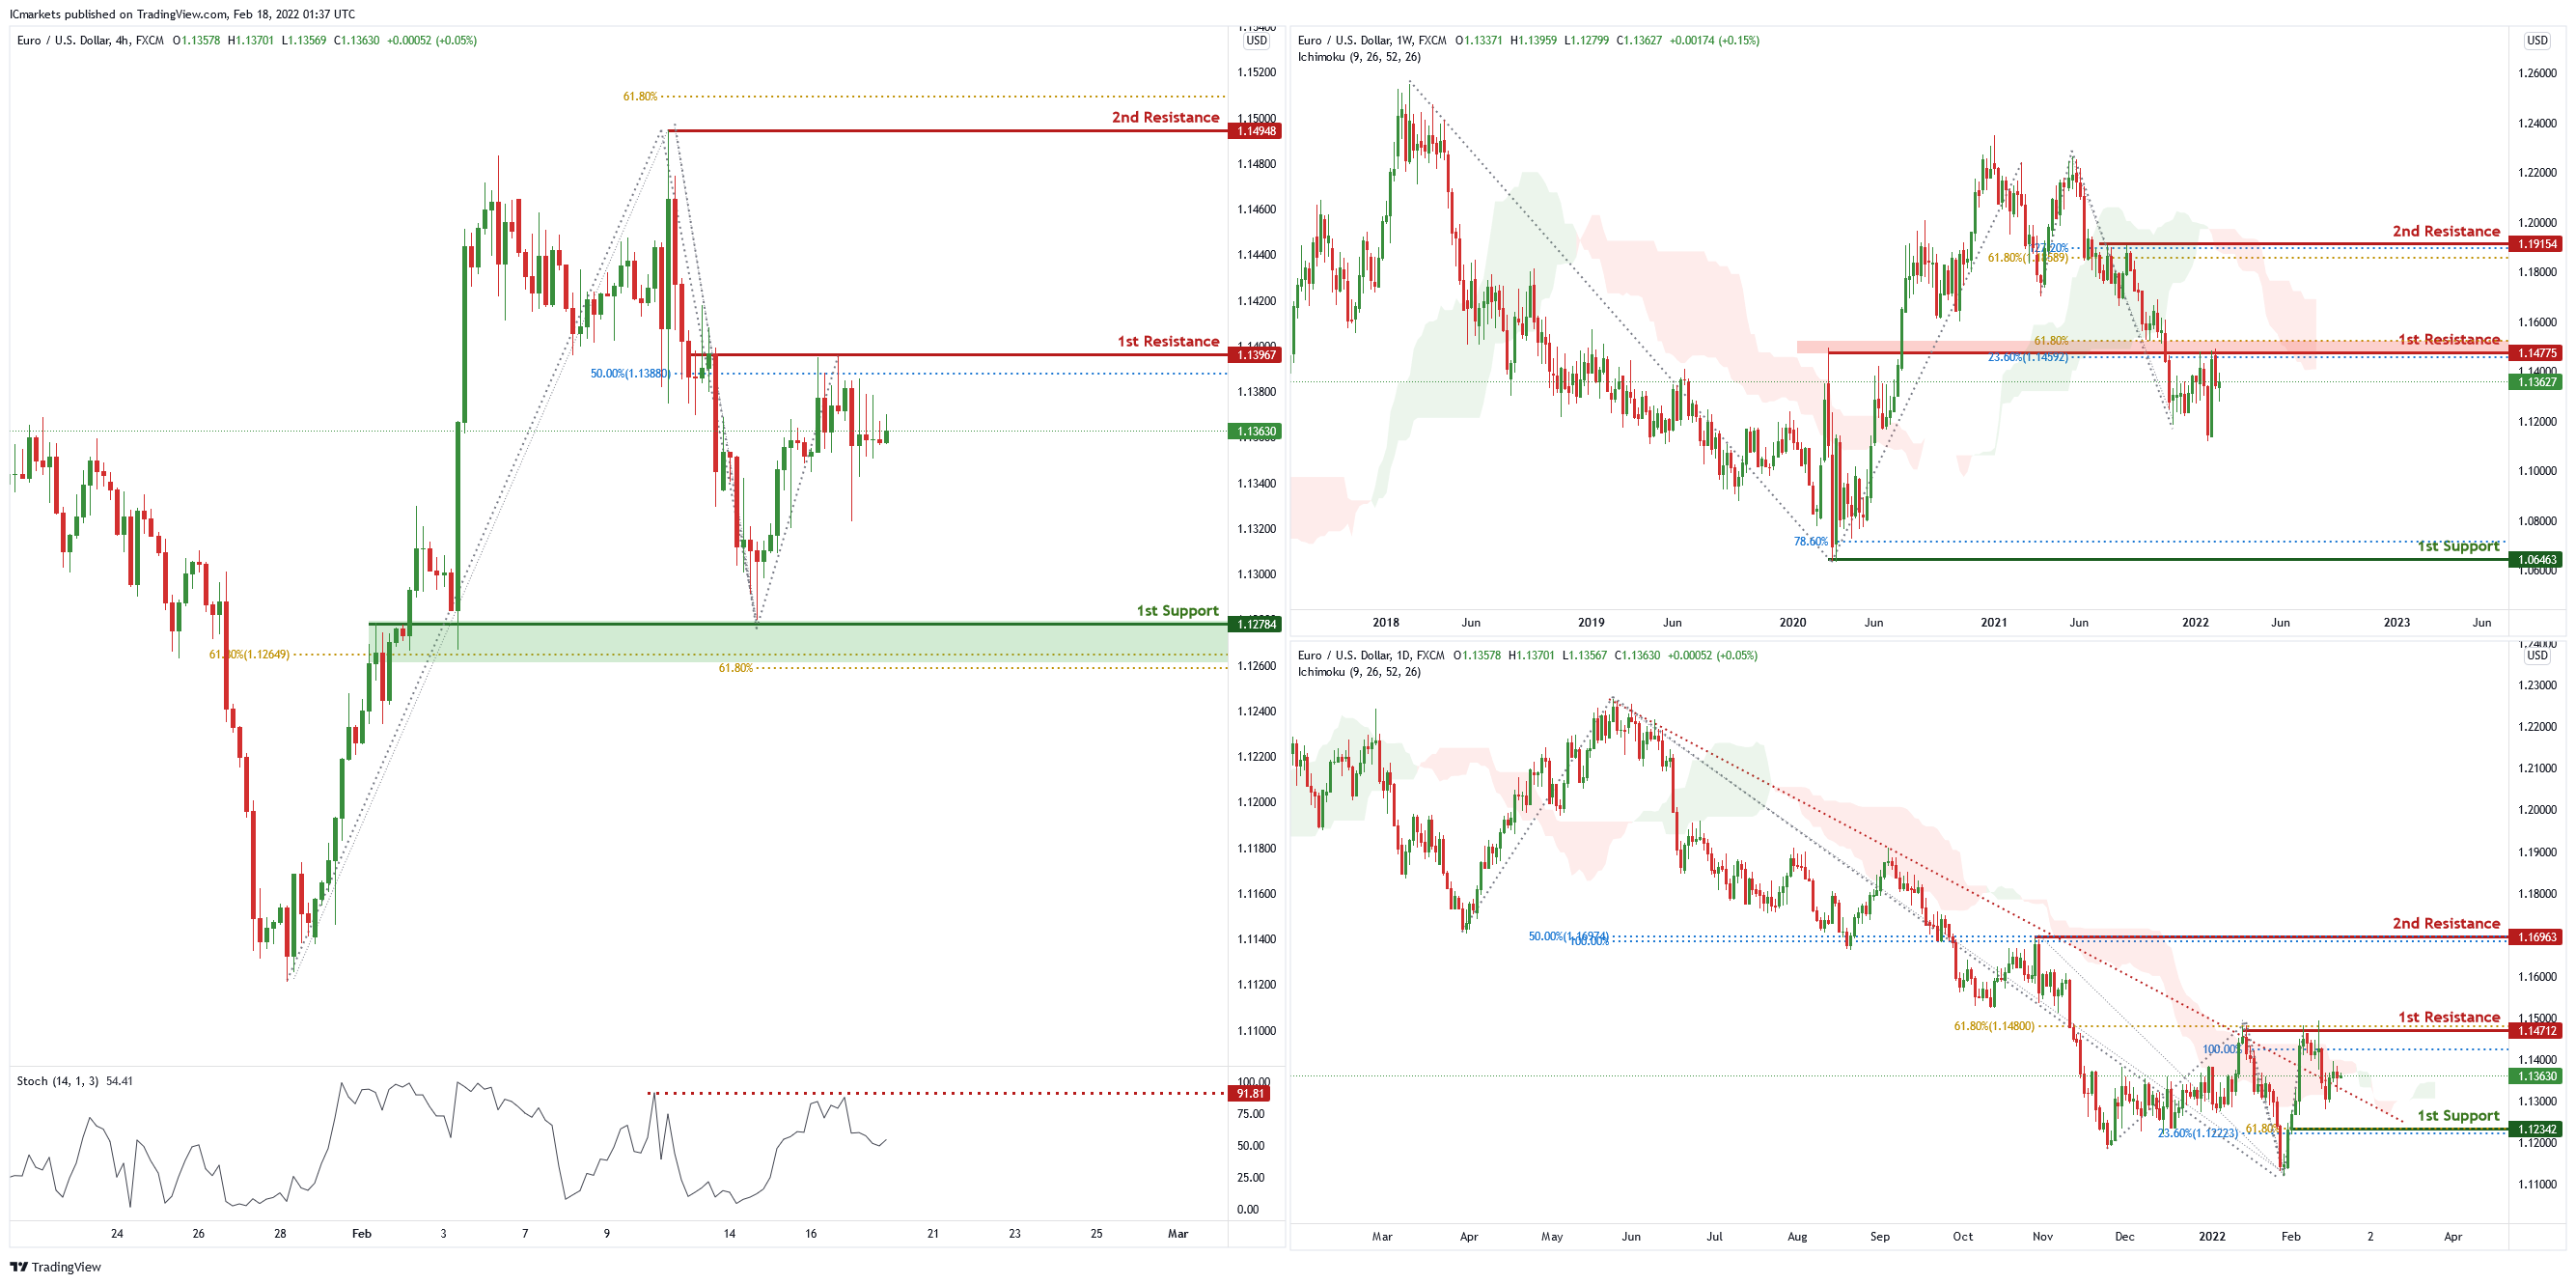
EUR/USD :
On the weekly chart, price is near 1st resistance level of 1.14226 which is also 61.8% Fibonacci projection and 23.6% Fibonacci retracement. Price can potentially dip to the 1st support level of 1.06475 which is 78.6% Fibonacci projection. Our bearish bias is supported by the ichimoku cloud indicator as price is trading below it.
On the daily chart, price has broken out of the descending trendline and is near 1st resistance level of 1.14666 which is also 100% Fibonacci projection and 61.8% Fibonacci retracement. Price can potentially go to the 2nd resistance level of 1.16931 which is 50% retracement and 100% projection. Our bullish bias is supported by the ichimoku cloud indicator as price is trading above the cloud.
On the H4 chart, price is near 1st resistance level of 1.13967 in line with 50% Fibonacci retracement. Price can potentially dip to the 1st support level of 1.12784 in line with 61.8% Fibonacci retracement and 61.8% Fibonacci projection. Our bearish bias is supported by the stochastic indicator as it is near the resistance level.
Areas of consideration
- H4 1st resistance at 1.13967
- H4 1st support at 1.12784
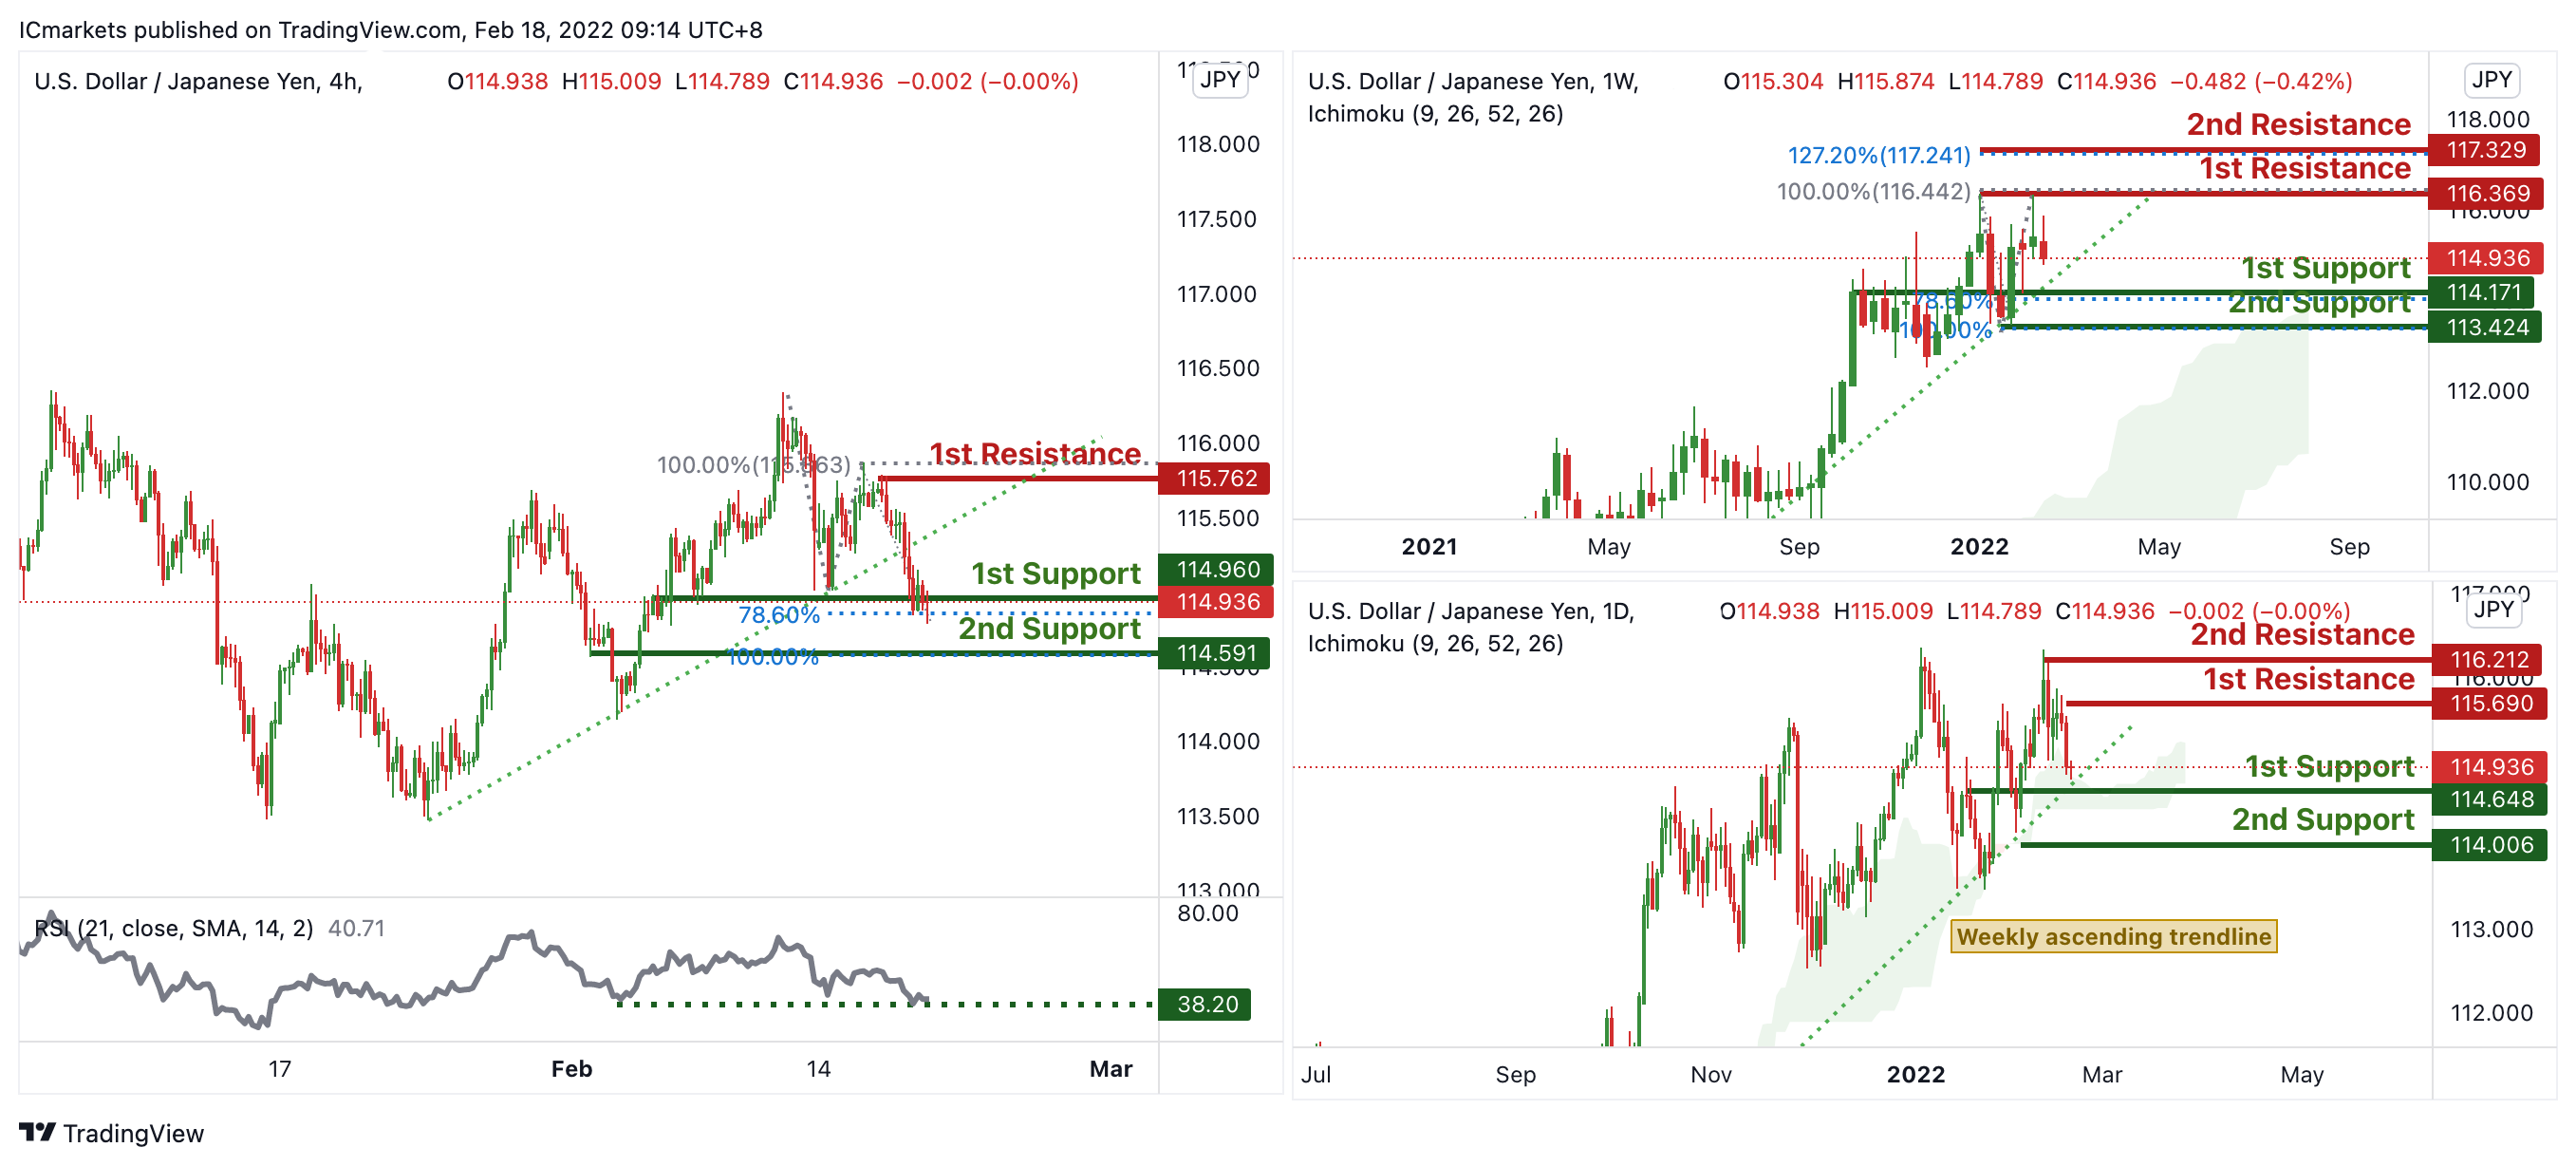
USD/JPY:
On the weekly, prices are on bullish momentum and abiding to our ascending trendline. We see potential for prices to bounce from our 1st support at 114.171 in line with 78.6% Fibonacci extension towards our 1st resistance at 116.369 in line with 100% Fibonacci retracement. Prices are trading above our Ichimoku Cloud support, further supporting our bullish bias.
On the daily, prices are on a bullish momentum and abiding to a bullish trendline. We see potential for prices to bounce from our 1st support at 114.648 in line with 61.8% Fibonacci retracement towards our 1st resistance at 115.690 in line with 61.8% Fibonacci retracement. Prices are trading above our Ichimoku Cloud support, further supporting our bullish bias.
On the H4 timeframe, prices have recently broken out of our ascending trendline. We see the possibility of a retest of the ascending trendline from our 1st support at 114.960 in line with 78.6% Fibonacci extension towards our 1st resistance at 115.762 in line with 100% Fibonacci retracement. Our bullish bias is further supported by RSI being at levels where bounces previously occurred.
Areas of consideration:
- H4 time frame, 1st resistance at 115.762
- H4 time frame, 1st support at 115.762
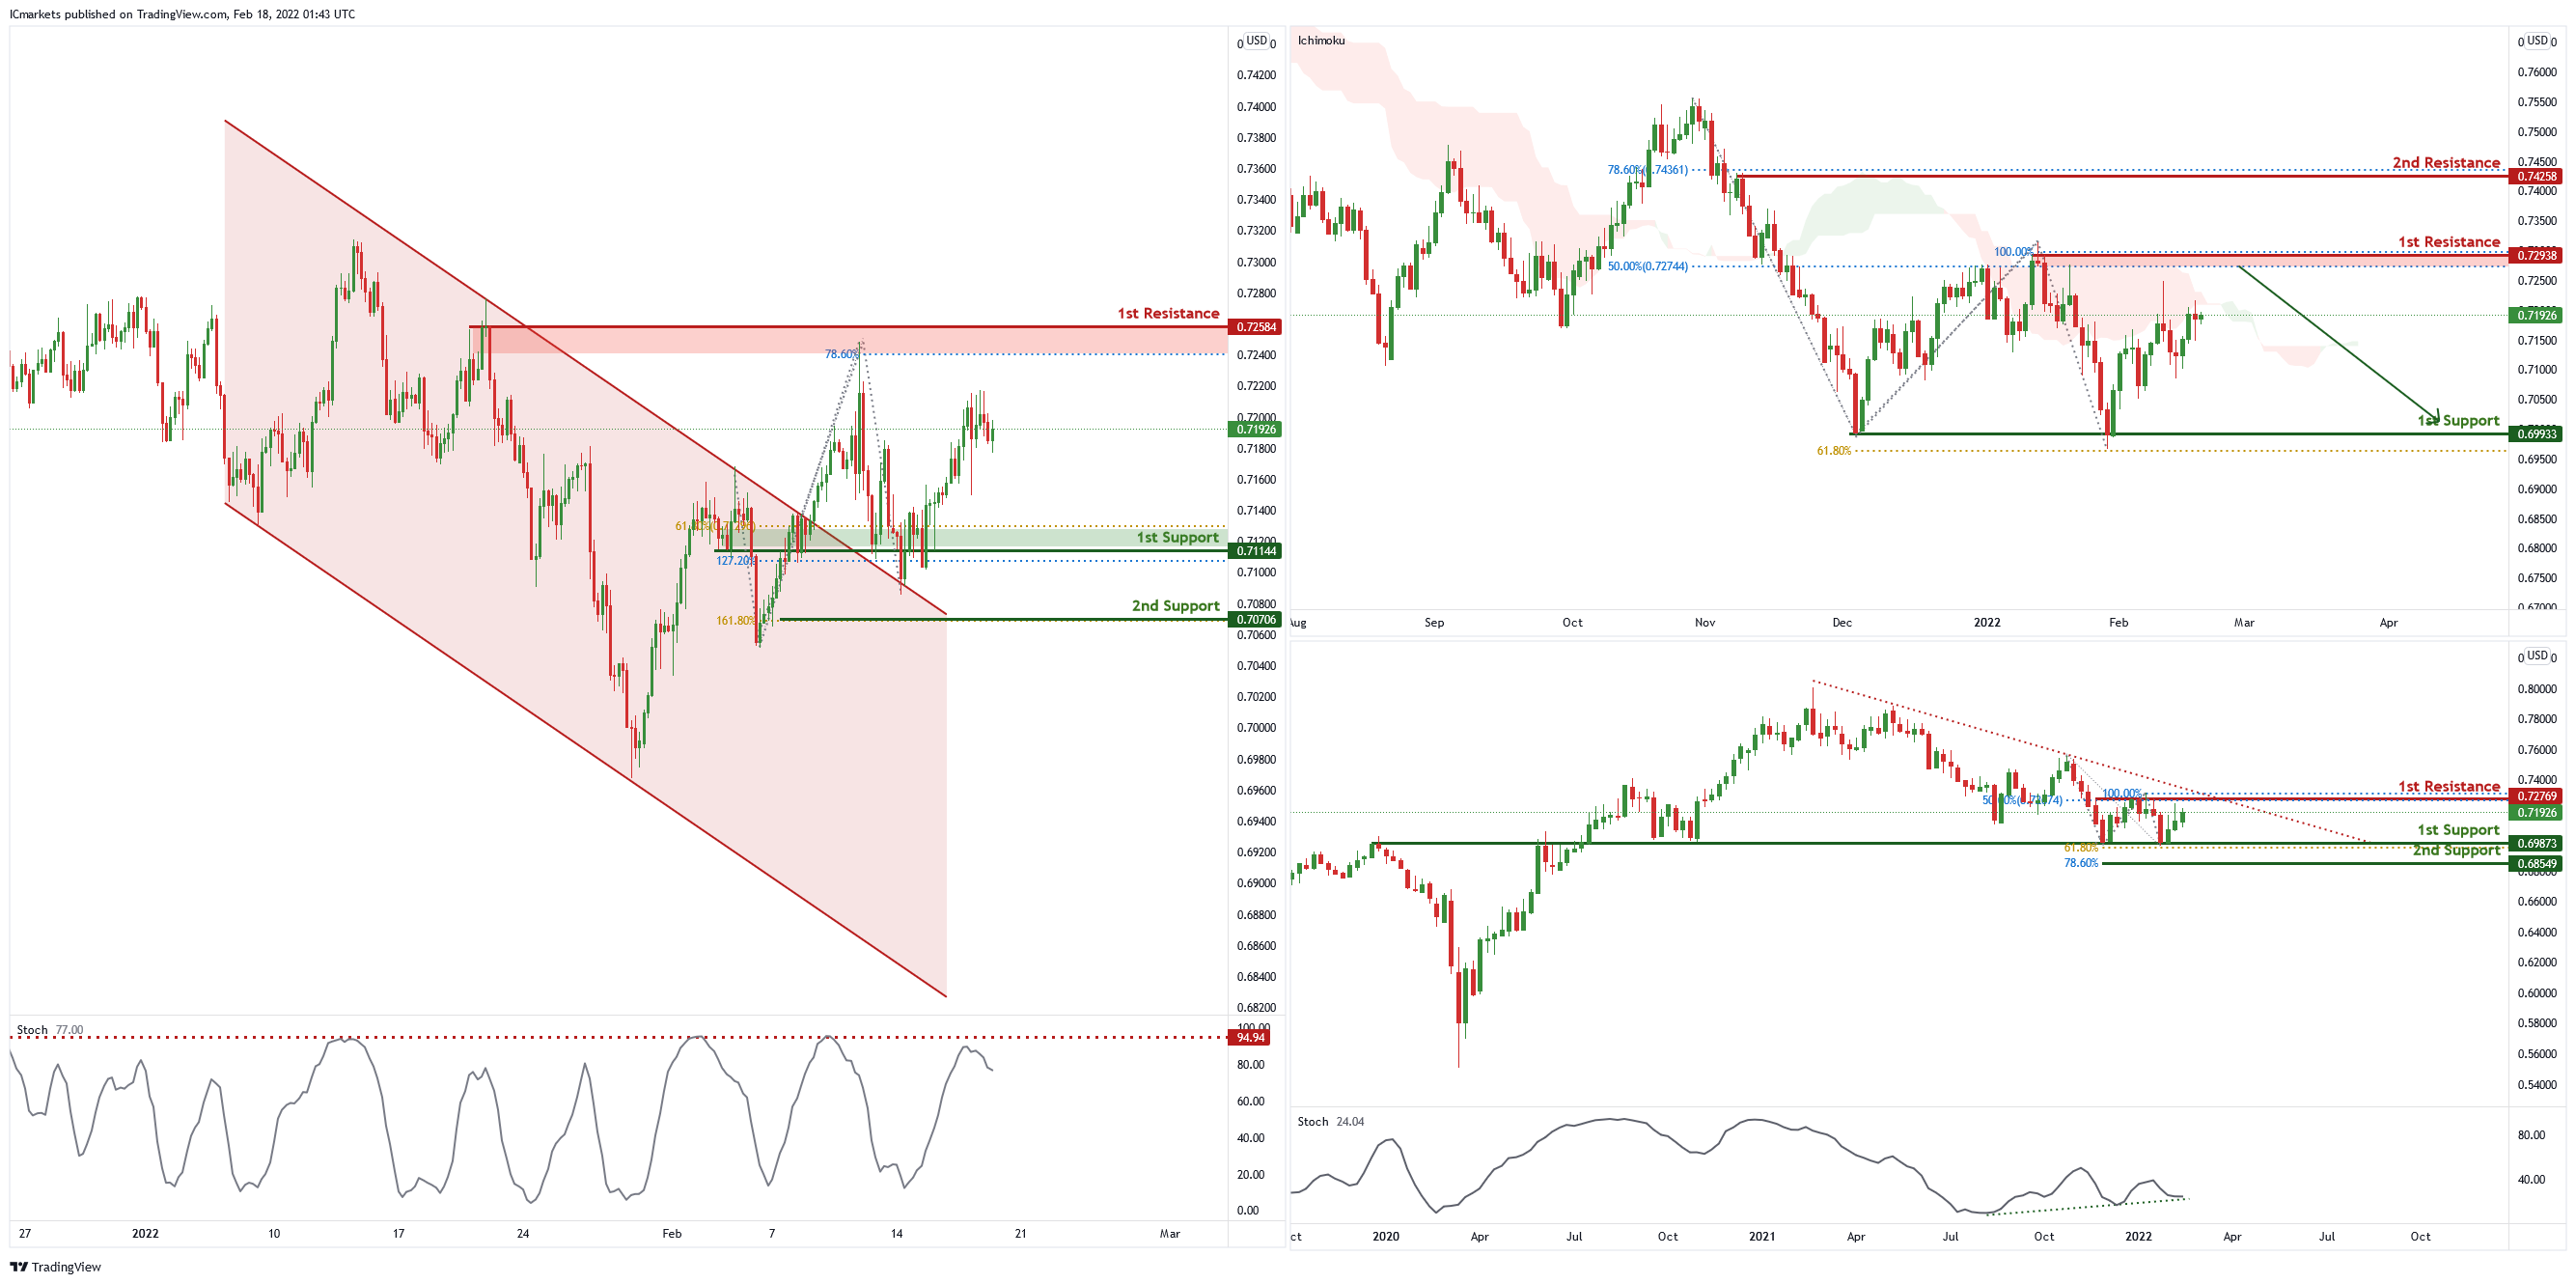
AUD/USD:
On the weekly, price is abiding to the descending trendline resistance , signifying an overall bearish momentum. However, the price bounced up at the horizontal support. We can expect price to reach 1st Resistance in line with 50% Fibonacci retracement and 100% Fibonacci projection. Traders can wait for prices to swing higher or lower before entering.
On the Daily timeframe, price is near the 1st resistance level of 0.72938 in line with 100% Fibonacci projection and 50% Fibonacci retracement. Price can potentially dip to the 1st support level of 0.69933 in line with 100% Fibonacci projection. Our bearish bias is supported by the ichimoku cloud indicator.
Price broke out of the descending channel. Price is near the 1st resistance level of 0.72584 in line with 78.6% Fibonacci projection. Price can potentially dip to the 1st support level of 0.71144 in line with 127.2% Fibonacci projection and 61.8% Fibonacci retracement. Our bearish bias is supported by the stochastic indicator as it is near resistance level.
Areas of consideration :
- H4 1st resistance of 0.72584
- H4 1st support of 0.71144
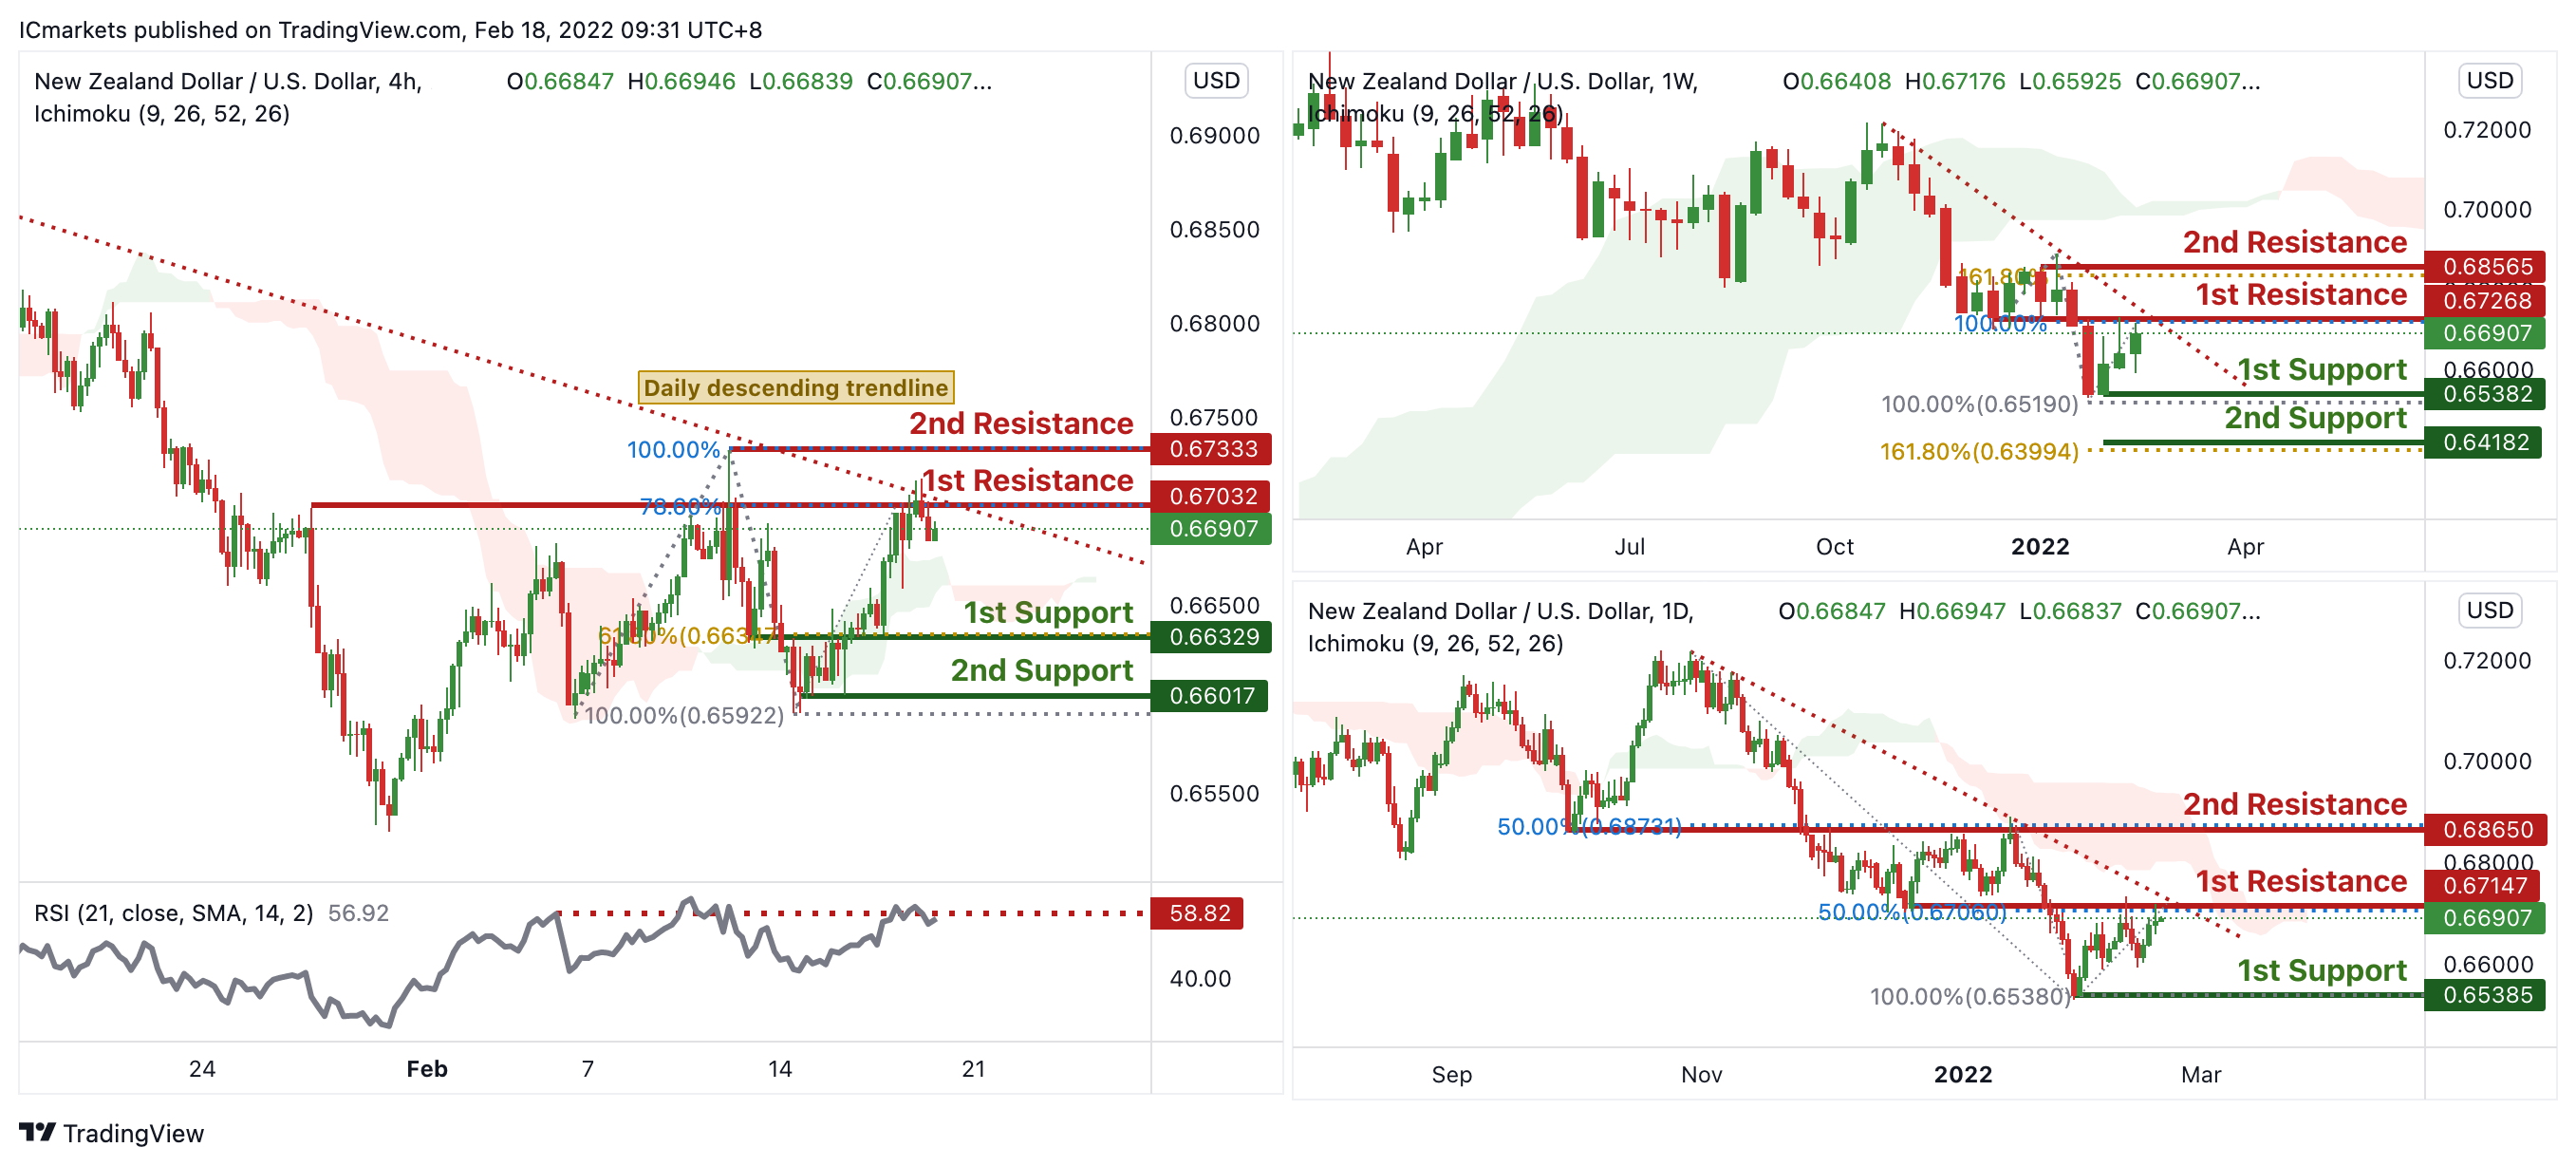
NZD/USD:
On the weekly, prices are on bearish momentum and abiding to a descending trendline. We see potential for a dip from our 1st resistance at 0.67268 in line with 100% Fibonacci extension and descending trendline towards 1st support at 0.65382 in line with 100% Fibonacci retracement. Prices are trading below our ichimoku cloud resistance, further supporting our bearish bias.
On the daily, prices are on bearish momentum and abiding to a descending trendline. We see potential for a dip from our 1st resistance at 0.67147 in line with 50% Fibonacci retracement and descending trendline towards 1st support at 0.65385 in line with 100% Fibonacci retracement. Prices are trading below our ichimoku cloud resistance, further supporting our bearish bias.
On the H4 timeframe, prices are on bearish momentum and abiding to a daily descending trendline. We see potential for a dip from our 1st resistance at 0.67032 in line with 78.6% Fibonacci extension and descending trendline towards 1st support at 0.66329 in line with 61.8% Fibonacci retracement. Ichimoku clouds are forecasting bearish momentum and also RSI are at levels where dips previously occurred, further supporting our bearish bias.
Areas of consideration:
- H4 time frame, 1st resistance at 0.67032
- H4 time frame, 1st support at 0.66329
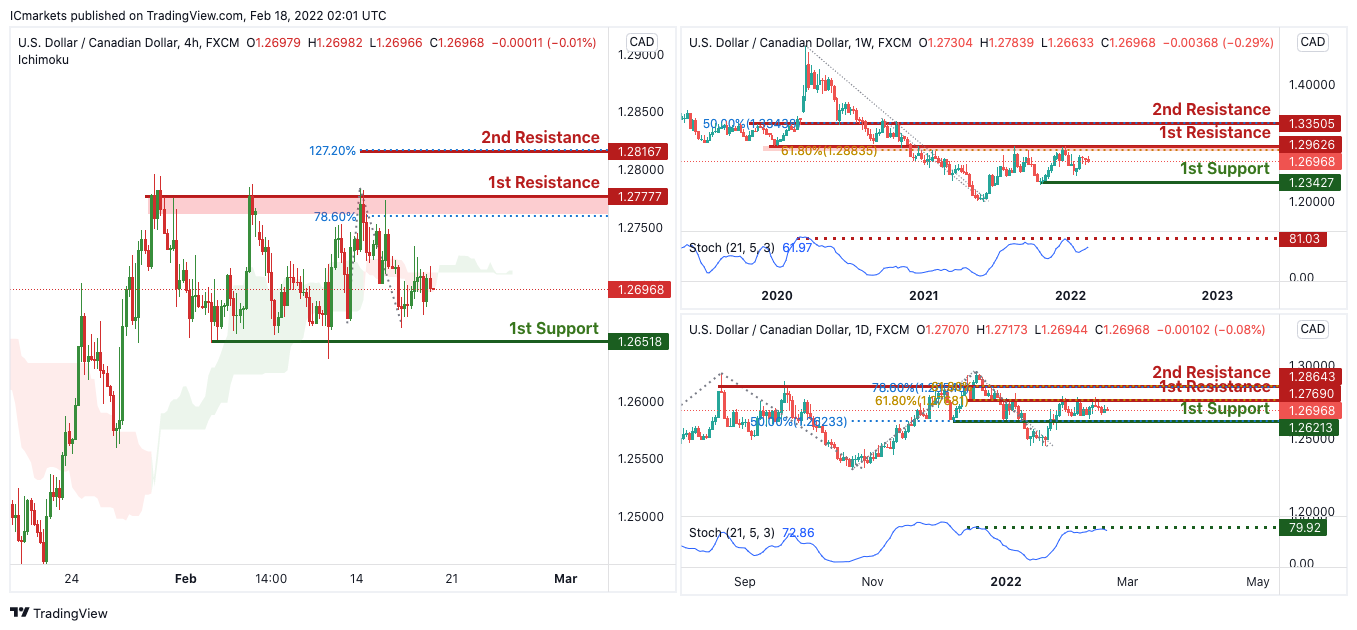
USD/CAD:
On the Weekly, with price moving expected to bounce off the stochastics, we can expect price to drop from our 1st resistance at 1.29626 in line horizontal graphical overlap resistance to our 1st support in line with horizontal overlap support at 1.23427. Alternatively, price may break 1st resistance structure and head for 2nd resistance, which coincides with horizontal swing high resistance at 1.33505.
On the Daily, with price moving expected to bounce off the stochastics, we can expect price to drop from our 1st resistance at 1.297690 in line horizontal graphical swing high resistance to our 1st support in line with horizontal overlap support and 50% Fibonacci retracement at 1.26218. Alternatively, price may break 1st resistance structure and head for 2nd resistance, which coincides with horizontal swing high resistance at 1.28643.
On the H4, with price moving below the ichimoku cloud, we can expect price to drop from our 1st resistance at 1.277777 in line horizontal graphical swing high resistance to our 1st support in line with horizontal overlap support and 78.6% Fibonacci retracement at 1.26518. Alternatively, price may break 1st resistance structure and head for 2nd resistance, which coincides with horizontal swing high resistance at 1.28167.
Areas of consideration:
- H4 time frame, 1st support at 1.26518
- H4 time frame, 1st resistance at 1.277777
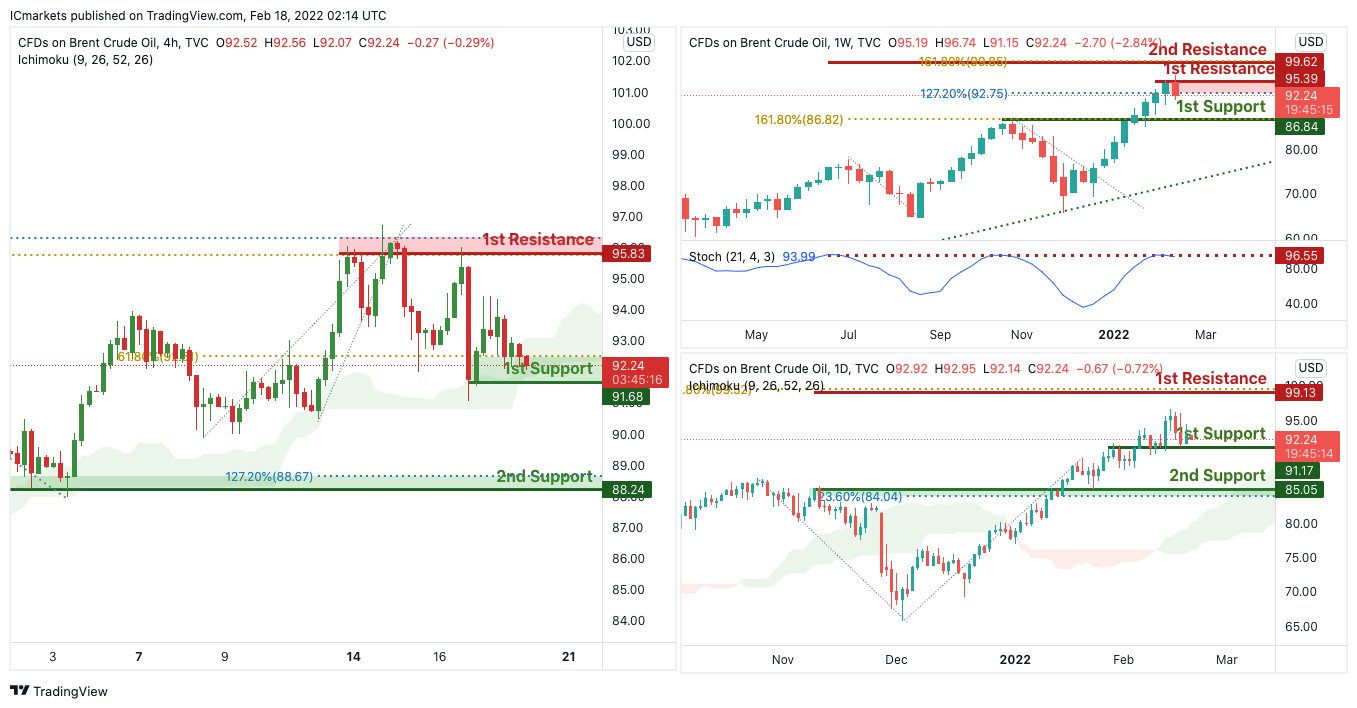
OIL:
On the Weekly, with price expected to reverse off the stochastics, we can expect price to drop from our 1st resistance at 95.39 in line horizontal graphical swing high resistance to our 1st support in line with horizontal overlap support and 127.2% Fibonacci extension at 86.84. Alternatively, price may break 1st resistance structure and head for 2nd resistance, which coincides with 161.8% Fibonacci extension at 99.62.
On the Daily, with price moving above of the ichimoku cloud, signifying an overall bullish momentum. We can expect price to rise to our 1st resistance at 99.13 in line horizontal graphical swing high resistance and 61.8% Fibonacci retracement level from our 1st support in line with horizontal overlap support at 91.17. Alternatively, price may break 1st support structure and head for 2nd support, which coincides with horizontal swing low support and 23.6% Fibonacci retracement at 85.05.
On the H4, with price expected to bounce off the support of the ichimoku cloud, signifying an overall bullish momentum. We can expect price to rise to our 1st resistance at 95.83 in line horizontal graphical swing high resistance and -61.8% Fibonacci expansion and 127.2% Fibonacci extension level from our 1st support in line with horizontal overlap support and 61.8% Fibonacci retracement at 91.68. Alternatively, price may break 1st support structure and head for 2nd support, which coincides with horizontal swing low support and 127.2% Fibonacci extension at 88.24.
Areas of consideration:
- H4 time frame, 1st resistance of 95.83
- H4 time frame, 1st support of 91.68
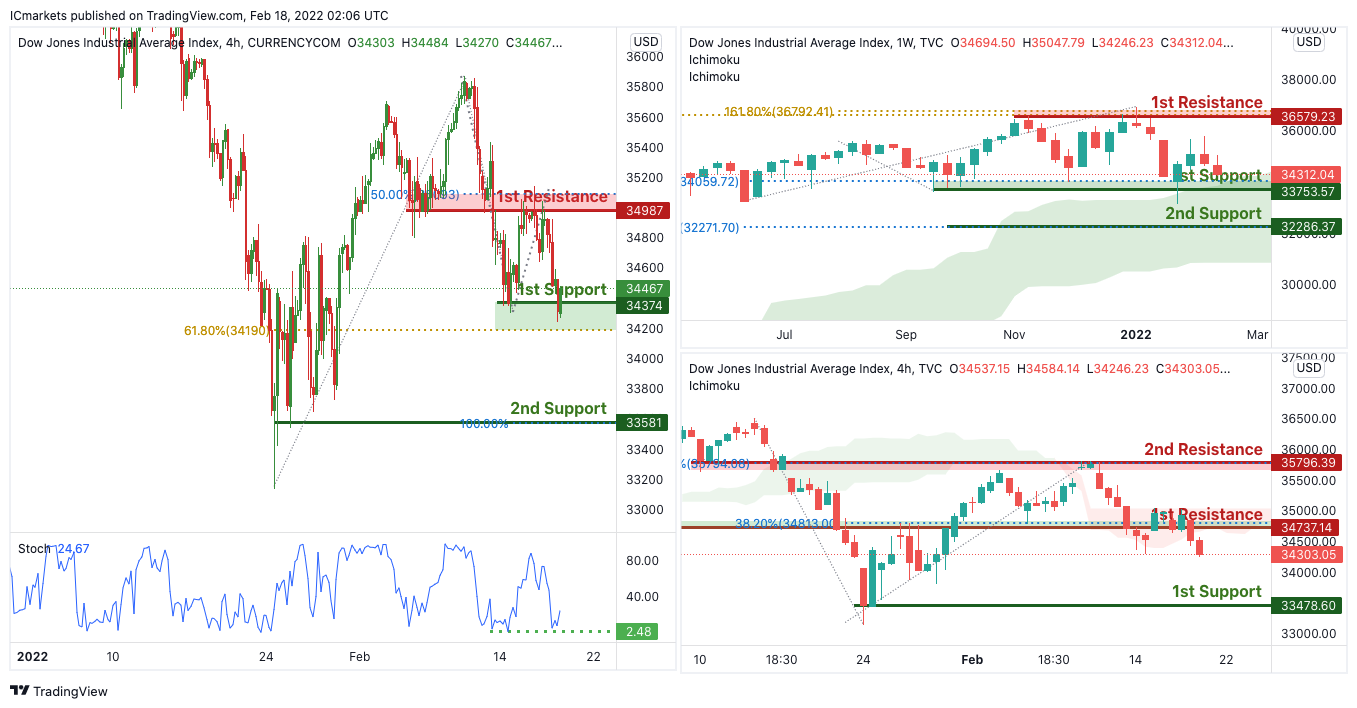
Dow Jones Industrial Average:
On the Weekly, with price expected to bounce off the support of the ichimoku cloud, signifying an overall bullish momentum. We can expect price to rise to our 1st resistance at 36579 in line horizontal graphical swing high resistance and 161.8% Fibonacci extension from our 1st support in line with horizontal overlap support and 78.2% Fibonacci retracement at 33753. Alternatively, price may break 1st support structure and head for 2nd support, which coincides with horizontal swing low support and 127.2% Fibonacci extension at 32286.
On the Daily, with prices moving below the ichimoku cloud, we see the potential for a drop to our 1st support at 34374 in line with horizontal swing low support from our 1st resistance at 33478 in line with the swing low support. Alternatively, price may break 1st resistance structure and head for 2nd resistance at 35796, in line with the horizontal overlap resistance and 78.6% Fibonacci retracement.
On the H4, with price expected to bounce off the support of the stochastics, signifying an overall bullish momentum. We can expect price to rise to our 1st resistance at 34987 in line horizontal graphical swing high resistance and 50% Fibonacci retracement from our 1st support in line with horizontal swing low support and 61.8% Fibonacci retracement at 34374. Alternatively, price may break 1st support structure and head for 2nd support, which coincides with horizontal swing low support at 33681.
Areas of consideration:
- H4 time frame, 1st resistance of 34987
- H4 time frame, 1st support of 34374


