
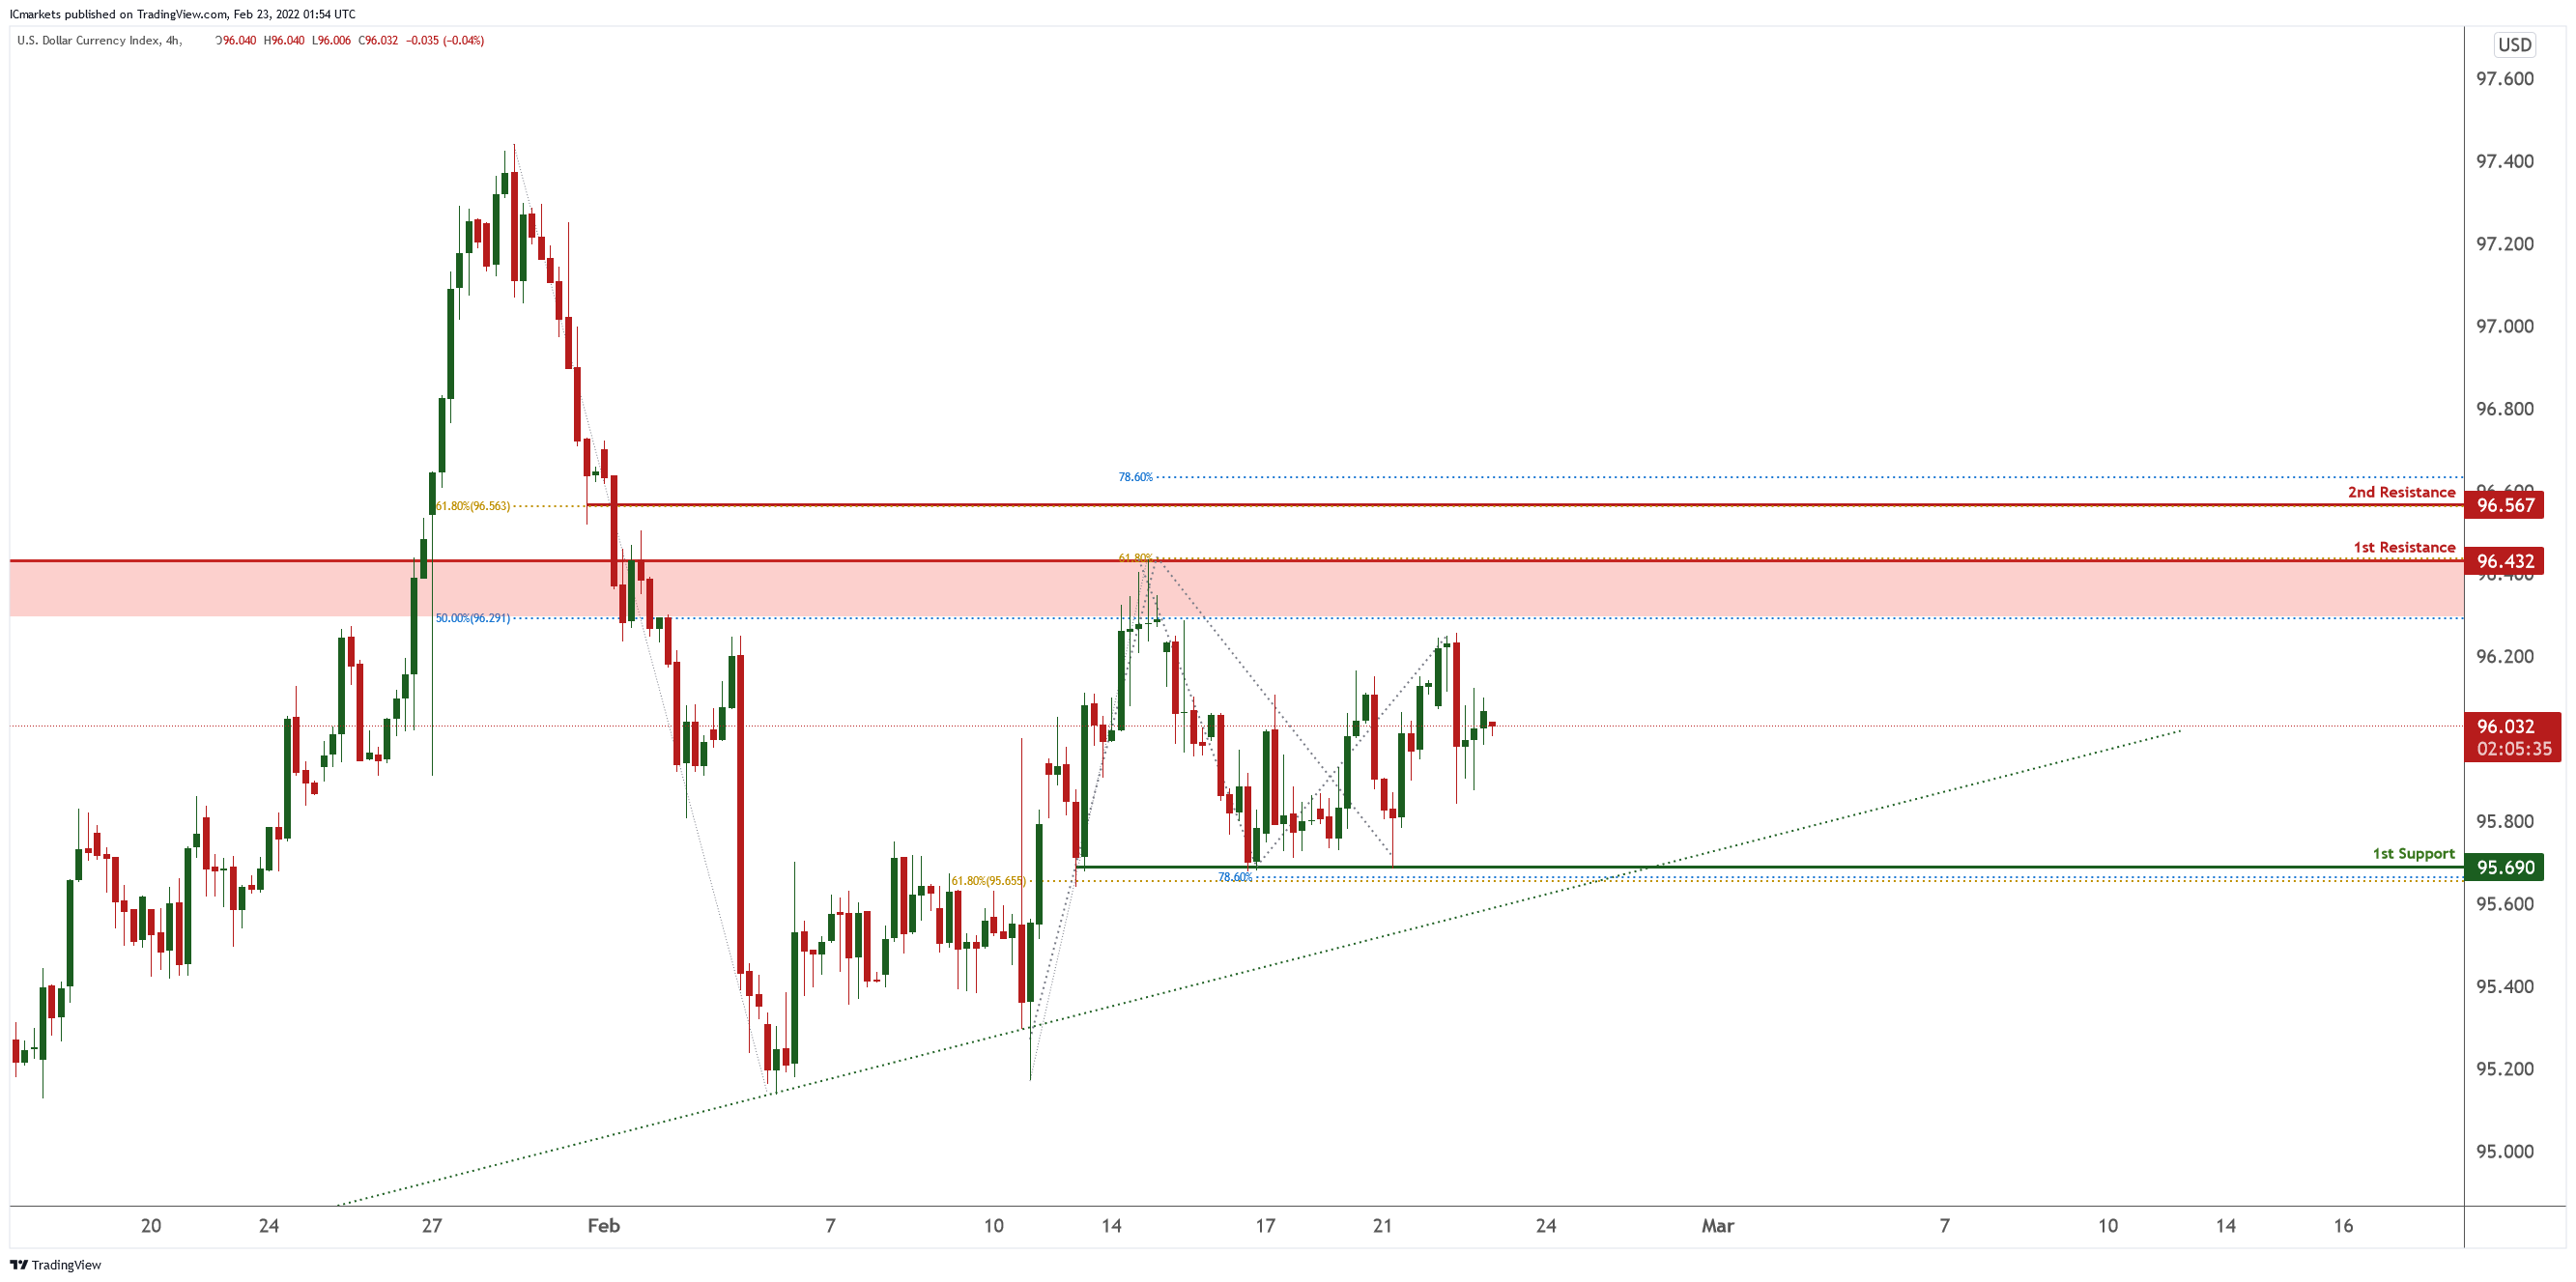
DXY:
On the H4 chart price is abiding by an ascending trendline and between 1st resistance level of 96.432 in line with 61.8% Fibonacci projection, 50% Fibonacci retracement and 1st support level of 95.690 in line with 78.6% Fibonacci projection , 61.8% Fibonacci retracement. Price can potentially dip to 1st support level. Our bearish bias is supported by technical indicators.
Areas of consideration
- H4 1st resistance at 96.432
- H4 1st support at 95.690
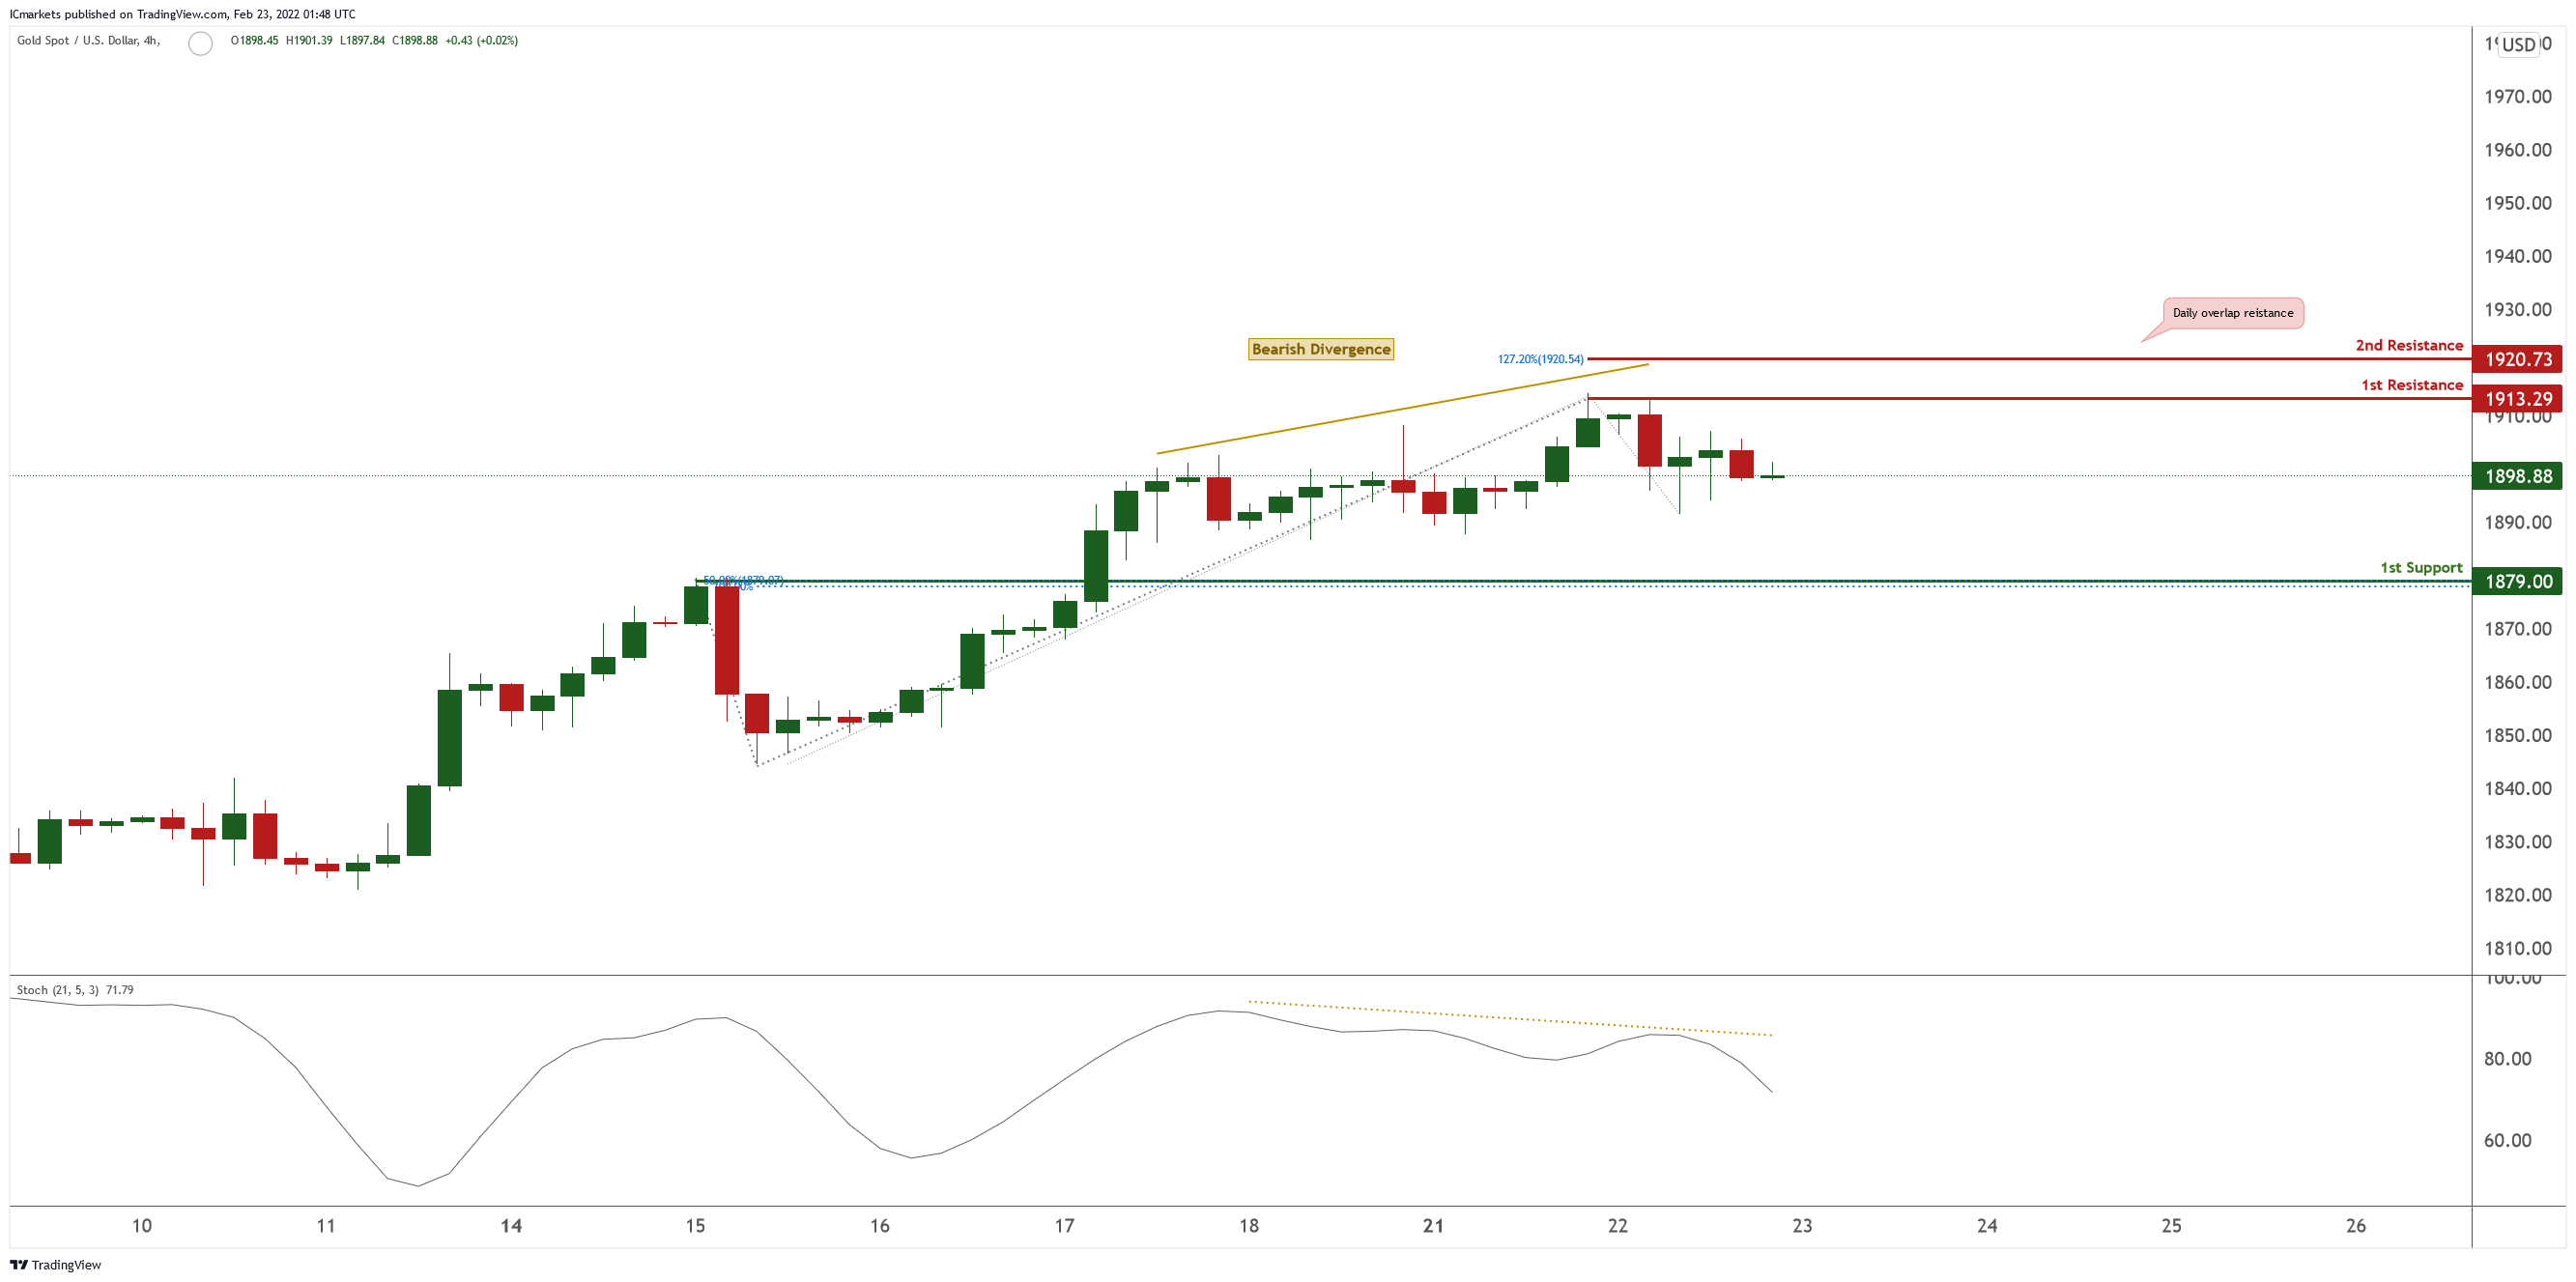
XAU/USD (GOLD):
On the H4 chart price near 1st resistance level of 1913.29 in line which is the graphical swing high level. Price can potentially dip to the 1st support level of 1879 in line with 50% Fibonacci retracement and 100% Fibonacci projection. Our bearish bias is supported by the stochastic indicator as it shows a bearish divergence.
Areas of consideration
- H4 1st resistance at 1913.14
- H4 1st support at 1879
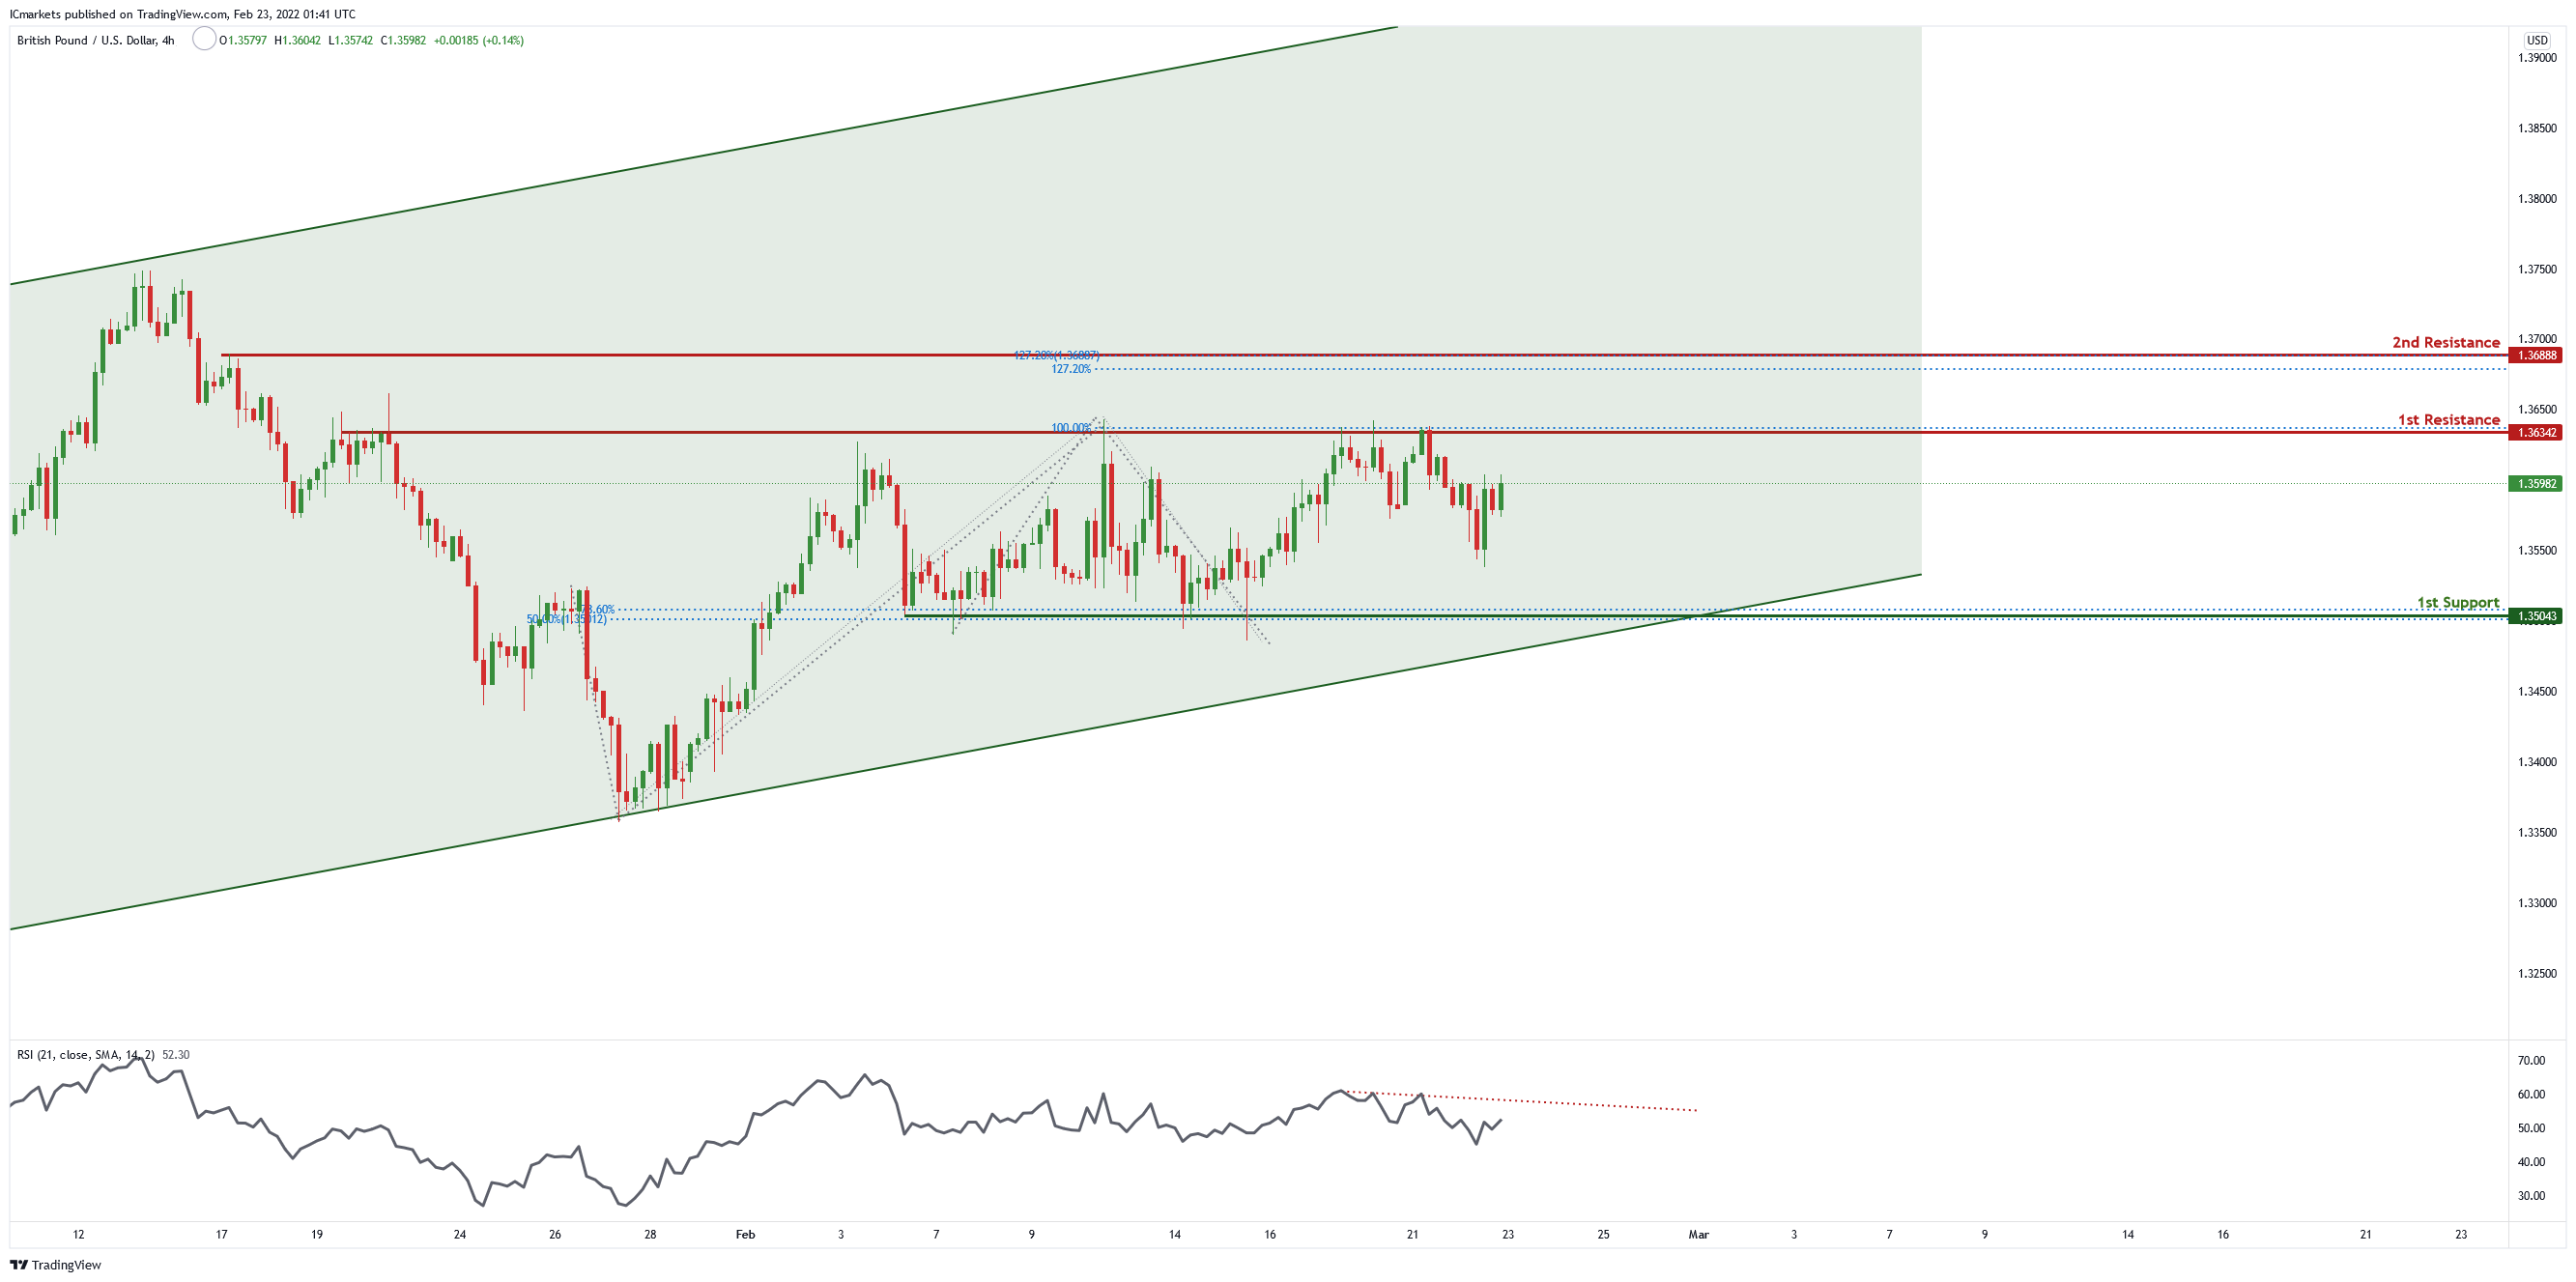
GBP/USD
On the H4 chart , price is near 1st resistance level of 1.36342 in line with 61.8% Fibonacci retracement and 100% Fibonacci projection. Price can potentially dip to the take profit level of 1.35043 in line with 50% Fibonacci retracement and 78.6% Fibonacci projection . Our bearish bias is supported by the RSI indicator as it is abiding by a descending trendline
Areas of consideration
- H4 1st resistance at 1.36342
- H4 1st support at 1.35043
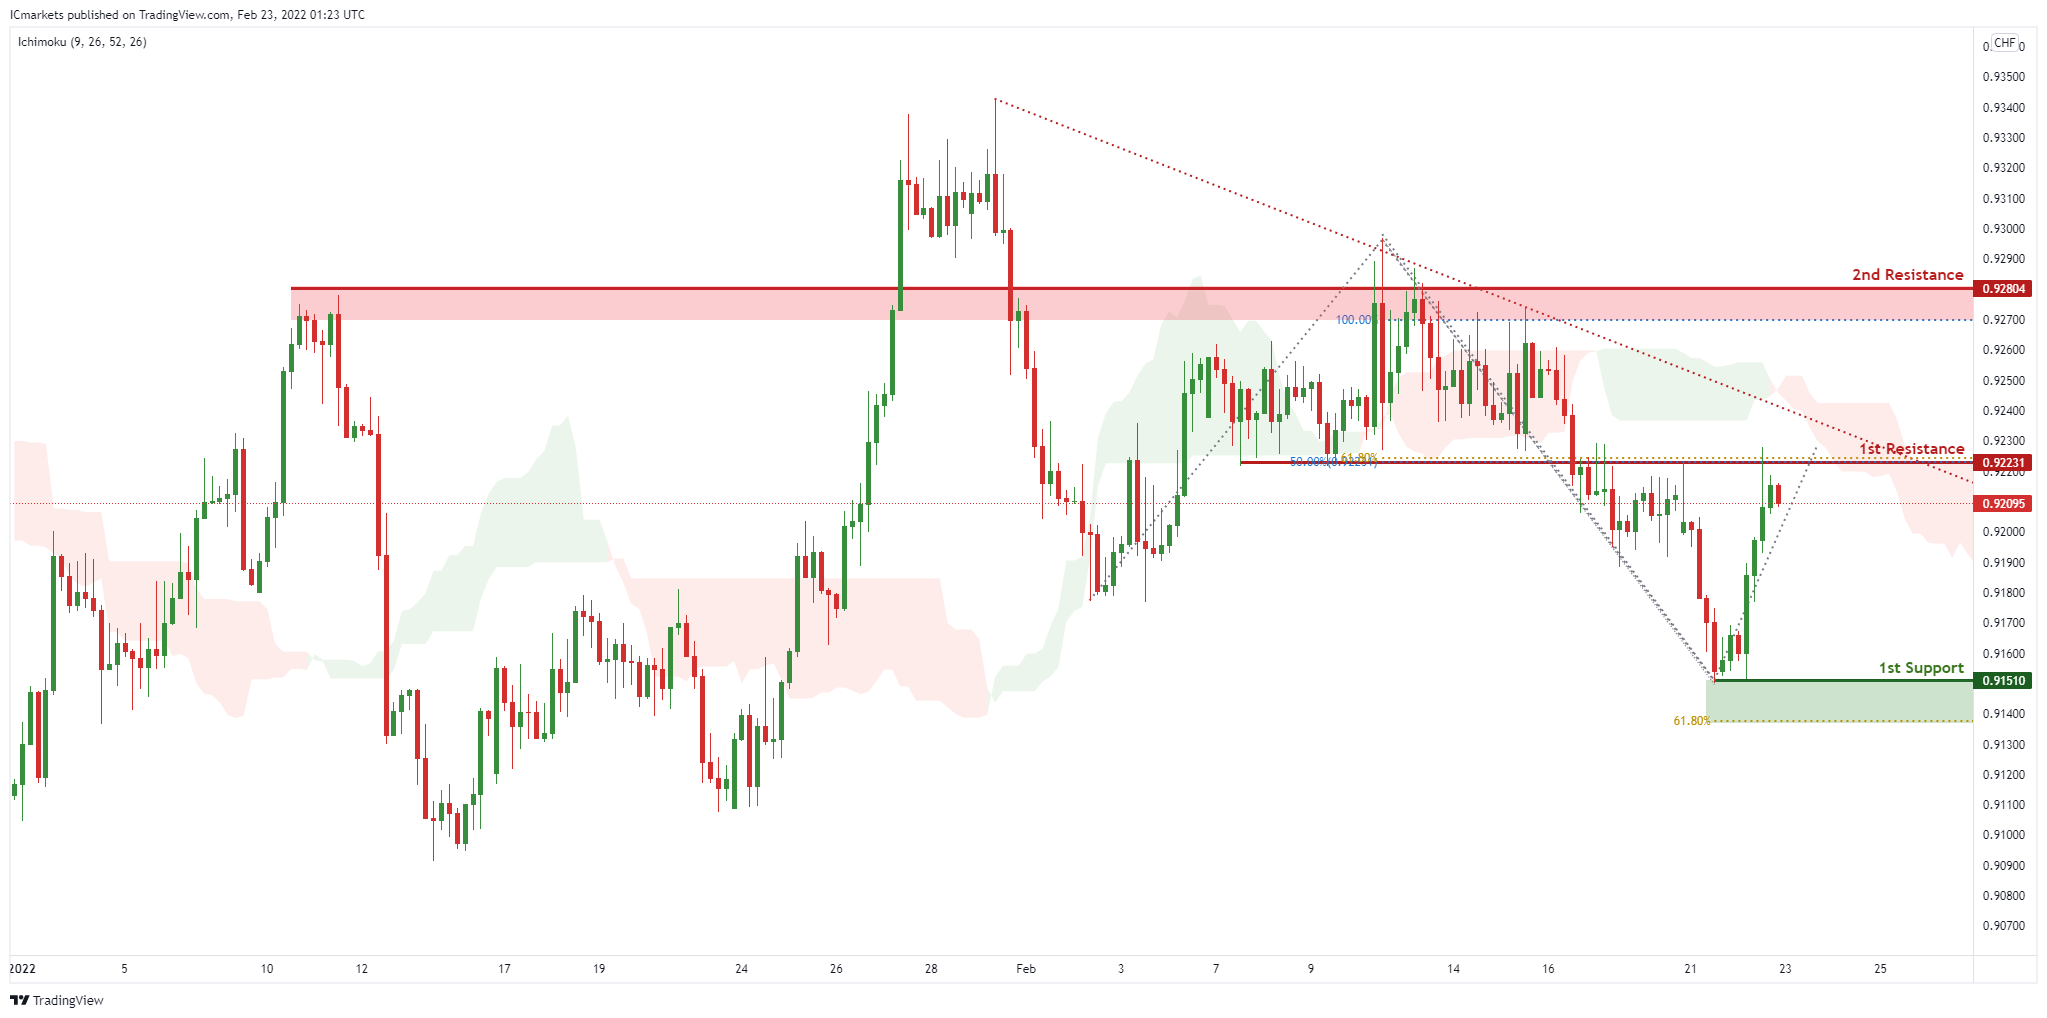
USD/CHF:
On the H4 timeframe, prices are on bearish momentum and abiding to our descending trendline. We see the possibility of bearish continuation from our 1st resistance at 0.92231 in line with 50% Fibonacci retracement towards our 1st support at 0.91510 in line which is an area of Fibonacci confluences. Our bearish bias is further supported by prices trading below our Ichimoku clouds and the descending trend line.
Areas of consideration :
- H4 1st resistance at 0.92231
- H4 1st support at 0.91510
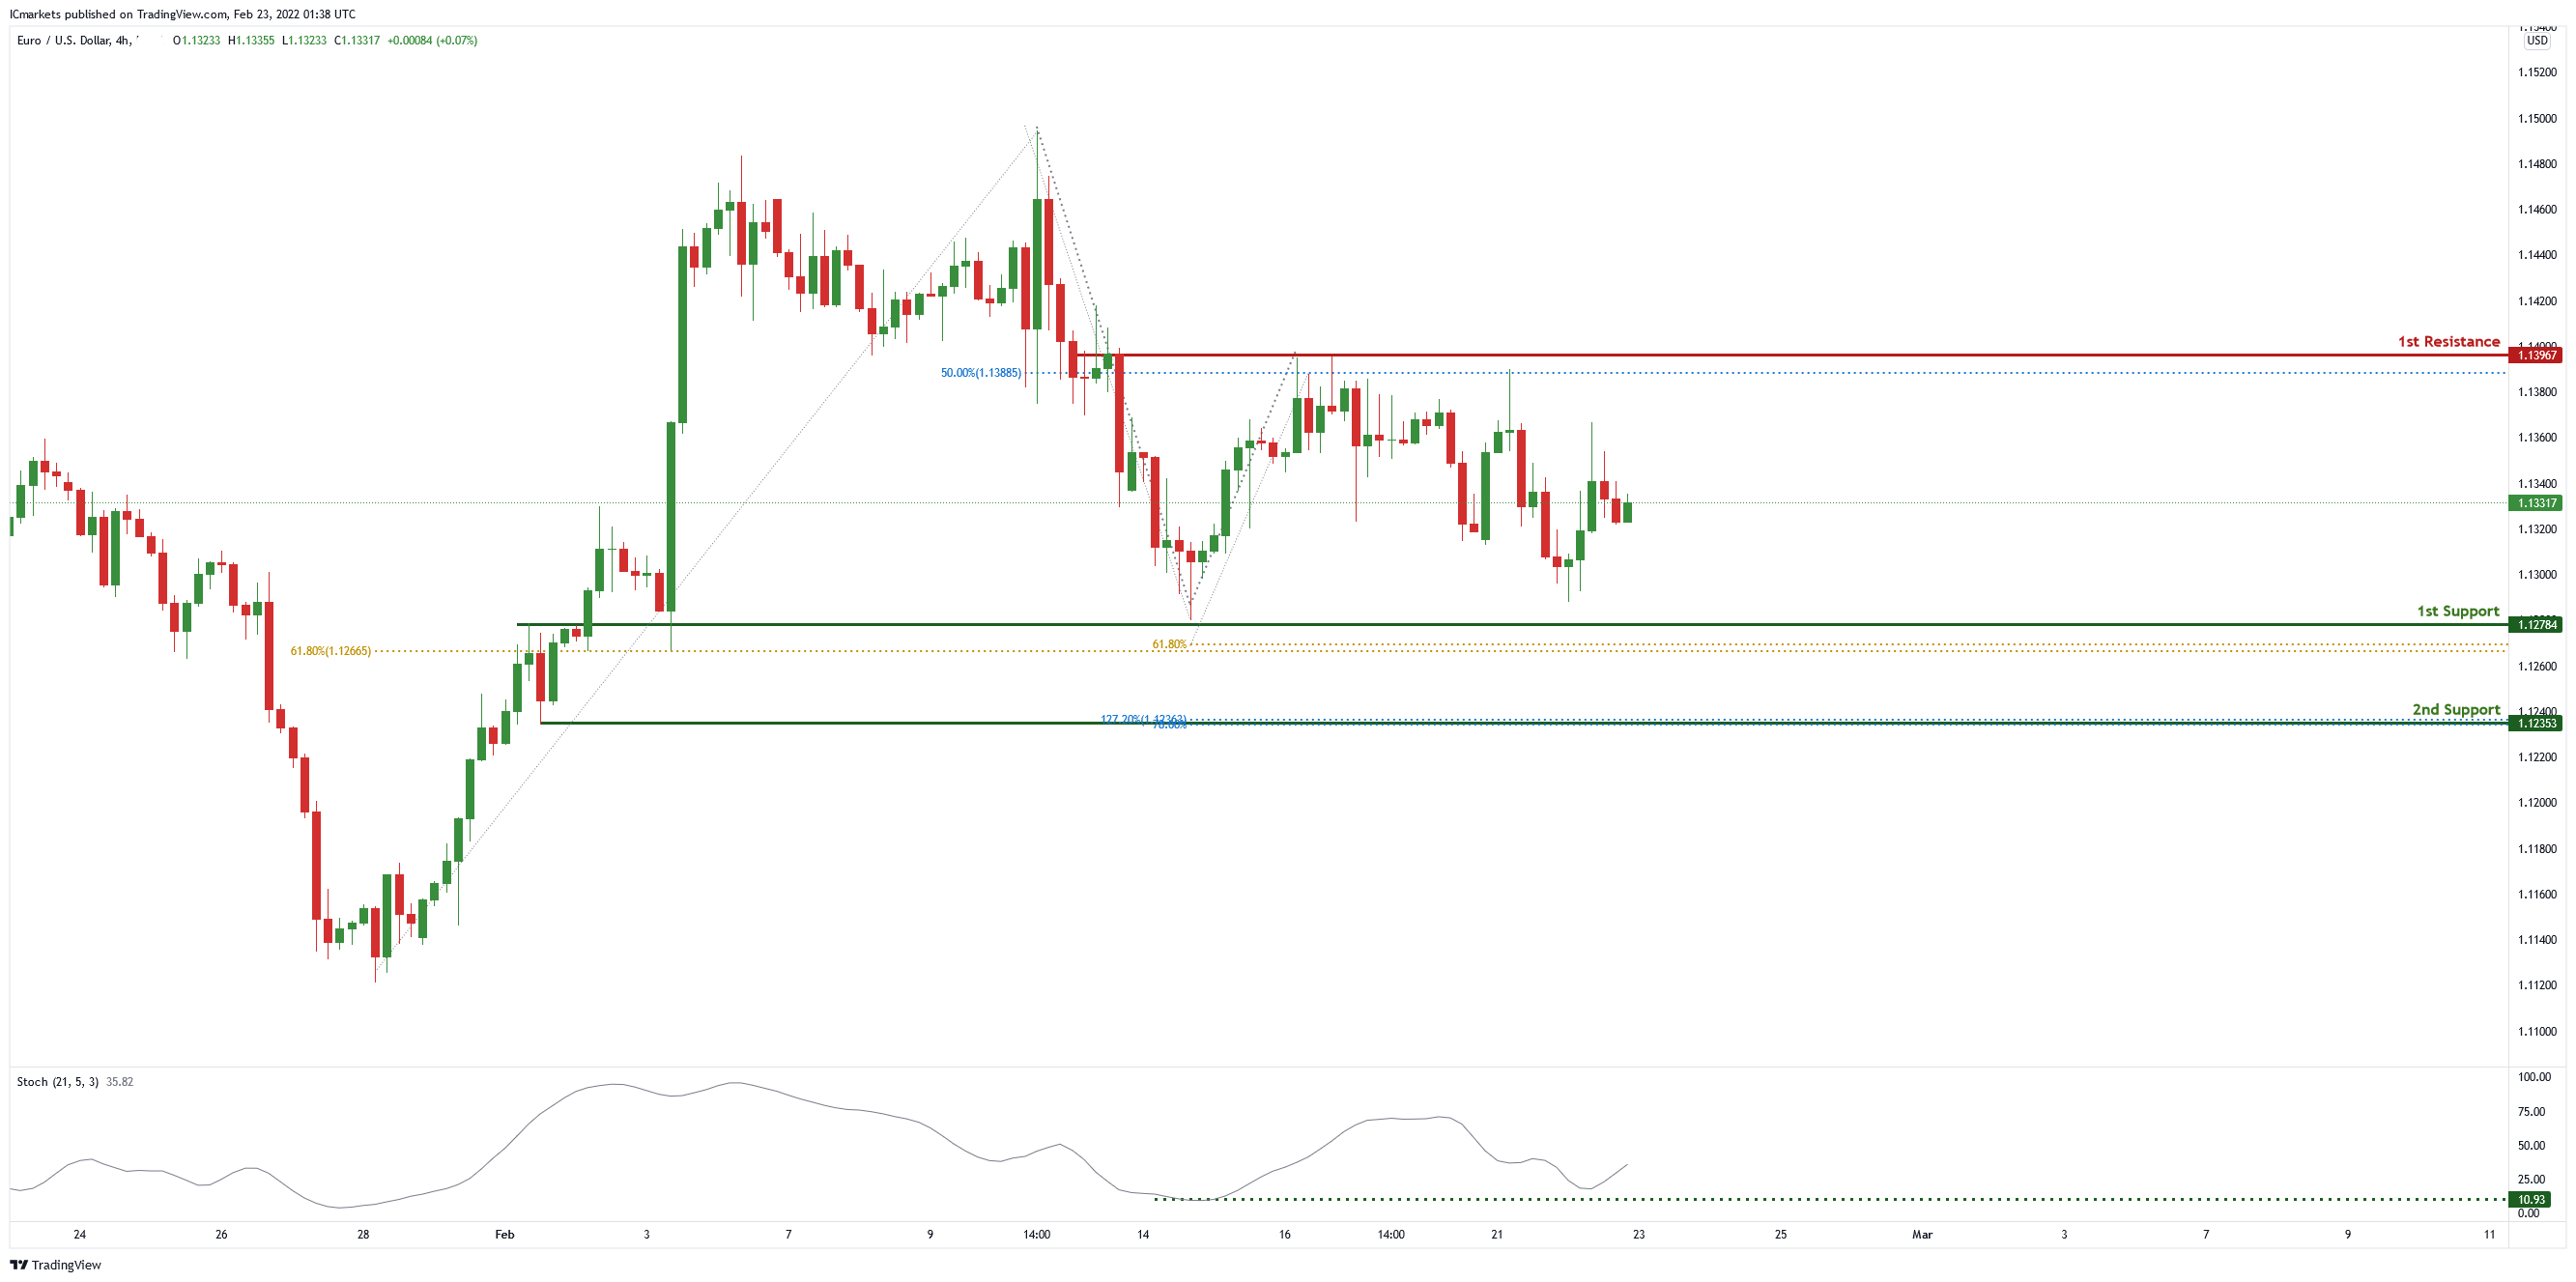
EUR/USD :
On the H4 chart, price is in the middle of 1st resistance of 1.13967 in line with 50% Fibonacci retracement and 1st support of 1.12784 in line with 61.8% Fibonacci retracement and 61.8% Fibonacci projection. Price can potentially bounce from the 1st support to the 1st resistance level. Our bullish bis is supported by the stochastic indicator as it is near support level.
Areas of consideration
- H4 1st support at 1.12784
- H4 1st resistance at 1.13967
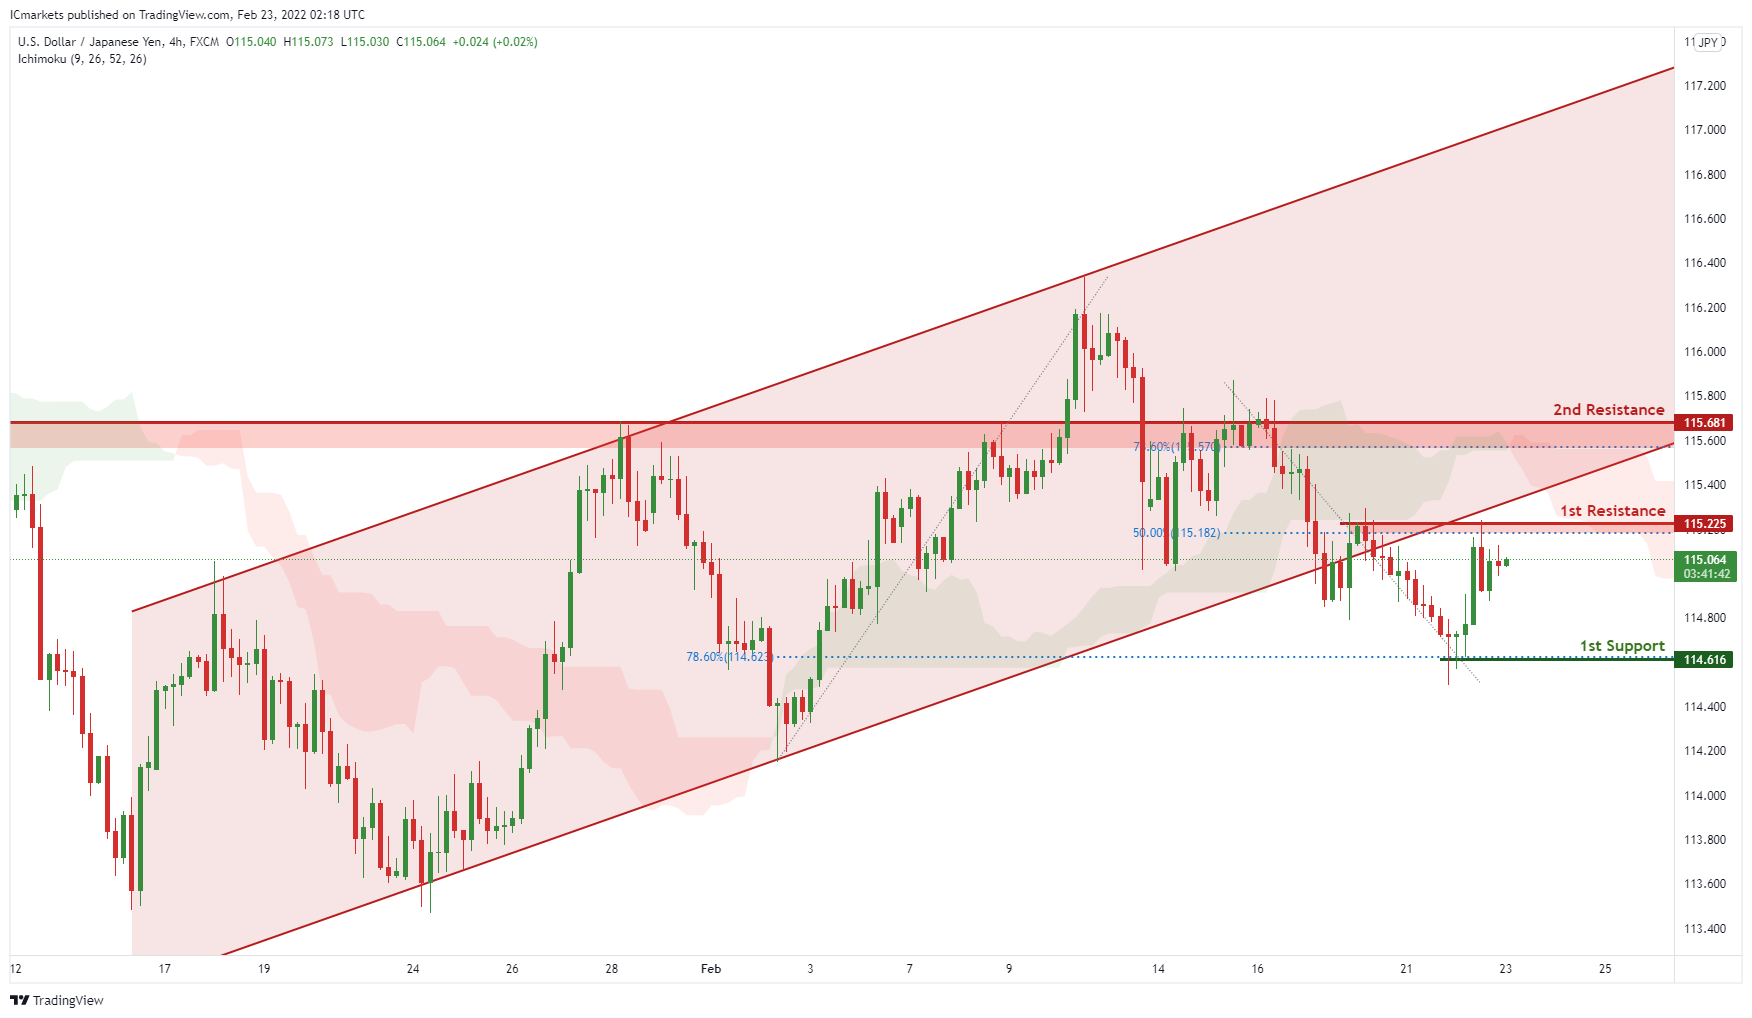
USD/JPY
On the H4 timeframe, prices are on bearish momentum and abiding to our descending trendline. We see the possibility of bearish continuation from our 1st resistance at 115.225 in line with 50% Fibonacci retracement towards our 1st support at 114.616 in line which is an area of Fibonacci confluences. Our bearish bias is further supported by prices trading below our Ichimoku clouds.
Areas of consideration:
- H4 time frame, 1st resistance at 115.225
- H4 time frame, 1st support at 114.616
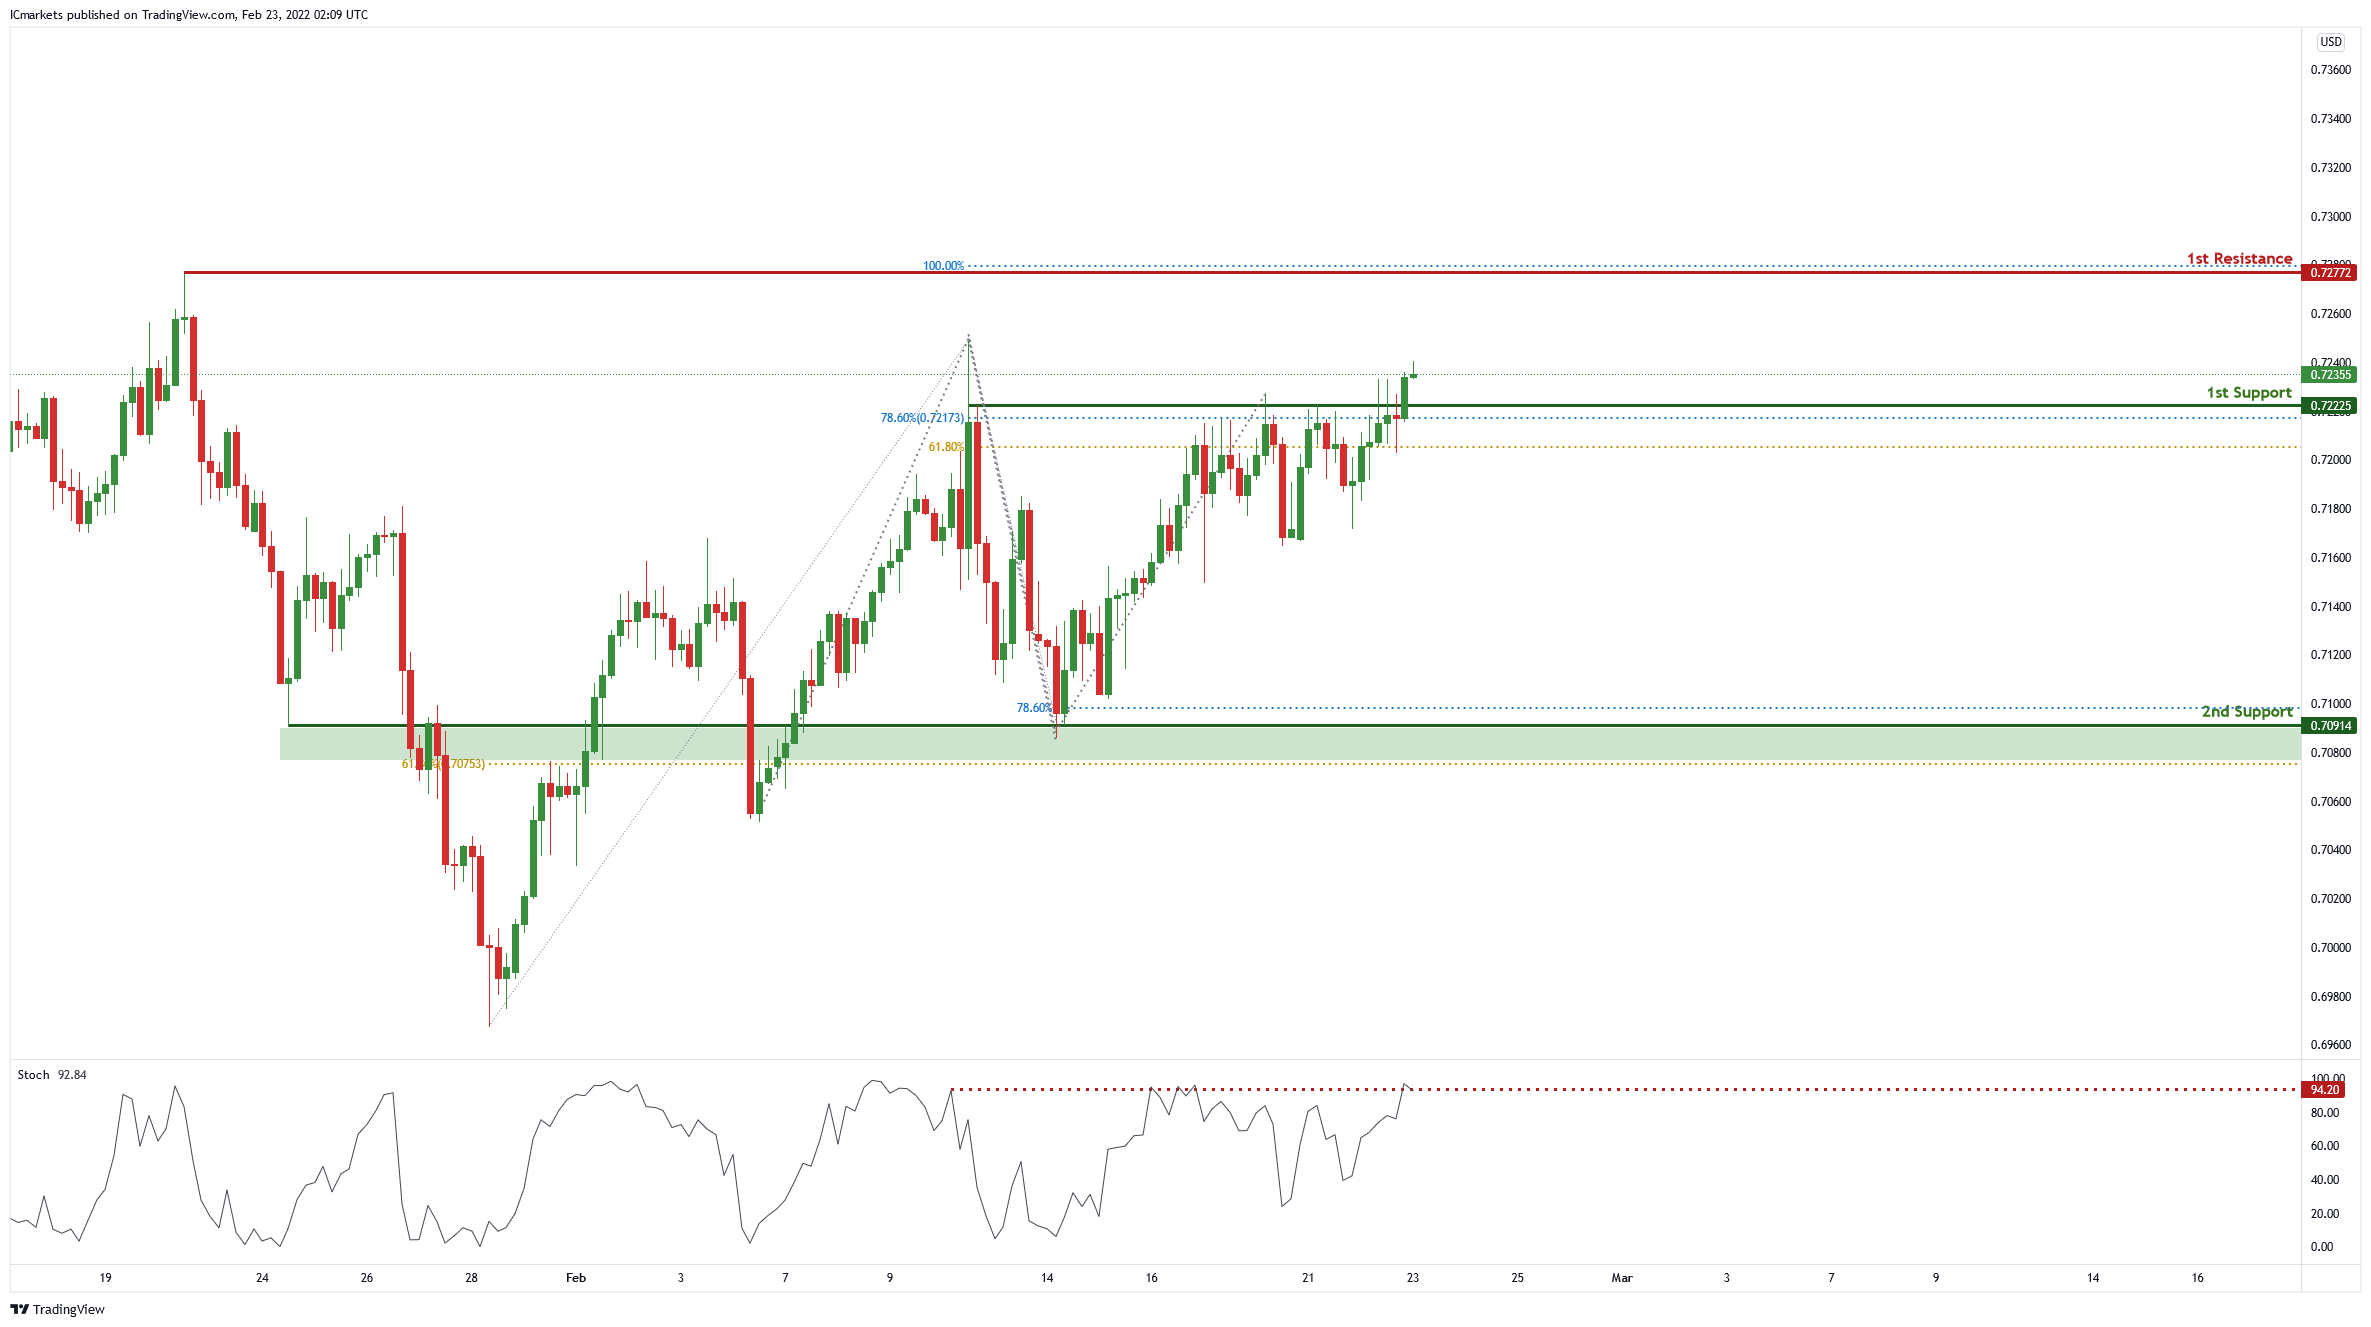
AUD/USD:
On the H4 chart , price is near 1st support level of 0.72181 in line with 78.6% Fibonacci projection and 61.8% Fibonacci retracement. Price can potentially dip to the 2nd support level of 0.70914 in line with 78.6% Fibonacci projection and 61.8% Fibonacci retracement. Our bearish bias is supported by RSI indicator as it is abiding by a descending trendline
Areas of consideration:
- H4 1st support at 0.72181
- H4 2nd support at 0.70914
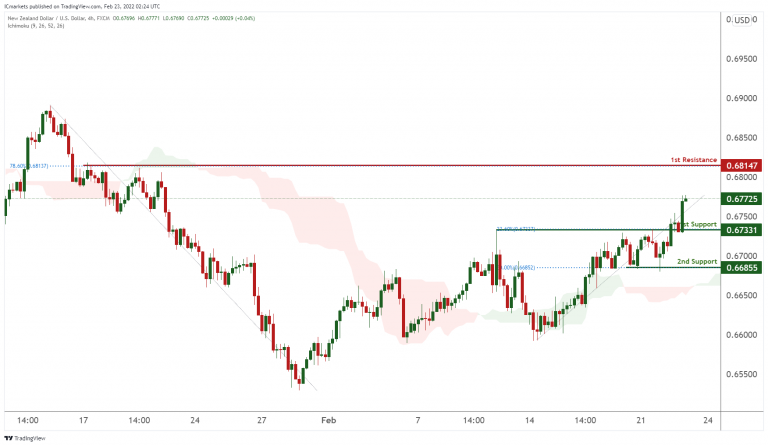
NZD/USD:
On the H4 timeframe, prices are approaching a pivot and are on bullish momentum. We see potential for a bounce from our 1st support at 0.67331 in line with 38.2% Fibonacci retracement towards 1st resistance at 0.68147 in line with 78.6% Fibonacci retracement. Prices are trading above our ichimoku cloud support, further supporting our bullish bias. Alternatively, our stop loss will be placed at 0.66855 in line with 50% Fibonacci retracement.
Areas of consideration:
- H4 time frame, 1st resistance at 0.68147
- H4 time frame, 1st support at 0.67331
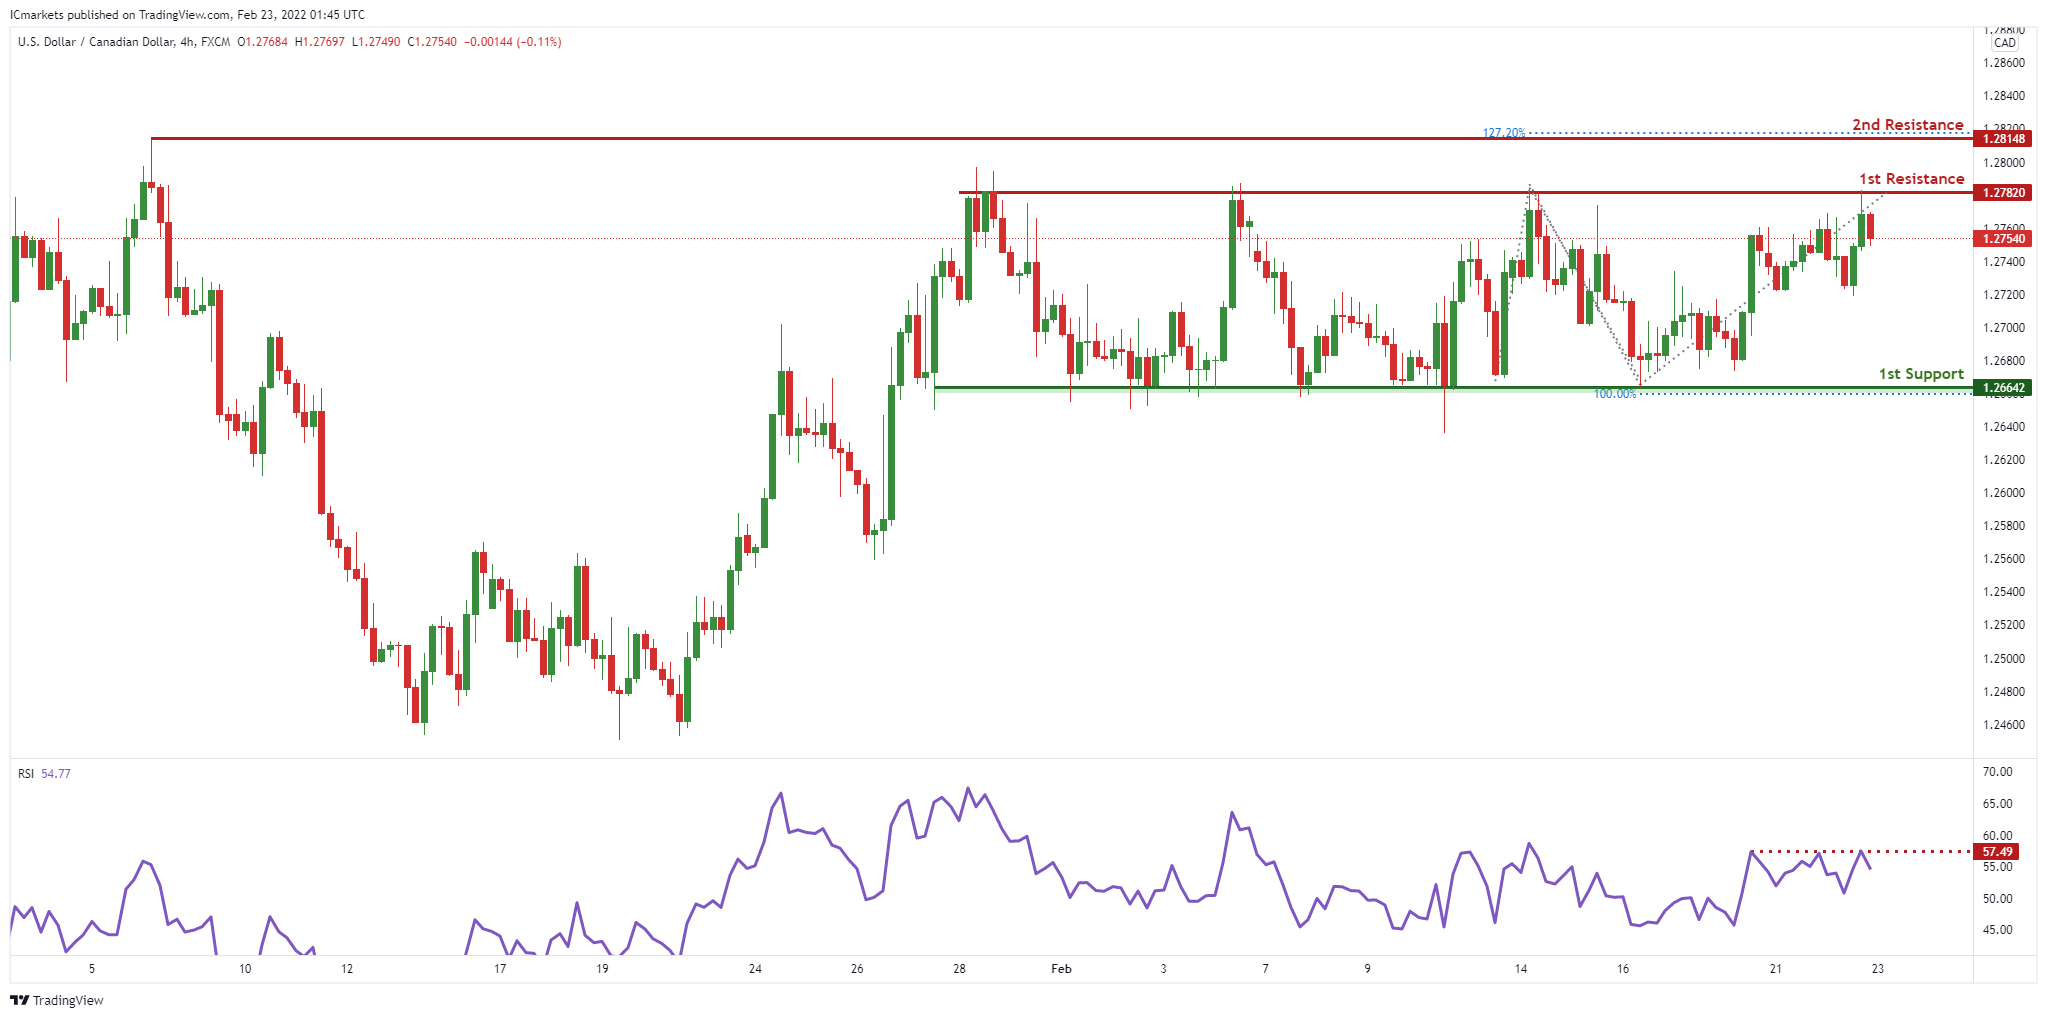
USD/CAD:
On the H4 timeframe, We see the possibility of bearish continuation from our 1st resistance at 1.27820 in line with horizontal swing high resistance towards our 1st support at 1.26642 in line with the 100% Fibonacci extension level. Our bearish bias is further supported by prices reversing off the RSI indicator.
Areas of consideration:
- H4 time frame, 1st support at 1.26642
- H4 time frame, 1st resistance at 1.27820
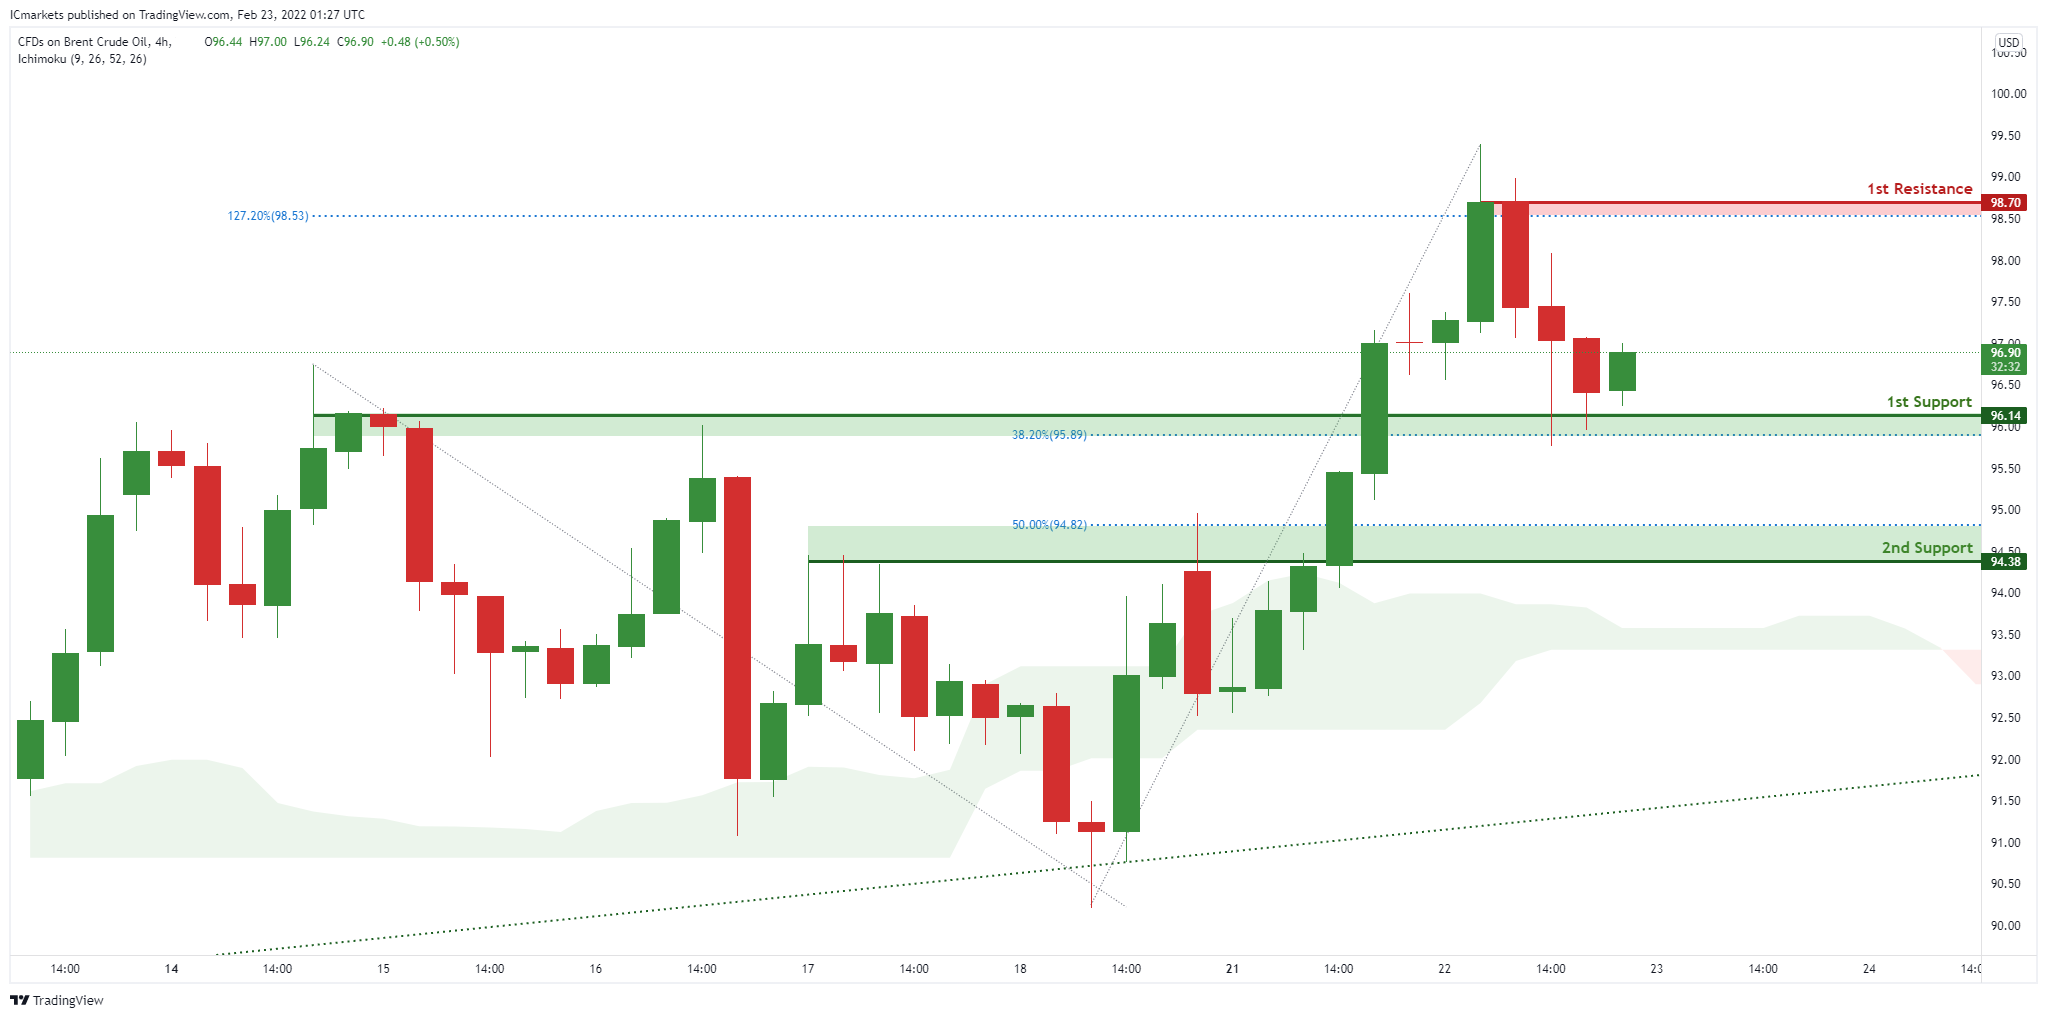
OIL:
On the H4, with price moving above the ichimoku cloud, we can expect bullish continuation from our 1st support at 96.14 in line with 38.2% Fibonacci retracement towards our 1st resistance at 98.70 which is a strong resistance and in line with 127.2% Fibonacci extension. Alternatively, price may break 1st support structure and head for 2nd support, which coincides with the ascending trendline and 50% Fibonacci retracement at 94.38
Areas of consideration:
- H4 time frame, 1st resistance of 98.70
- H4 time frame, 1st support of 96.14
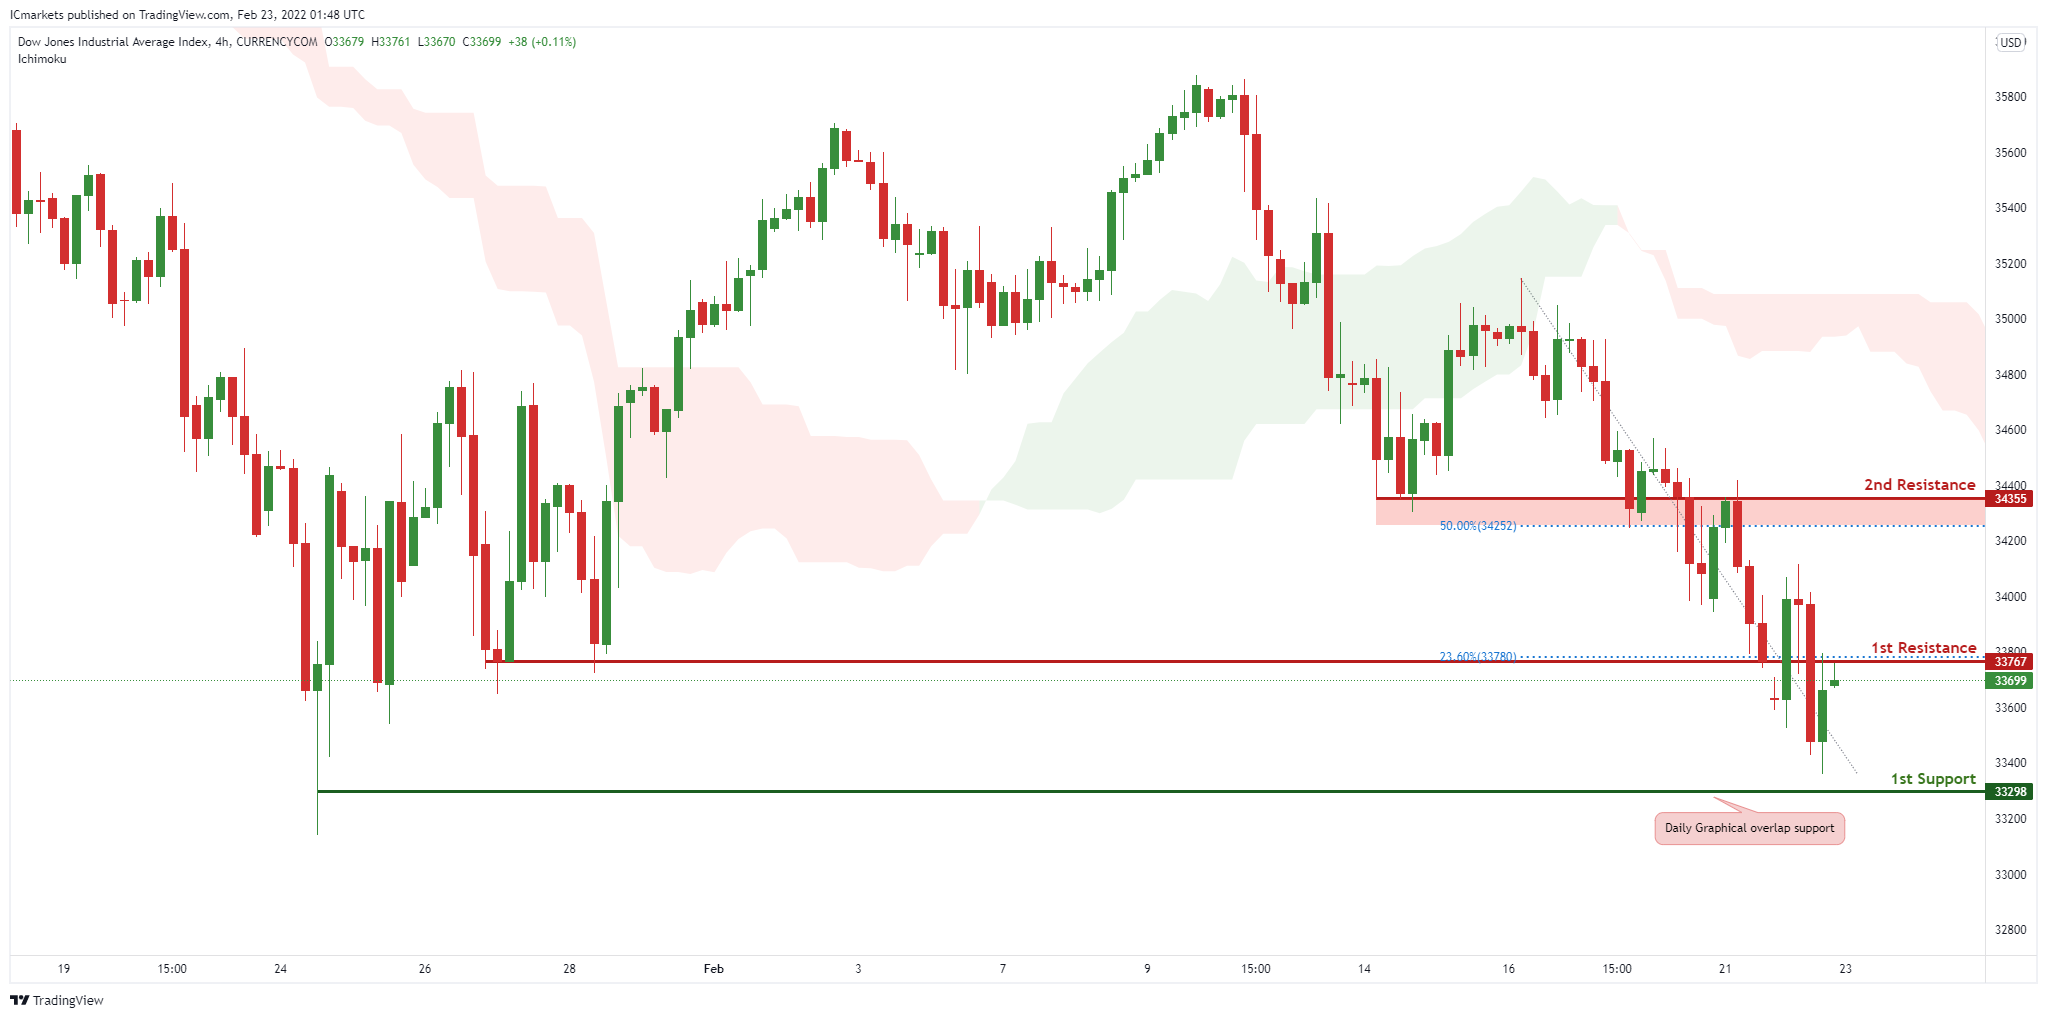
Dow Jones Industrial Average:
On the H4 timeframe, We see the possibility of bearish continuation from our 1st resistance at 33767 in line with horizontal overlap resistance towards our 1st support at 33298 in line with the horizontal swing low support. Alternatively, price may break 1st resistance and head for 2nd resistance at 34355 in line with the 50% Fibonacci retracement level. Our bearish bias is further supported by how price is moving below the ichimoku cloud
Areas of consideration :
- H4 1st support at 34355
- H4 1st resistance at 33767


