
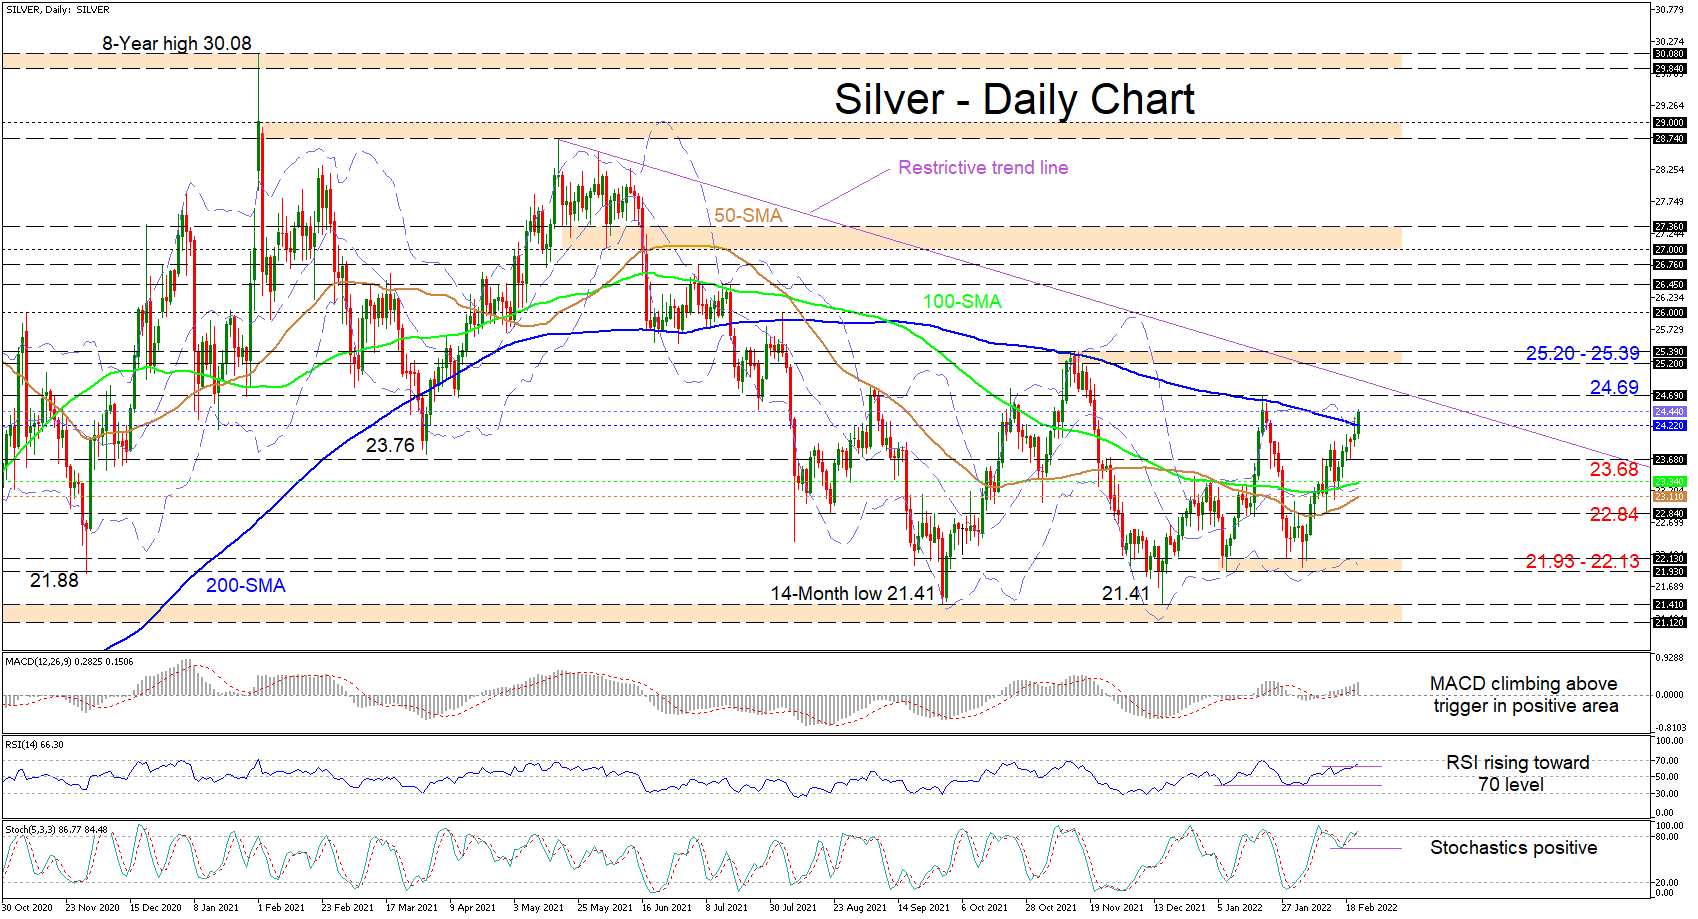
Silver is simultaneously overpowering the 200-day simple moving average (SMA) at 24.22 and the adjacent upper Bollinger band around 24.44 trying to reel in the overhead high of 24.69 and the 25.20-25.39 ceiling of the near five-month sideways market. The gliding 200-day SMA is endorsing a bearish tone but has failed to suppress growing upside impetus, while the upturn in the slopes of the 50- and 100-day SMAs, suggests the minor price rally from the 21.93-22.13 support section may be firming.
The short-term oscillators remain skewed to the upside. The MACD, in the positive region, is advancing above its red signal line, while the climbing RSI is nearing the 70 overbought level. Additionally, above the 80 mark, the stochastic %K line has regained its positive charge, implying bullish pressures are persisting.
If the price manages to close above the 200-day SMA and the upper Bollinger band, prompt resistance could transpire from the 24.69 neighbouring high. Successfully overstepping this, and overshooting the potential descending line pulled from the 28.74 high, may reinforce the odds of a possible bullish breakout of the 25.20-25.39 ceiling of a trading range that has imprisoned the commodity for nearly five-months.
However, if bullish forces dissolve and the price closes back below the 200-day SMA, downside friction could commence at the 23.68 low ahead of a fortified buffer zone between the 100- and 50-day SMA at 23.34 and 23.11 respectively. If selling interest intensifies further, a deeper retracement may ignore the 22.84 barrier and target the 21.93-22.13 tough support section, moulded by the January and February troughs, which also encapsulates the lower Bollinger band.
Summarizing, silver is exhibiting a strong bullish tone above the 200-day SMA and around the upper parts of a broader sideways market. That said, the neutral-to-bullish pressures of the commodity may linger should the price manage to hold north of the 23.68 low and the 100- and 50-day SMAs at 23.34 and 23.11. Moreover, the lower and upper boundaries of the broader trading range are 21.41 and 25.39.


