
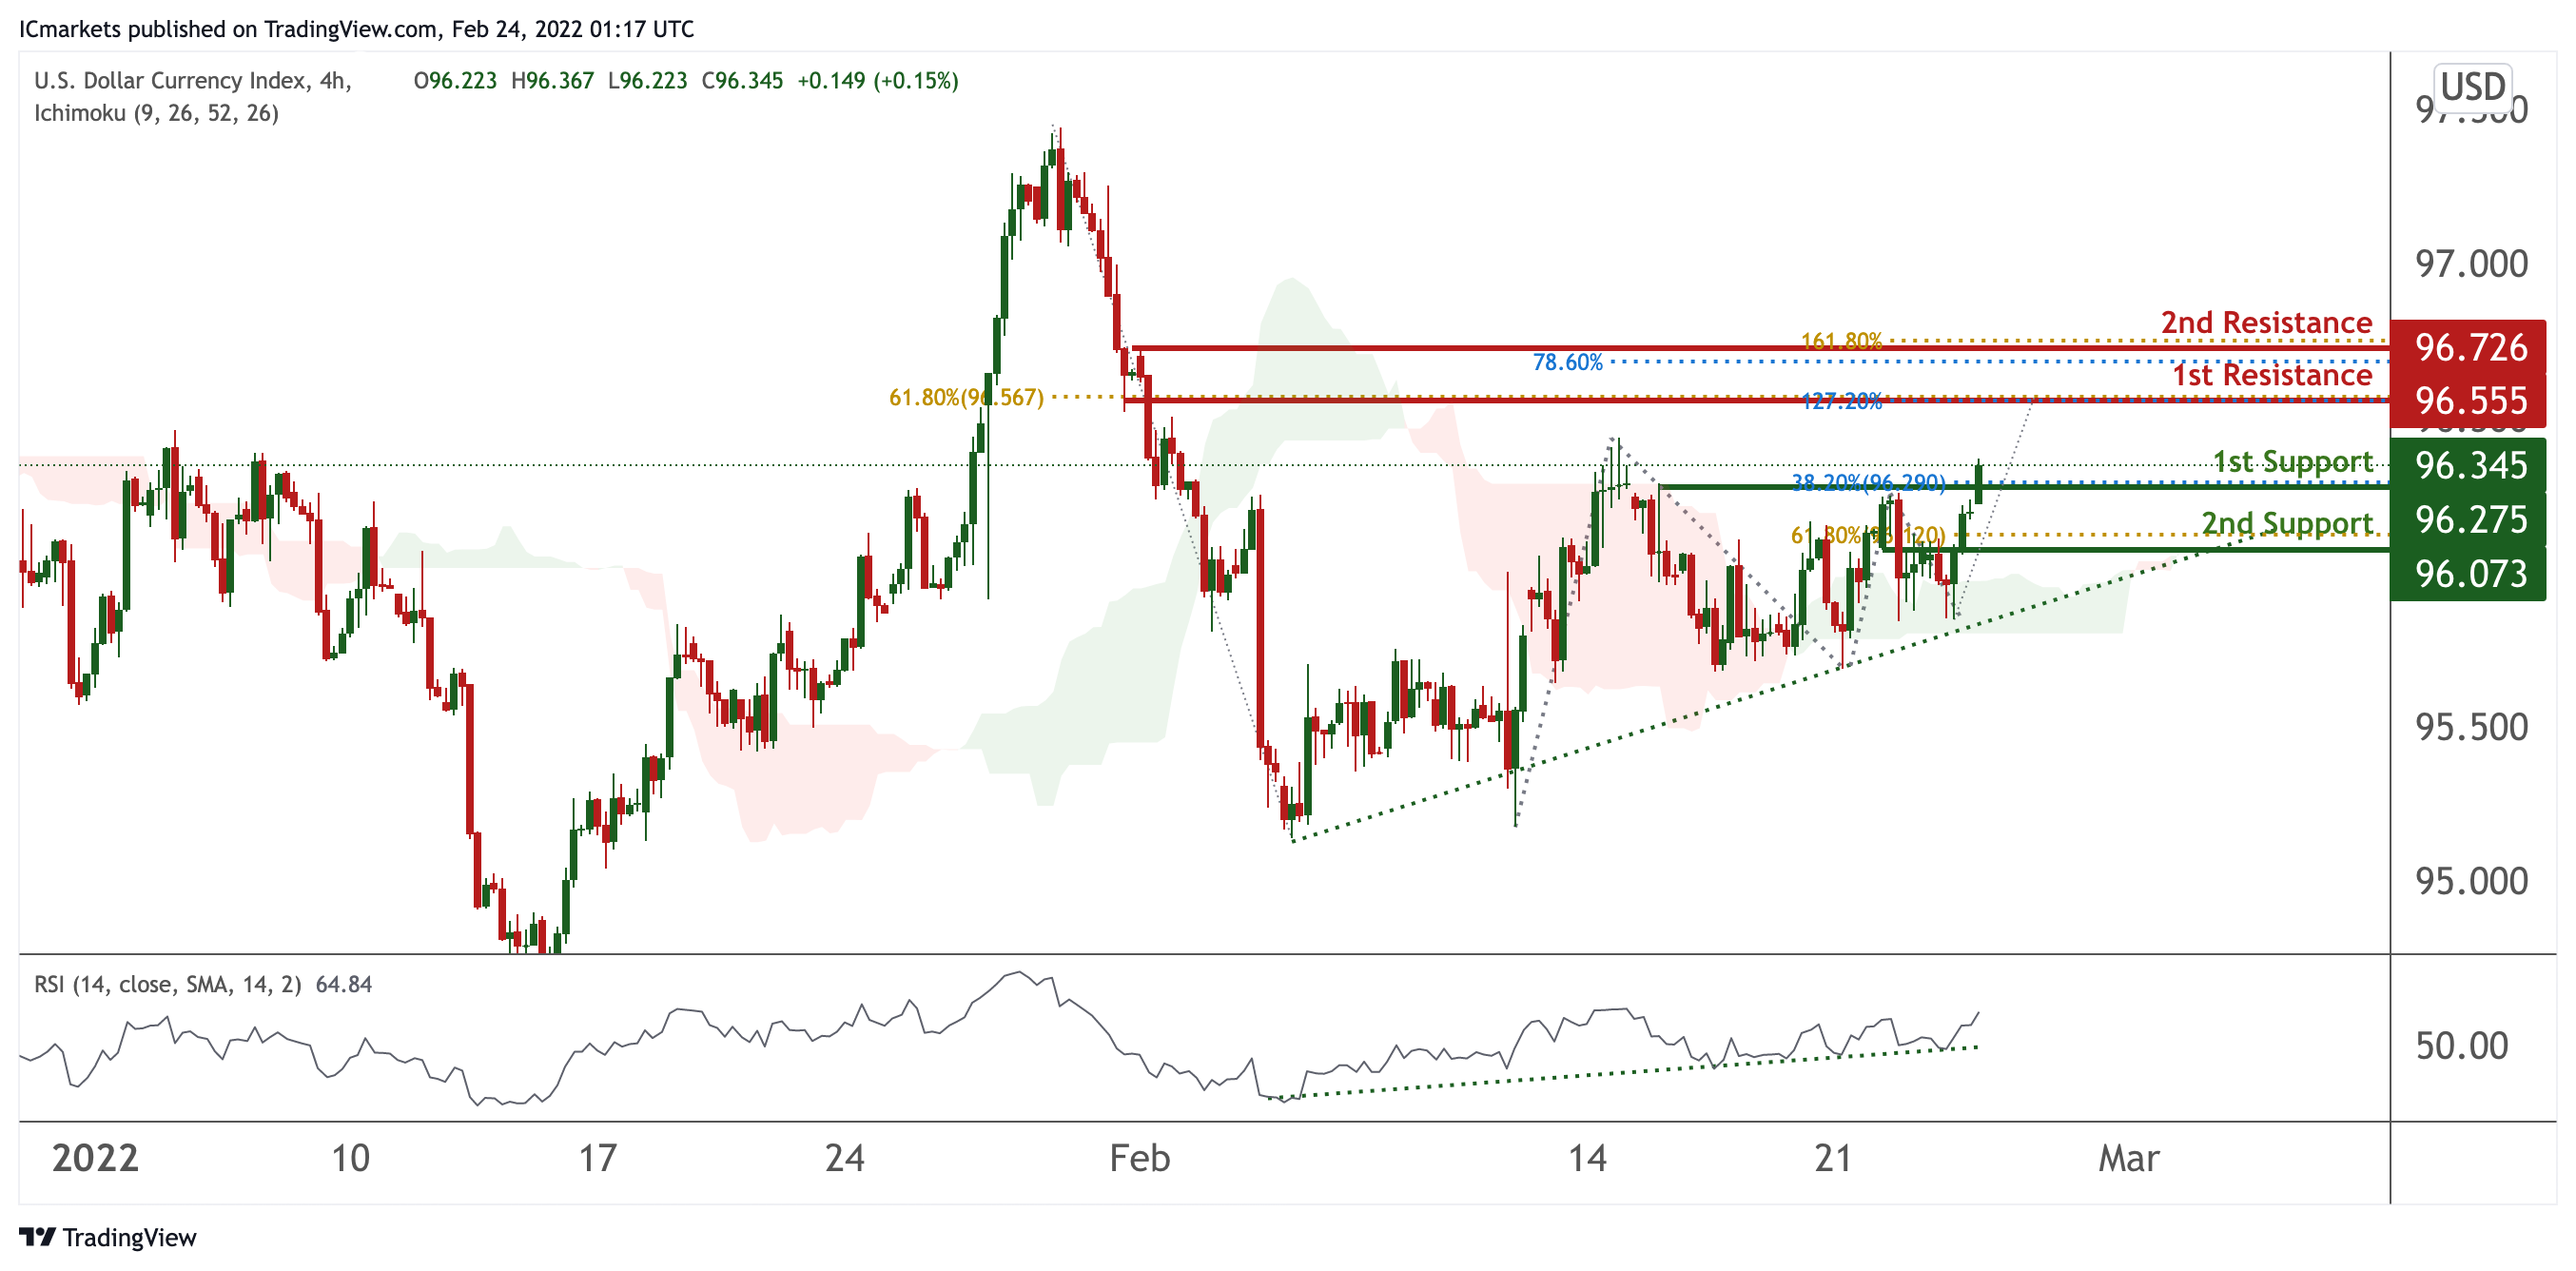
DXY:
On the H4, prices are on bullish momentum and abiding by an ascending trendline. We see the potential for further bullish continuation from our 1st support at 96.345 in line with 38.2% Fibonacci retracement towards our 1st resistance at 96.555 in line with 127.2% Fibonacci extension and 61.8% Fibonacci retracement. Our bullish bias is supported by prices trading above our ichimoku clouds support and RSI portraying bullish momentum.
Areas of consideration
- H4 1st resistance at 96.345
- H4 1st support at 96.555
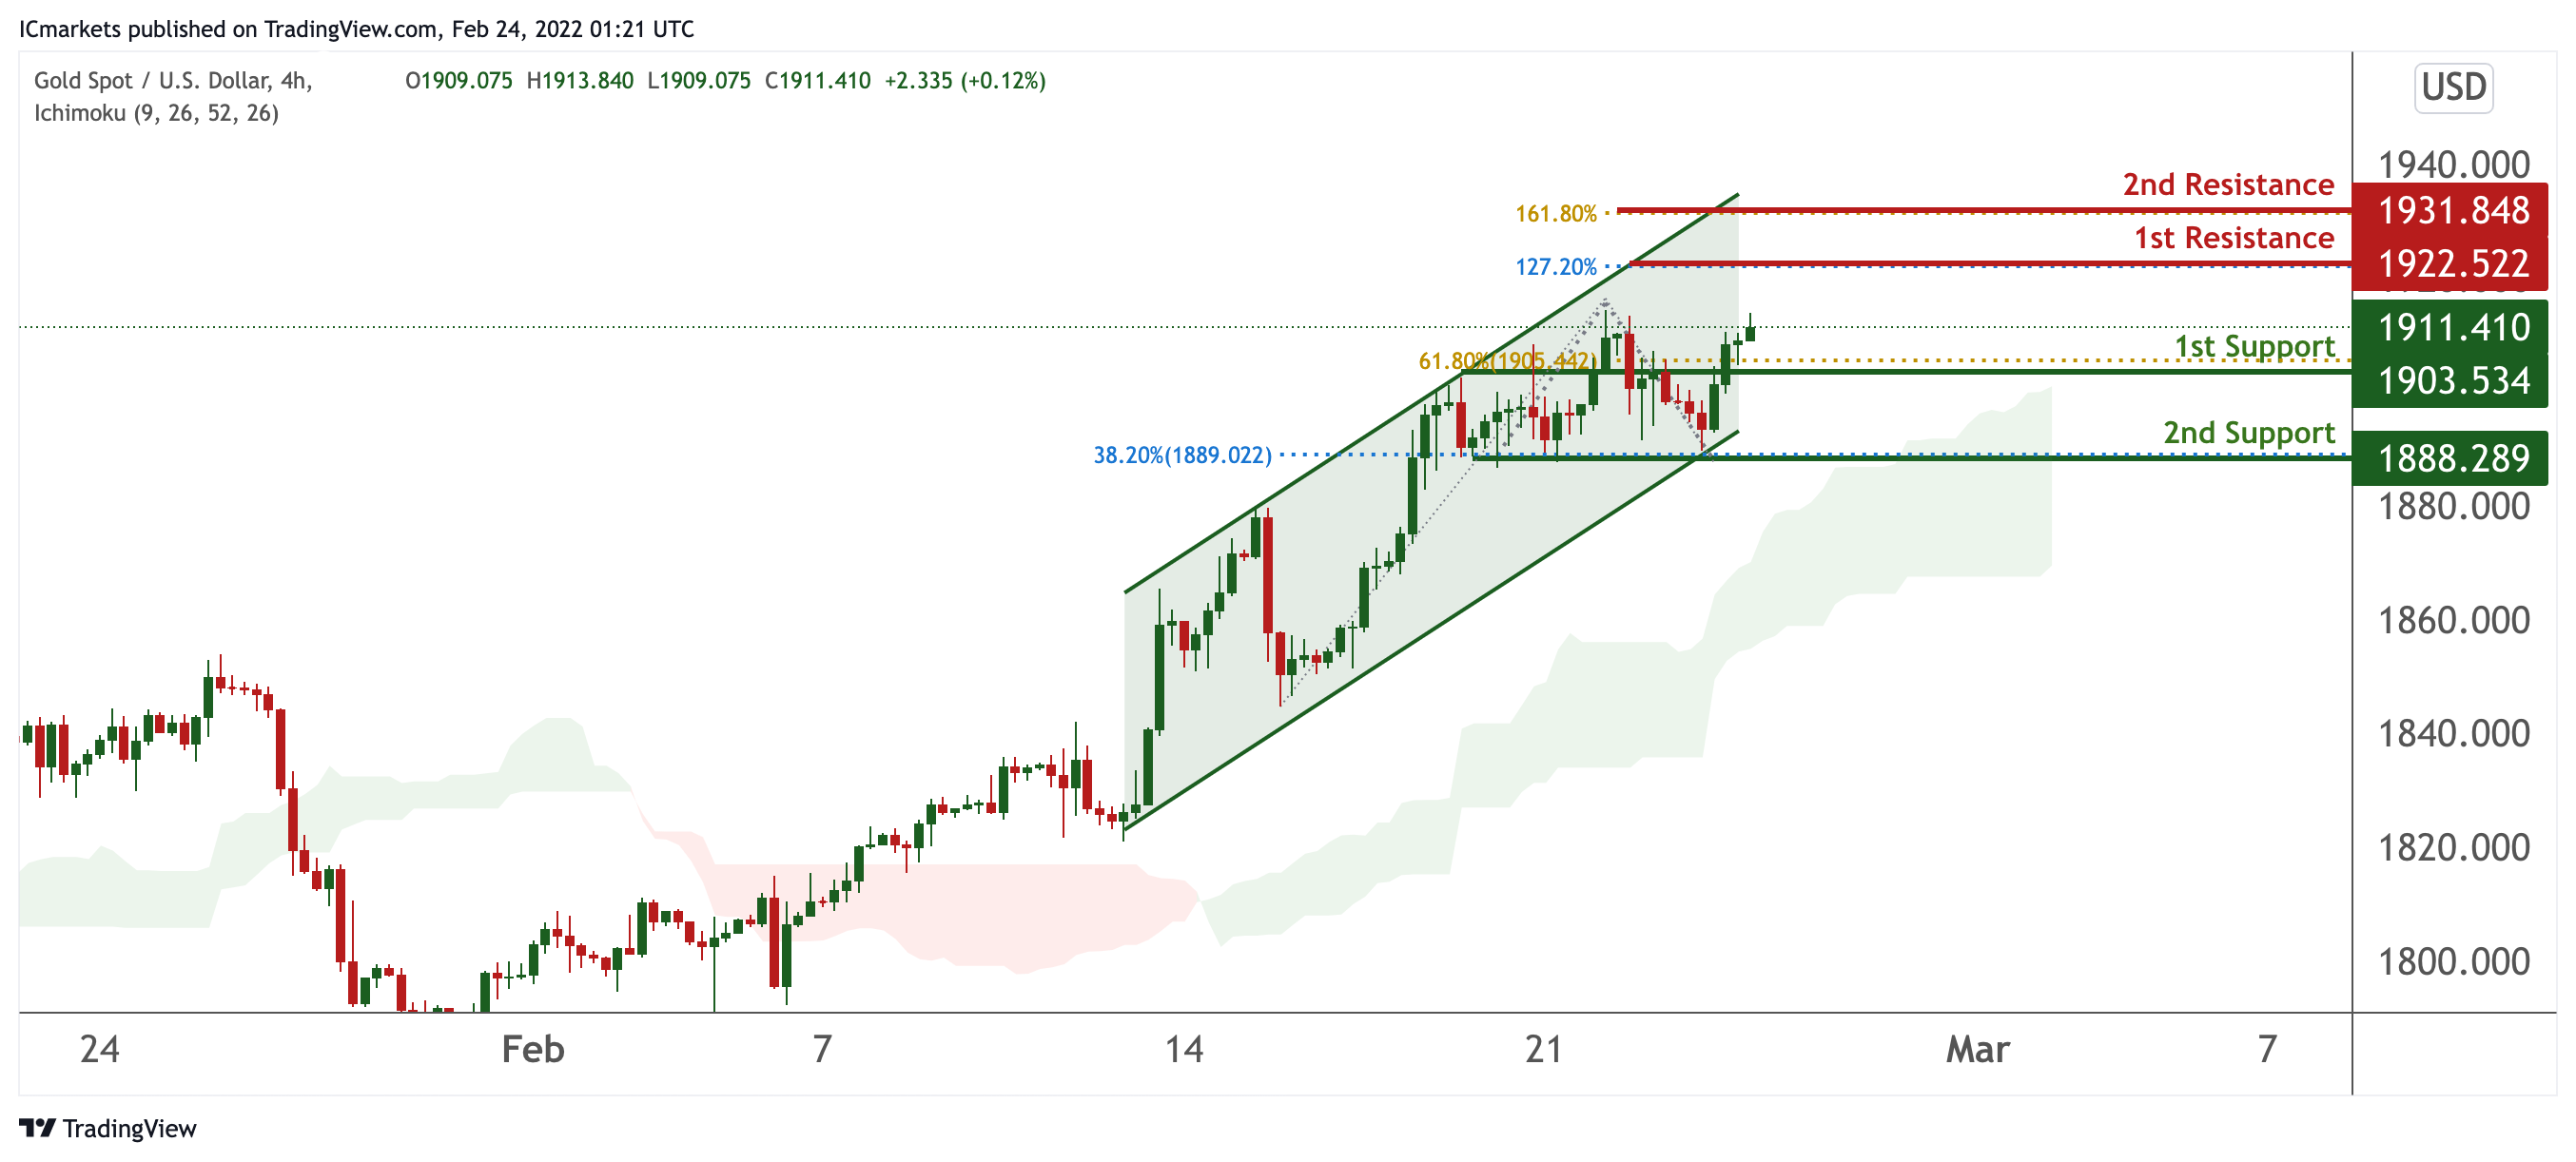
XAU/USD (GOLD):
On the H4, prices are on bullish momentum and consolidating in a parallel channel. We see the potential for further bullish continuation from our 1st support at 1903.534 in line with 61.8% Fibonacci extension towards our 1st resistance at 1922.522 in line with 127.2% Fibonacci extension. Prices are trading above our Ichimoku Cloud support, further supporting our bullish bias.
Areas of consideration:
- H4 1st resistance at 1922.522
- H4 1st support at 1903.534
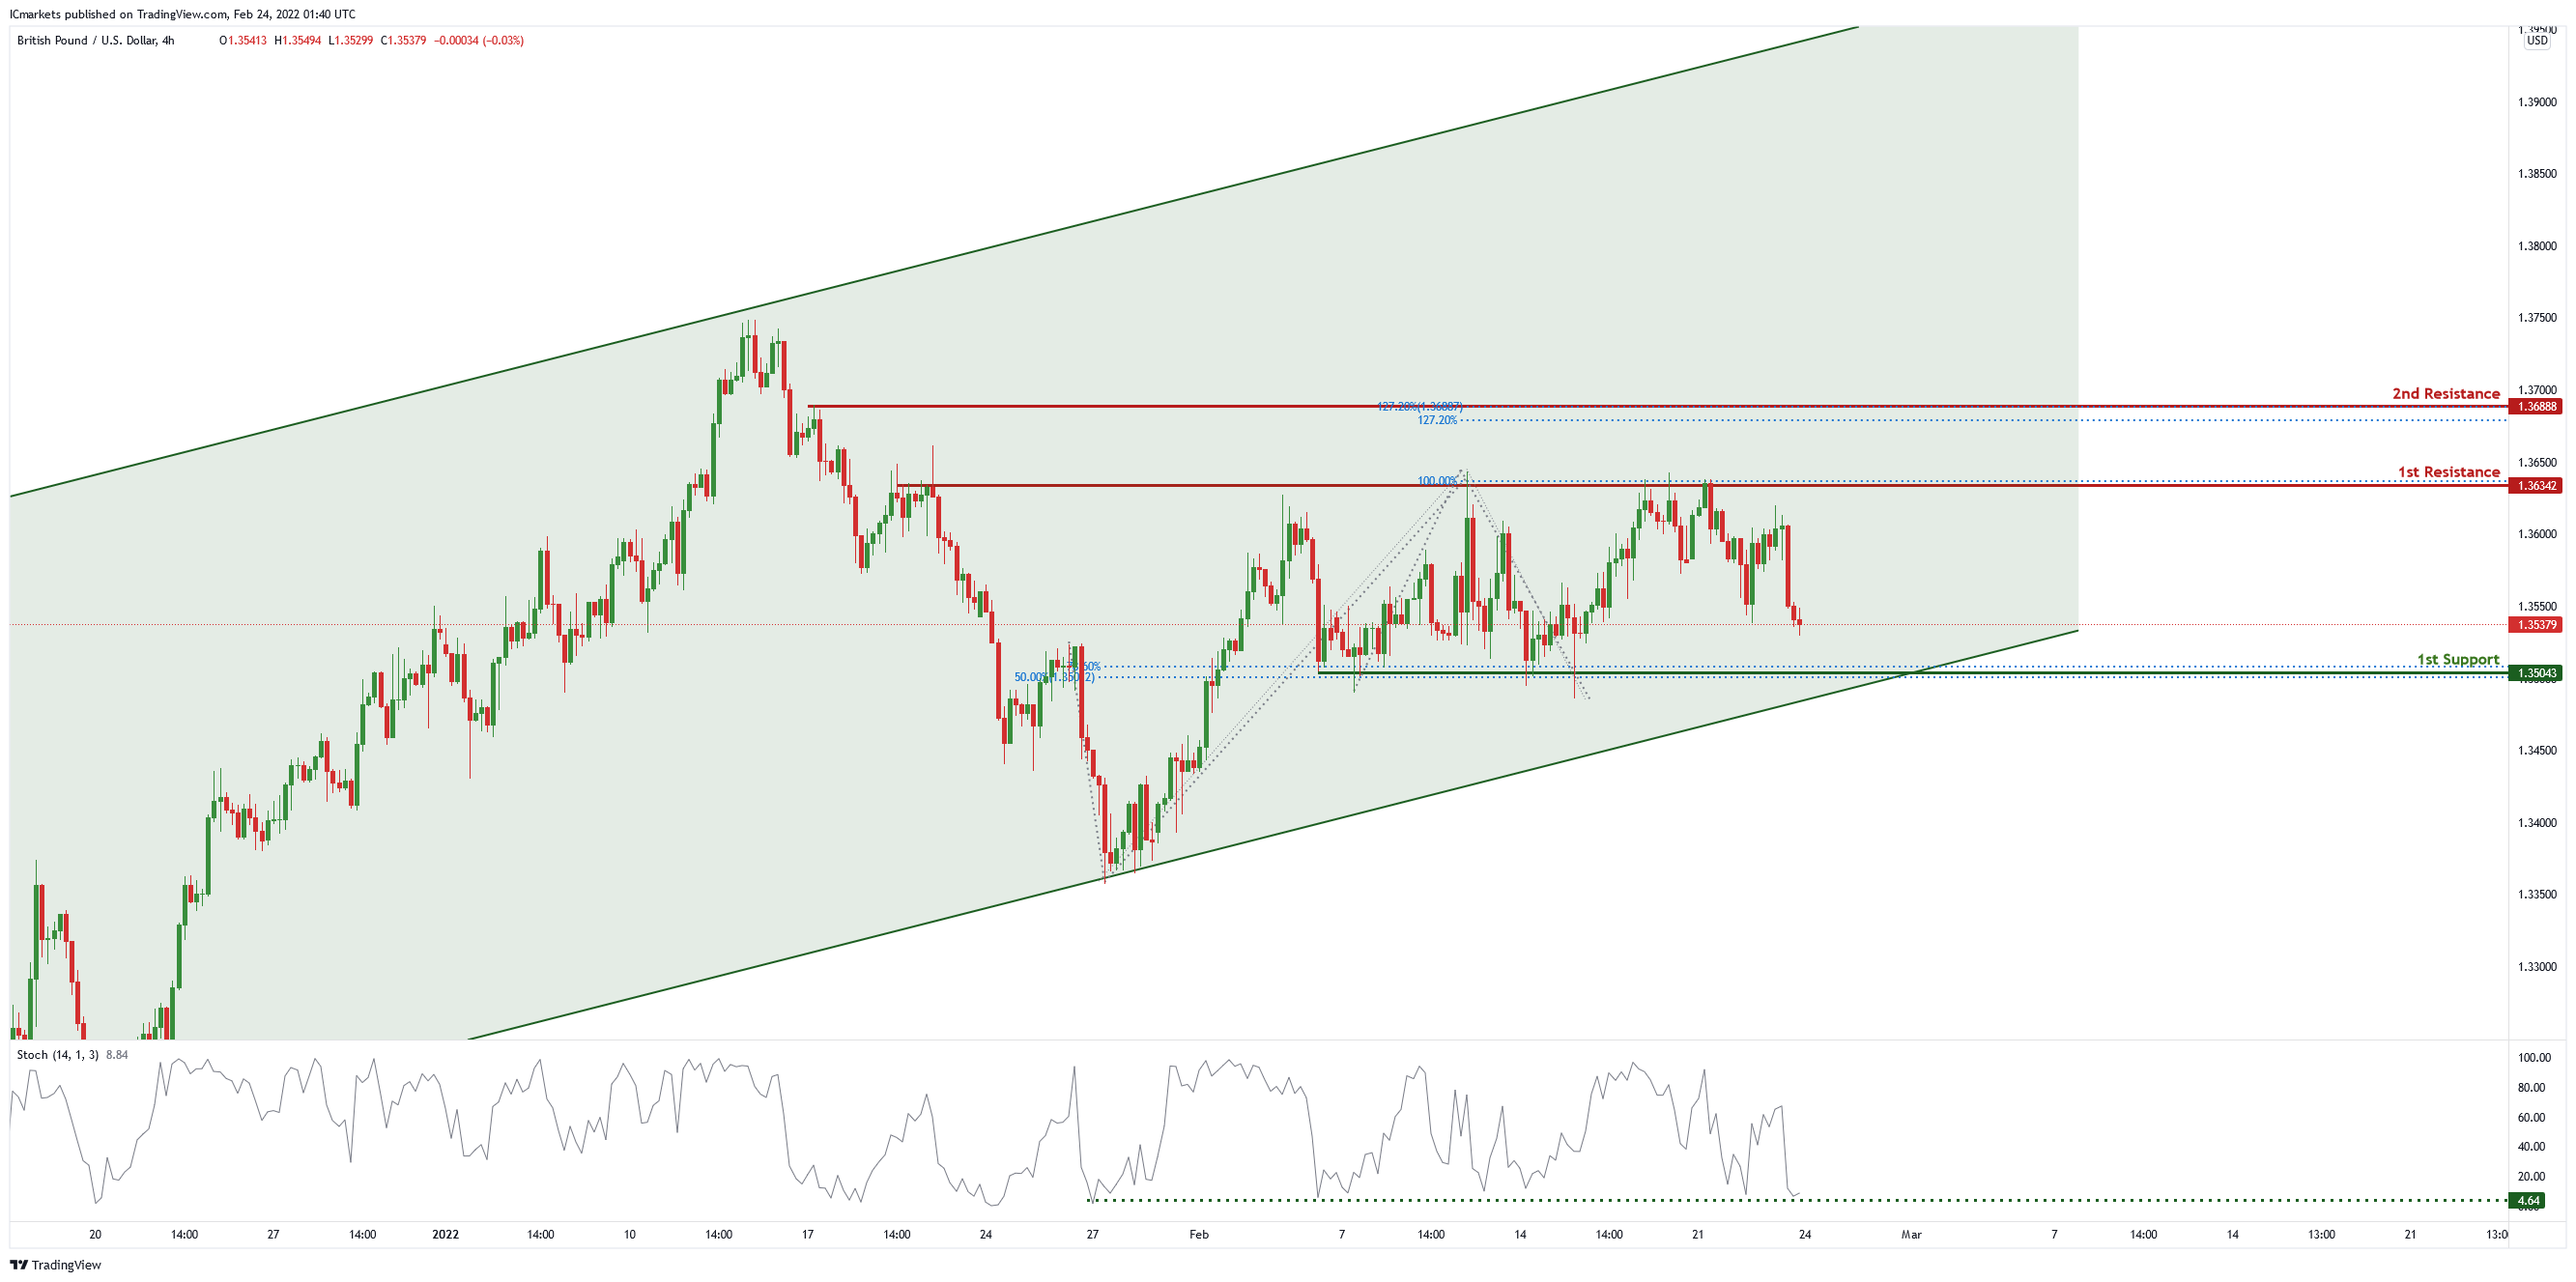
GBP/USD
On the H4 chart , price is near 1st resistance level of 1.36342 in line with 61.8% Fibonacci retracement and 100% Fibonacci projection. Price can potentially dip to the take profit level of 1.35043 in line with 50% Fibonacci retracement and 78.6% Fibonacci projection . Our bearish bias is supported by the stochastic indicator as it is near support level.
Areas of consideration
- H4 1st resistance at 1.36342
- H4 1st support at 1.35043
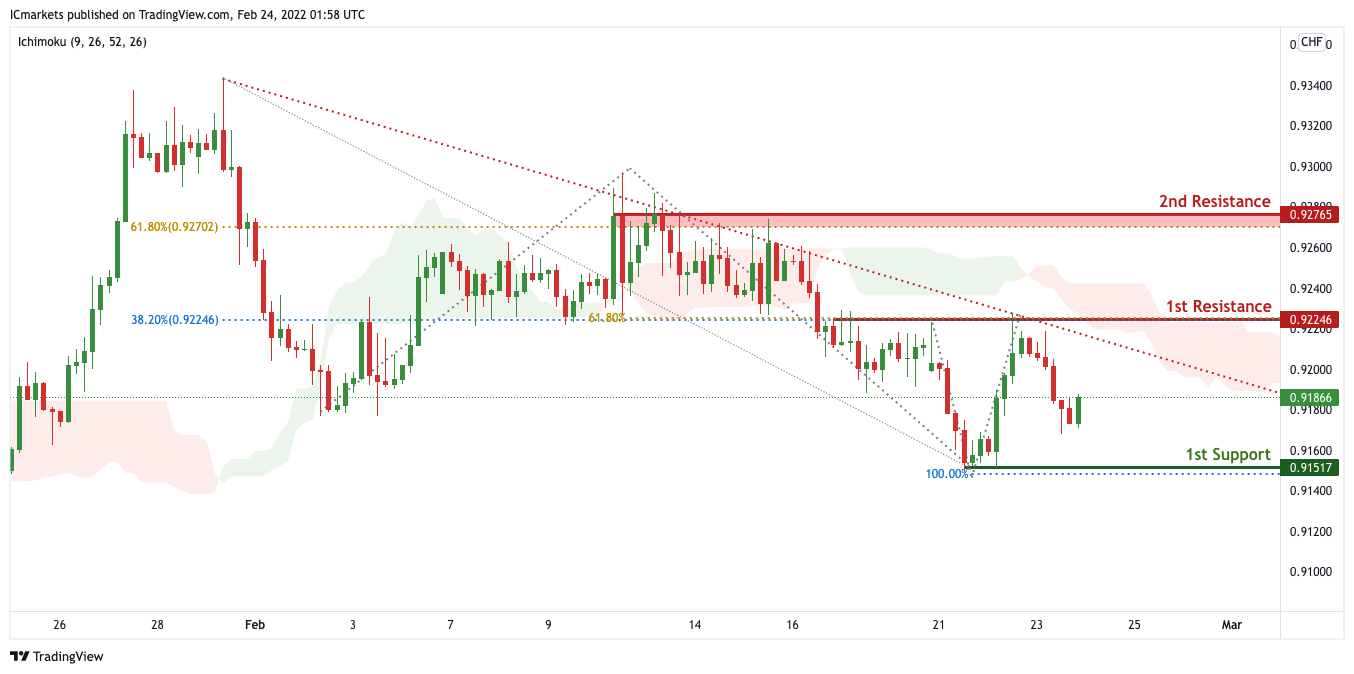
USD/CHF:
On the H4 timeframe, prices are on bearish momentum and abiding to our descending trendline. We see the possibility of bearish continuation from our 1st resistance at 0.92246 in line with 38.2% Fibonacci retracement and 61.8% Fibonacci projection towards our 1st support at 0.91517 in line with 100% Fibonacci projections. Our bearish bias is further supported by prices trading below our Ichimoku clouds and the descending trend line.
Areas of consideration :
- H4 1st resistance at 0.92246
- H4 1st support at 0.91517
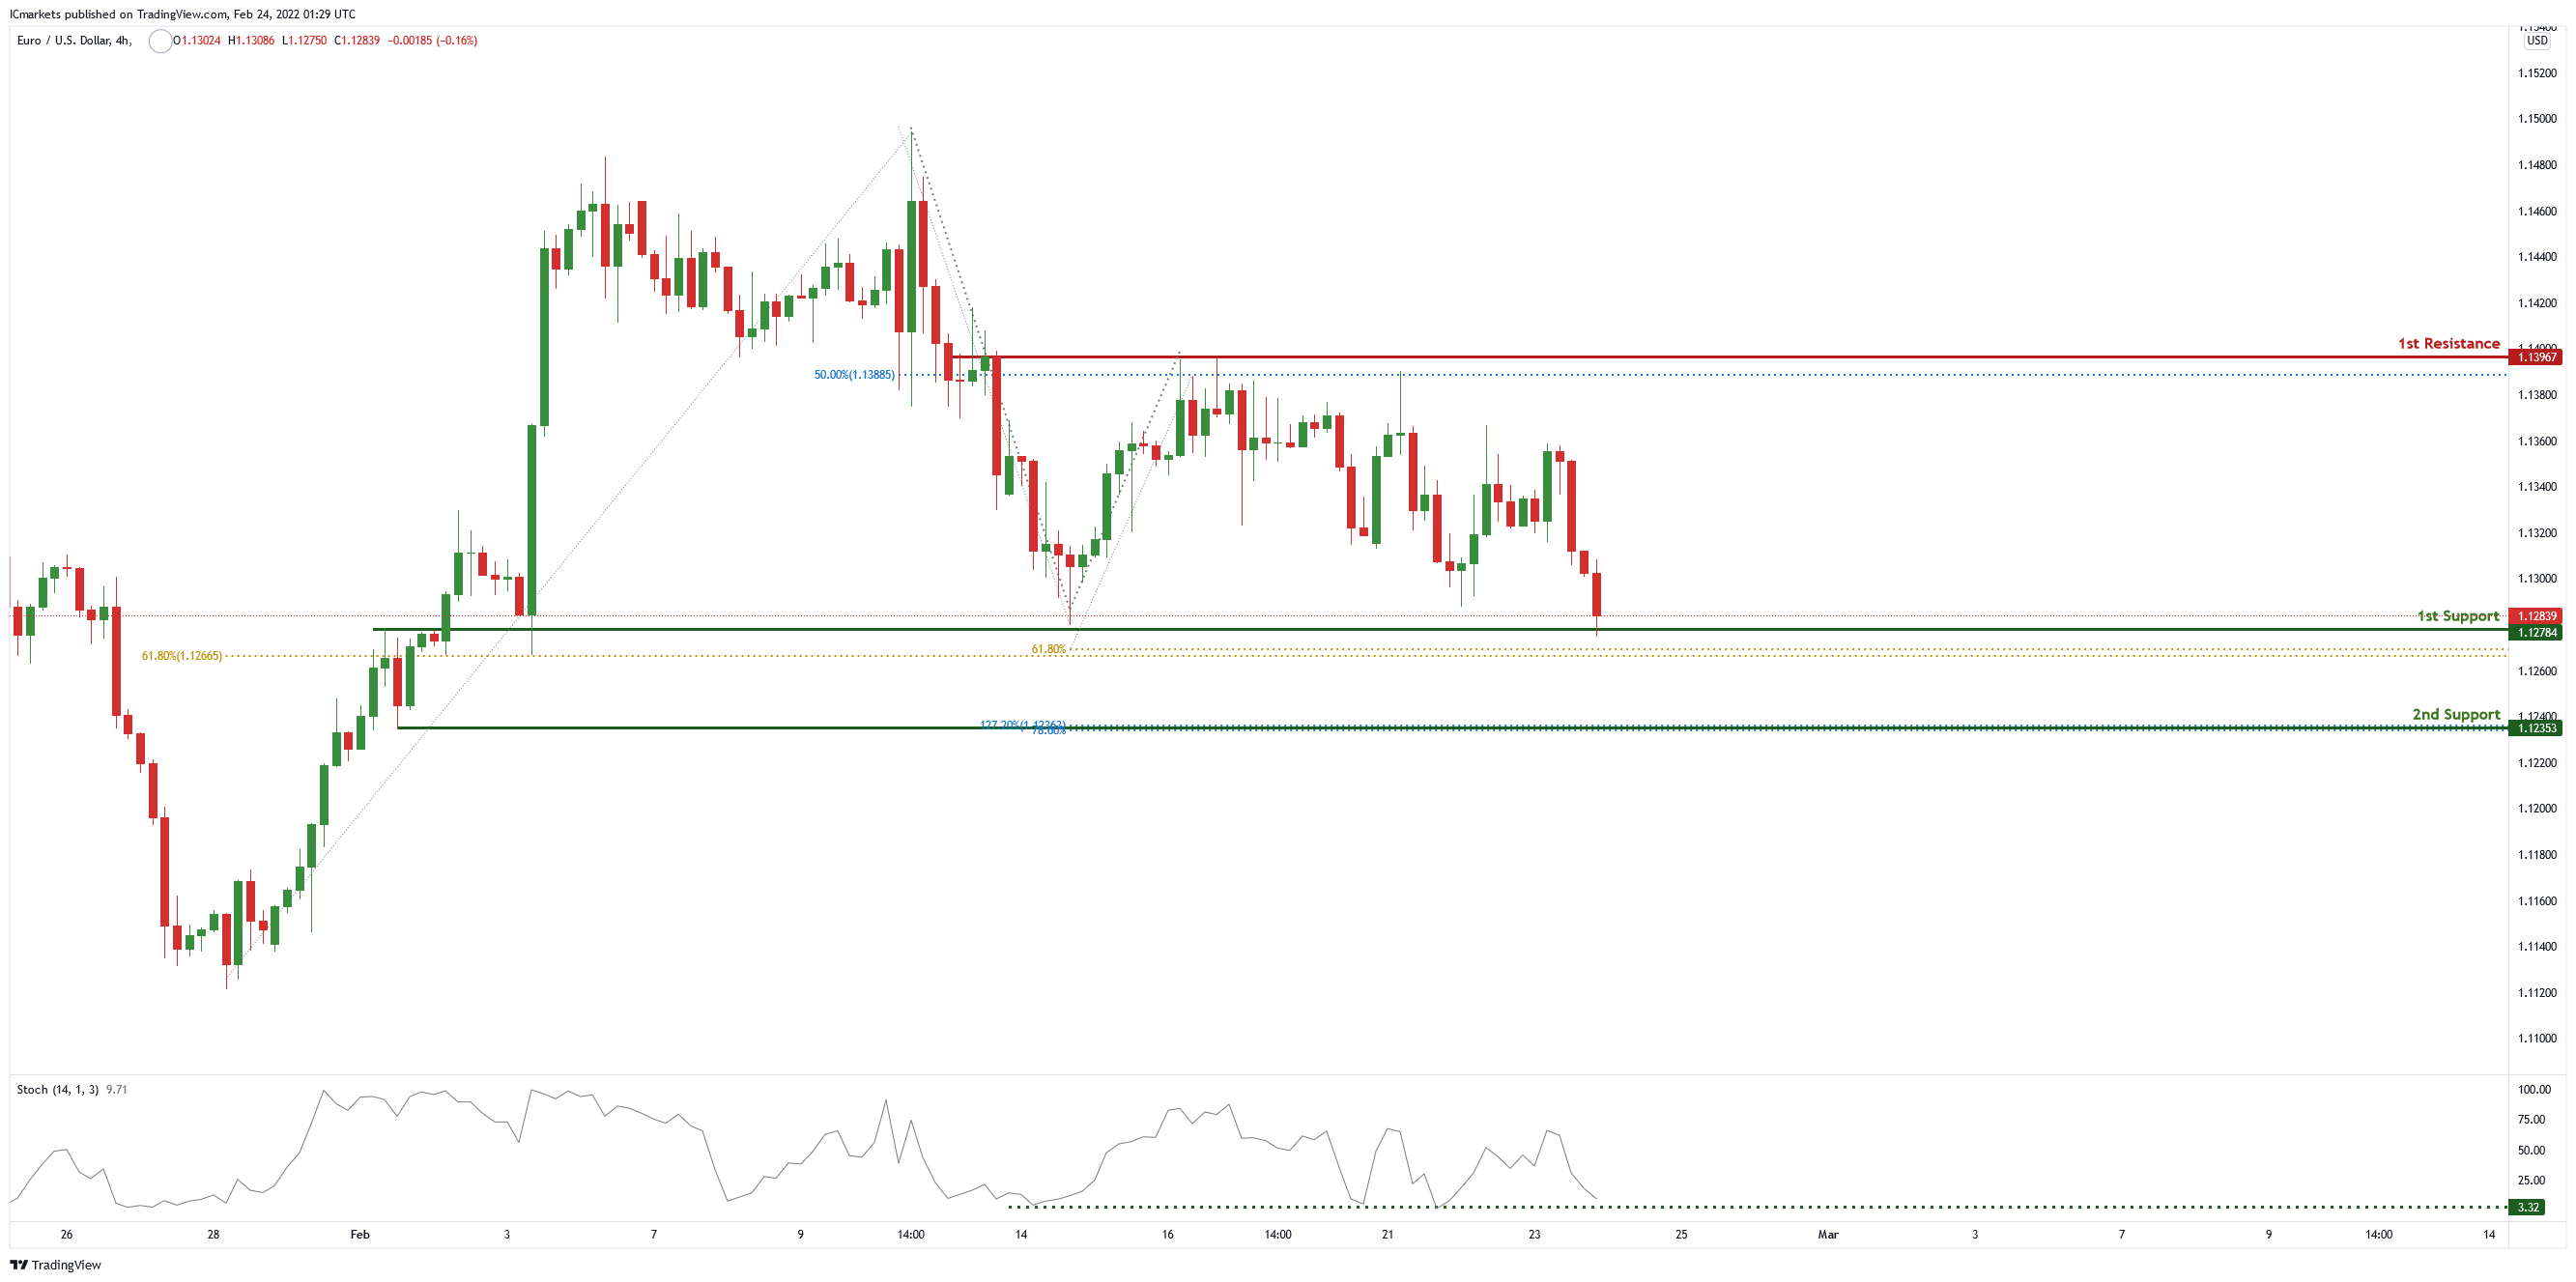
EUR/USD :
On the H4 chart, price is in the middle of 1st resistance of 1.13967 in line with 50% Fibonacci retracement and 1st support of 1.12784 in line with 61.8% Fibonacci retracement and 61.8% Fibonacci projection. Price can potentially bounce from the 1st support to the 1st resistance level. Our bullish bis is supported by the stochastic indicator as it is near support level.
Areas of consideration
- H4 1st support at 1.12784
- H4 1st resistance at 1.13967
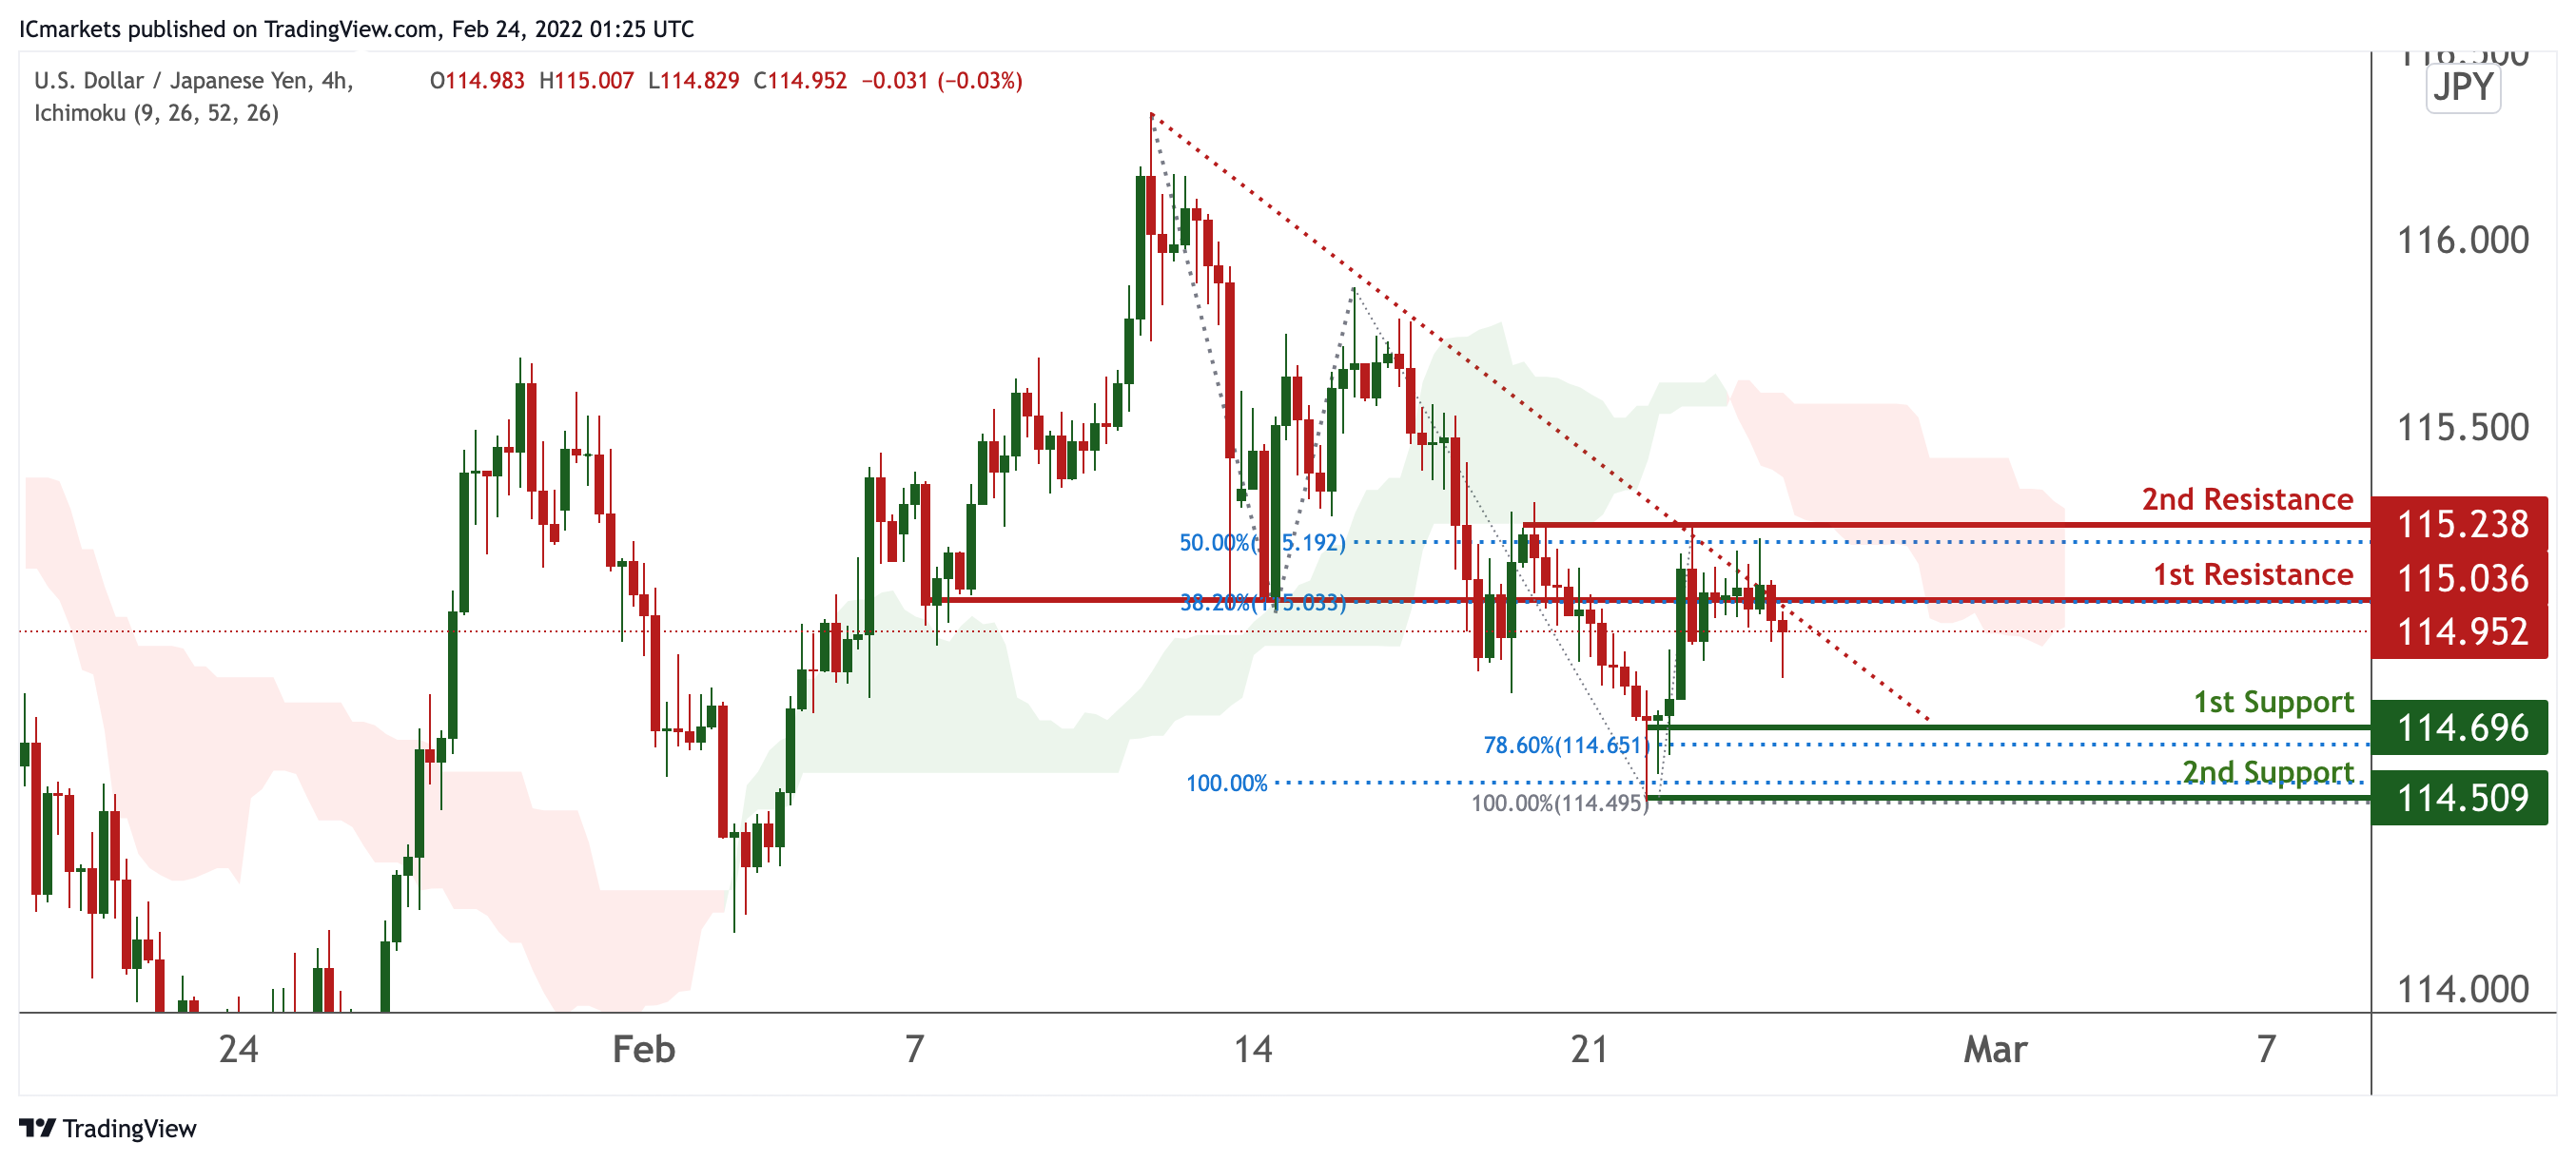
USD/JPY:
On the H4 timeframe, prices are on bearish momentum and abiding to our descending trendline. We see the possibility of bearish continuation from our 1st resistance at 115.036 in line with 38.2% Fibonacci retracement towards our 1st support at 114.696 in line with 78.6% Fibonacci retracement. Our bearish bias is further supported by prices trading below our Ichimoku clouds. Breaking our 1st resistance will find prices climbing higher towards our 2nd resistance at 115.238 in line with 50% Fibonacci retracement.
Areas of consideration:
- H4 time frame, 1st resistance at 115.036
- H4 time frame, 1st support at 114.696
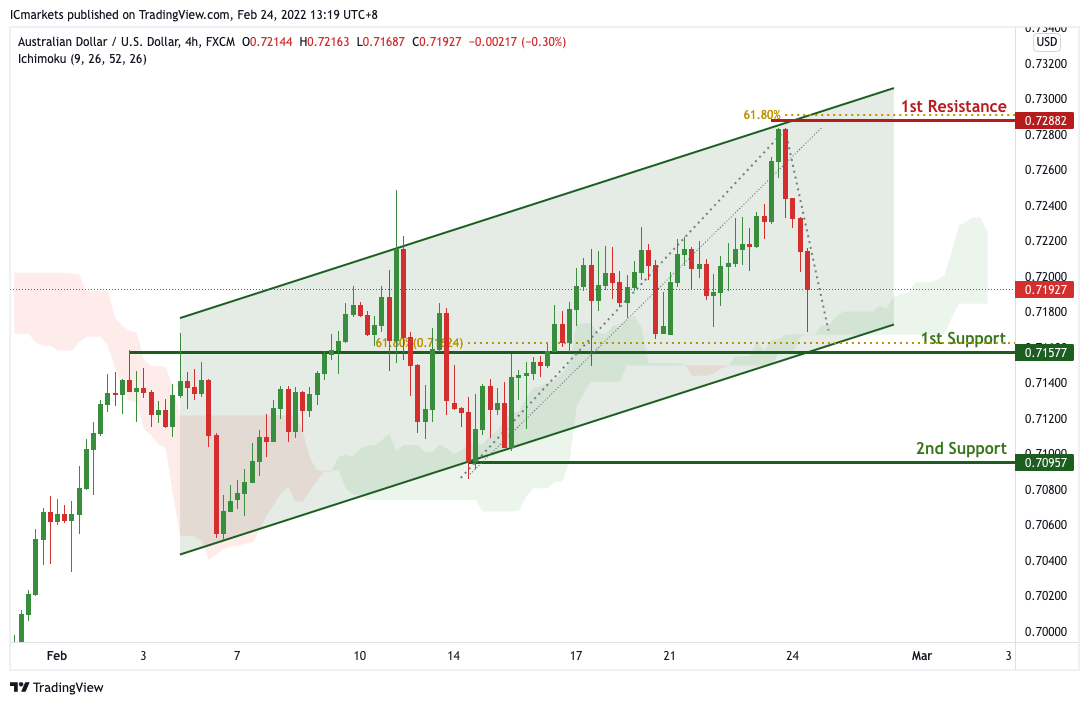
AUD/USD:
On the H4 timeframe, prices are approaching a pivot and are on bullish momentum. We see potential for a bounce from our 1st support at 0.71577 in line with 61.8% Fibonacci retracement towards 1st resistance at 0.72882 in line with swing high resistance. Prices are trading above our ichimoku cloud support, further supporting our bullish bias. Alternatively, our stop loss will be placed at 0.70957.
Areas of consideration:
- H4 1st resistance at 0.72882
- H4 1st support at 0.71577
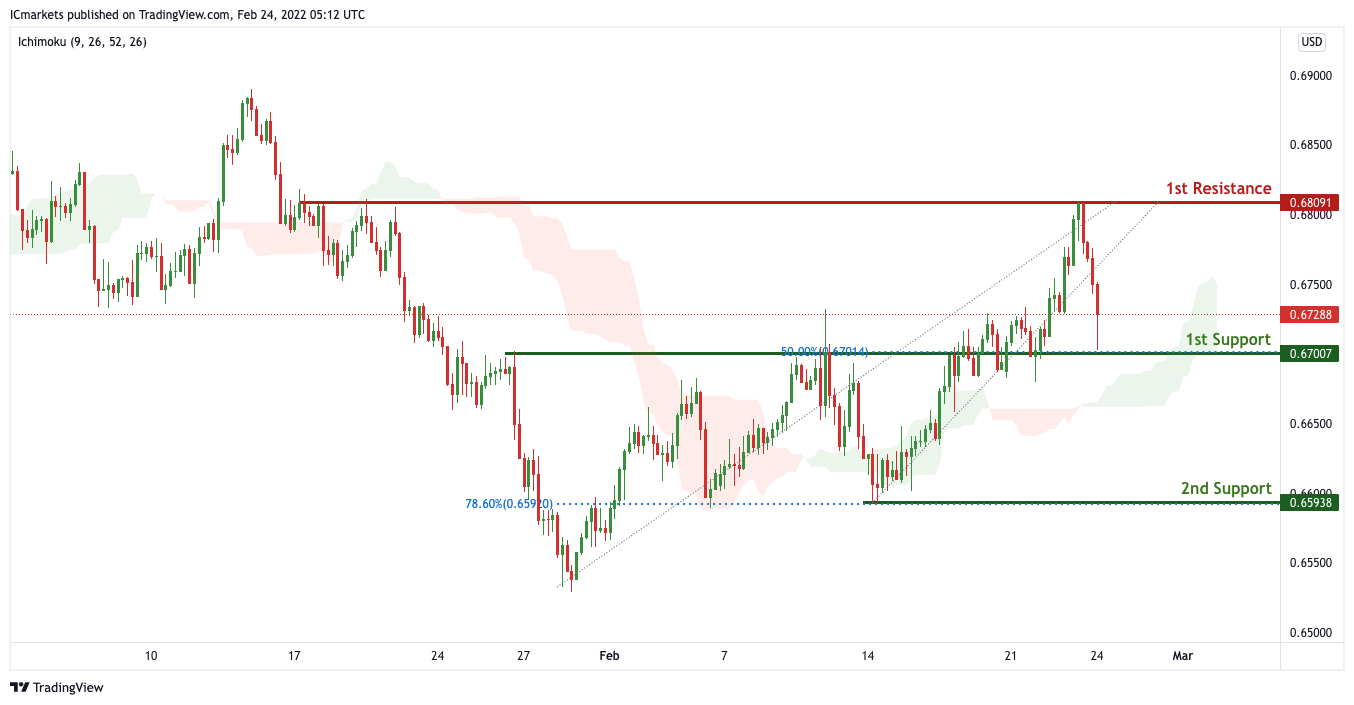
NZD/USD:
On the H4 timeframe, prices are approaching a pivot and are on bullish momentum. We see potential for a bounce from our 1st support at 0.67007 in line with 50% Fibonacci retracement towards 1st resistance at 0.68091 in line with swing high resistance. Prices are trading above our ichimoku cloud support, further supporting our bullish bias. Alternatively, our stop loss will be placed at 0.65938 in line with 78.6% Fibonacci retracement.
Areas of consideration:
- H4 time frame, 1st resistance at 0.68091
- H4 time frame, 1st support at 0.67007
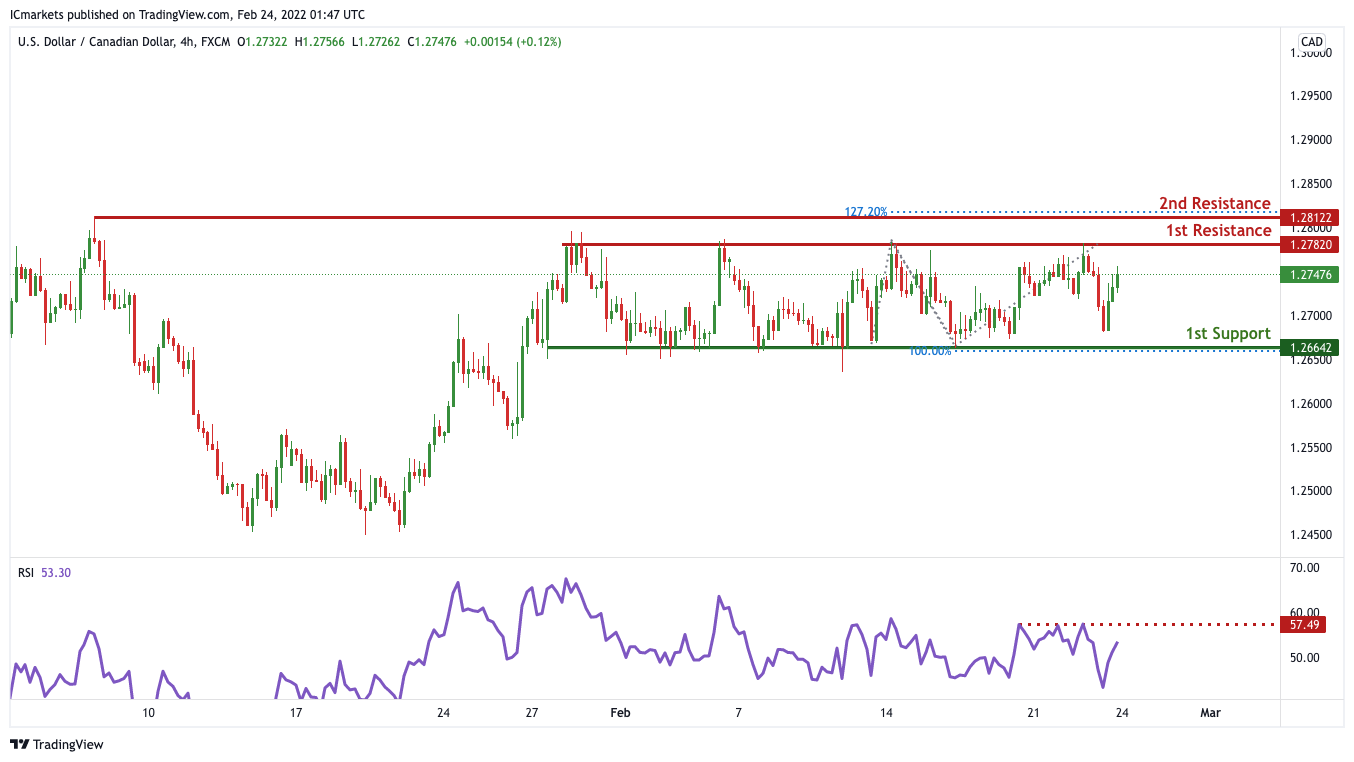
USD/CAD:
On the H4 timeframe, We see the possibility of bearish continuation from our 1st resistance at 1.27820 in line with horizontal swing high resistance towards our 1st support at 1.26642 in line with the 100% Fibonacci extension level. Our bearish bias is further supported by prices reversing off the RSI indicator.
Areas of consideration:
- H4 time frame, 1st support at 1.26642
- H4 time frame, 1st resistance at 1.27820
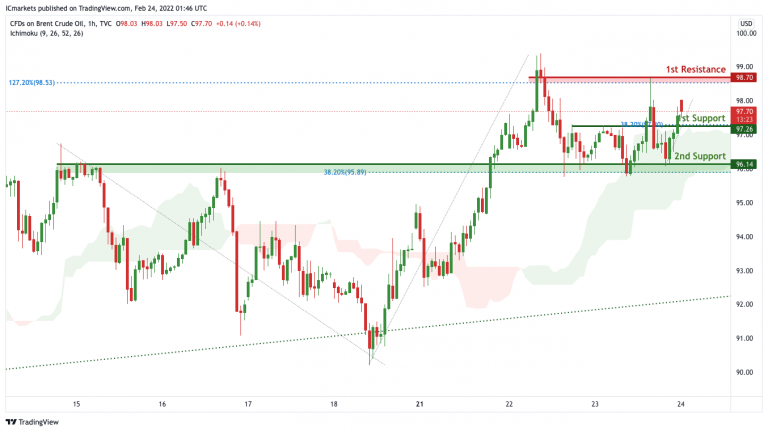
OIL:
On the H4, with price moving above the ichimoku cloud, we can expect bullish continuation from our 1st support at 97.26 in line with 38.2% Fibonacci retracement towards our 1st resistance at 98.70 which is a strong resistance and in line with 127.2% Fibonacci extension. Alternatively, price may break 1st support structure and head for 2nd support, which coincides with the ascending trendline and 38.2% Fibonacci retracement at 96.14.
Areas of consideration:
- H4 time frame, 1st resistance of 98.70
- H4 time frame, 1st support of 97.26
Dow Jones Industrial Average:
On the H4 timeframe, We see the possibility of bearish continuation from our 1st resistance at 33267 in line with horizontal overlap resistance towards our 1st support at 32451 in line with the horizontal swing low support. Alternatively, price may break 1st resistance and head for 2nd resistance at 34355 in line with the 50% Fibonacci retracement level. Our bearish bias is further supported by how price is moving below the ichimoku cloud
Areas of consideration :
- H4 1st support at 34451
- H4 1st resistance at 33767


