
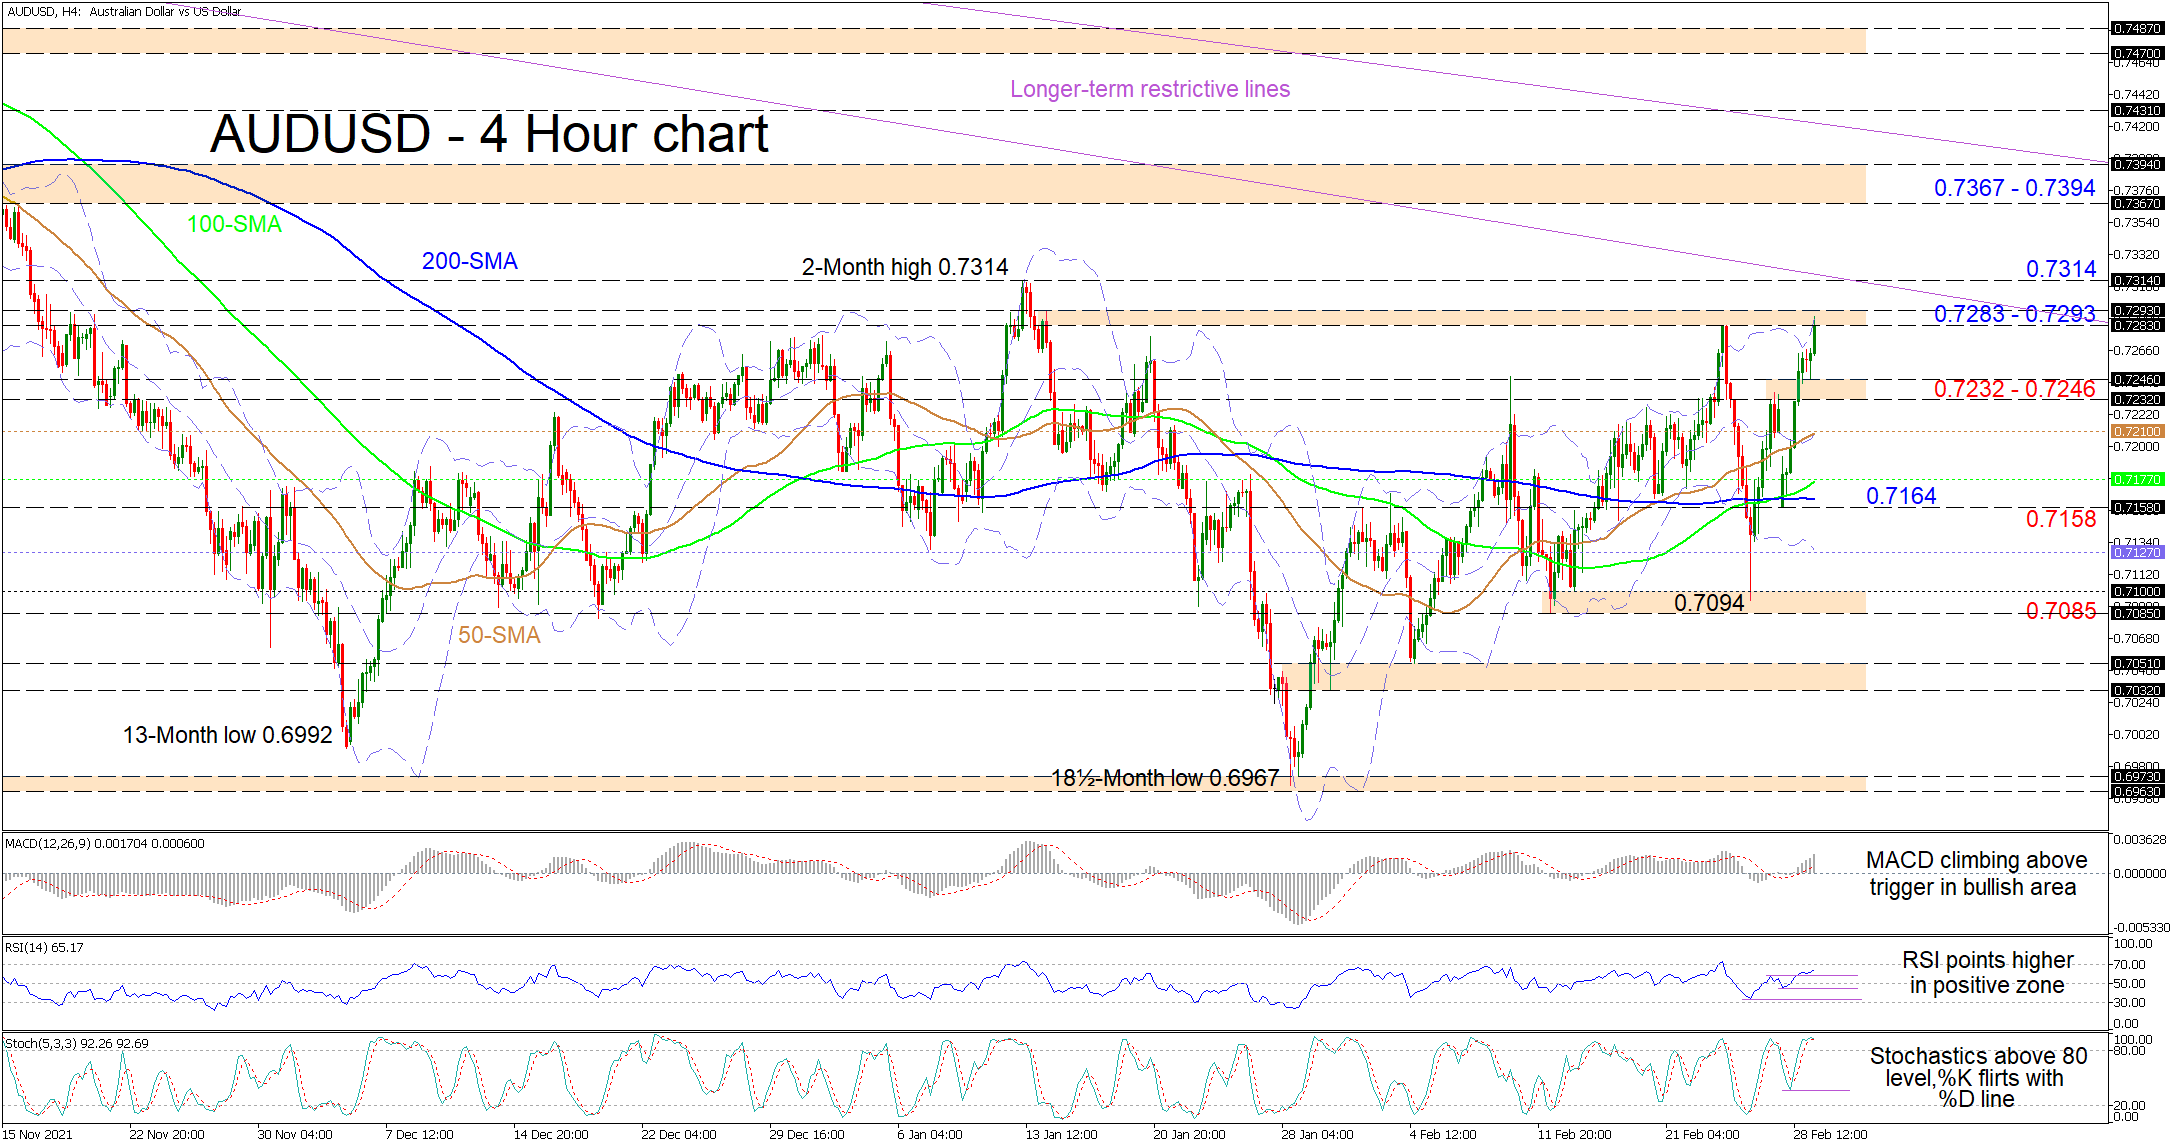
AUDUSD is testing the 0.7283-0.7293 resistance barrier after extending yesterday’s intense rally, which filled a recorded gap in the pair and reinstated the one-month bullish mood that began from the 18½-month low of 0.6967. The rising 50- and 100-period simple moving averages (SMAs) are sponsoring improvements in the pair.
The short-term oscillators are skewed to the upside, reflecting growing positive momentum. The MACD, north of the zero line, is soaring above its red trigger line, while the RSI is improving in the bullish region. The stochastic lines are in overbought territory, and the %K line has yet to hint of any clear fading in bullish forces.
In the positive scenario, buyers are currently tackling the 0.7283-0.7293 obstacle, the former being the February 23 high from where the price collapsed after tensions in Ukraine were reported. In the event the price pierces above this barrier, the bulls may then challenge the 0.7314 nearby high, coupled with the intersecting longer-term restrictive trend line, drawn from the 0.7890 high. Should the bulls overwhelm these resistances too, the price could then propel for the 0.7367-0.7394 resistance zone that extends back to the early part of November 2021, and the second longer-term diagonal line pulled from the 0.8006 peak.
Alternatively, if upside momentum starts to wane around the upper Bollinger band, initial support could transpire from the 0.7232-0.7246 area, before sellers meet the mid-Bollinger band and 50-period SMA, both residing around 0.7210. Fading further, the price could then encounter tough downside constraints in the section between the 100-period SMA at 0.7177 and the 0.7158 trough. From here, should a downward trajectory intensify, sellers may seek out the lower Bollinger band at 0.7127 before pursuing the 0.7085-0.7100 support base.
Summarizing, AUDUSD exhibits a persisting bullish bias in the very short-term and a climb beyond the longer-term diagonal barriers could put pressure on the one-year broader bearish structure. For negative forces to start to clearly regain strength, the price would need to retreat below the 0.7085-0.7100 boundary.


