
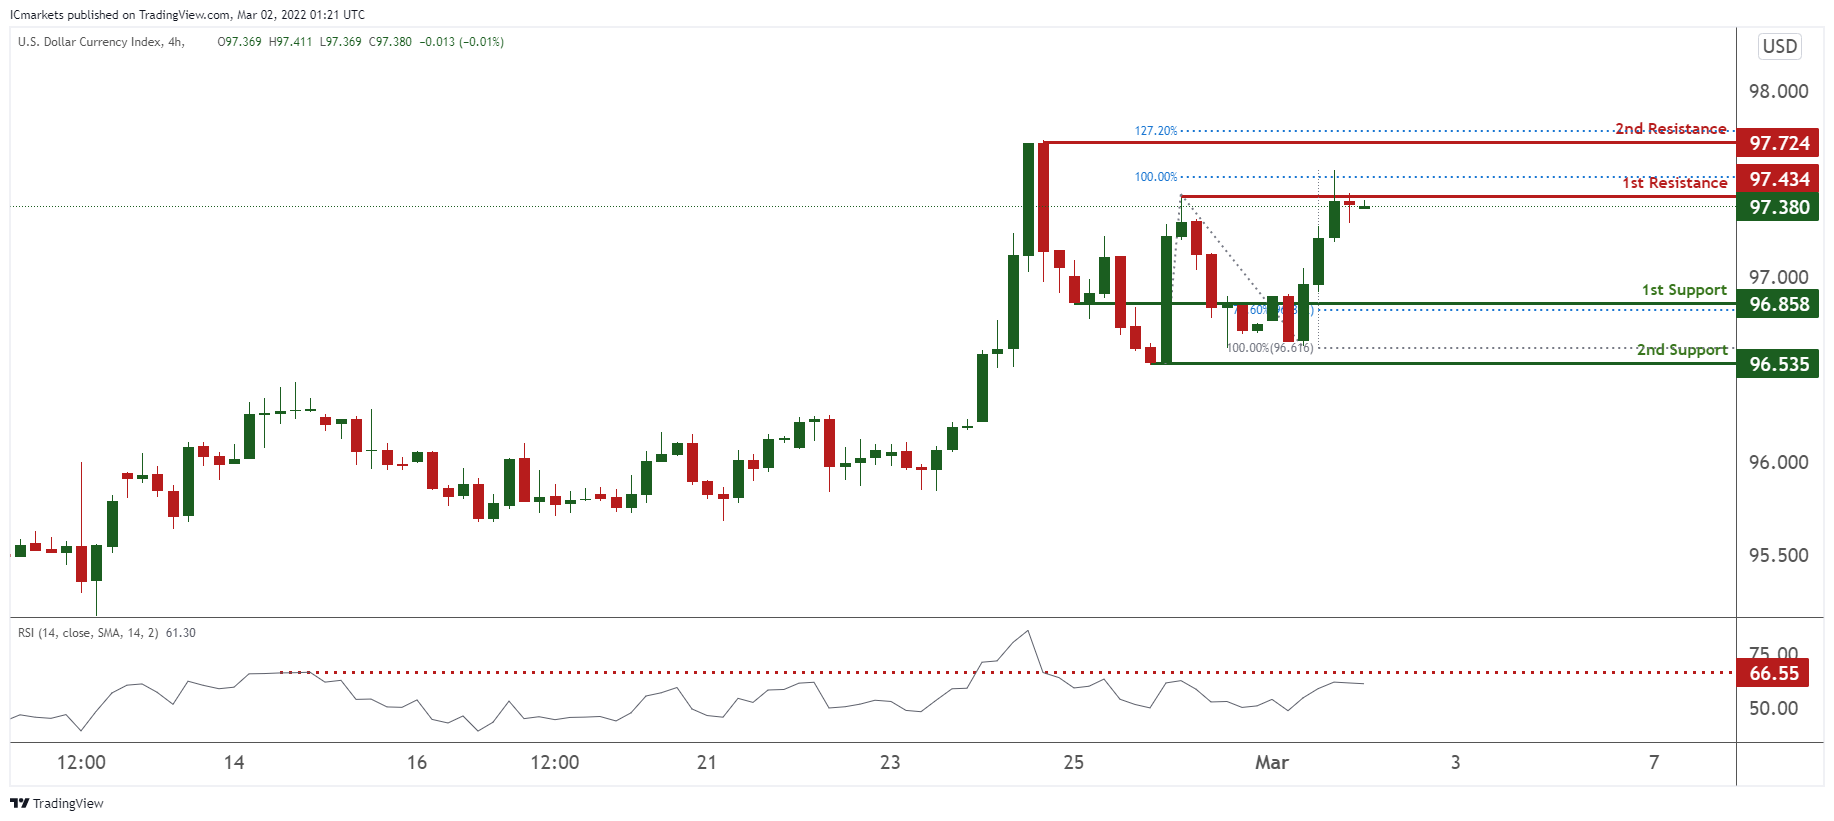
DXY:
On the H4 timeframe, prices are at pivot and in line with a recent swing high. We see the potential for a dip from our 1st resistance at 97.434 in line with 100% Fibonacci extension towards our 1st support at 96.858 in line with 78.6% Fibonacci retracement. RSI is at a level where dips occurred previously and further supporting our bearish bias.
Areas of consideration:
- H4 time frame, 1st resistance at 97.434
- H4 time frame, 1st support at 96.858
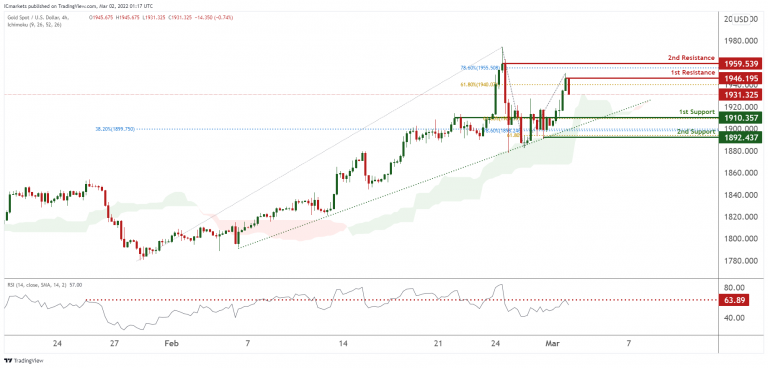
XAU/USD (GOLD):
On the H4 chart, prices areon bullish momentum and abiding to our ascending trendline support. We see potential for a slight pullback from our 1st resistance at 1946.195 in line with 61.8% Fibonacci extension towards our 1st support at 1910.357 in line with 61.8% Fibonacci retracement. Our bullish bias is further supported by RSI being at levels where dips occurred previous and ichimoku clouds forecasting bearish momentum.
Areas of consideration:
- 4h 1st support at 1910.357
- 4h 1st resistance at 1946.195
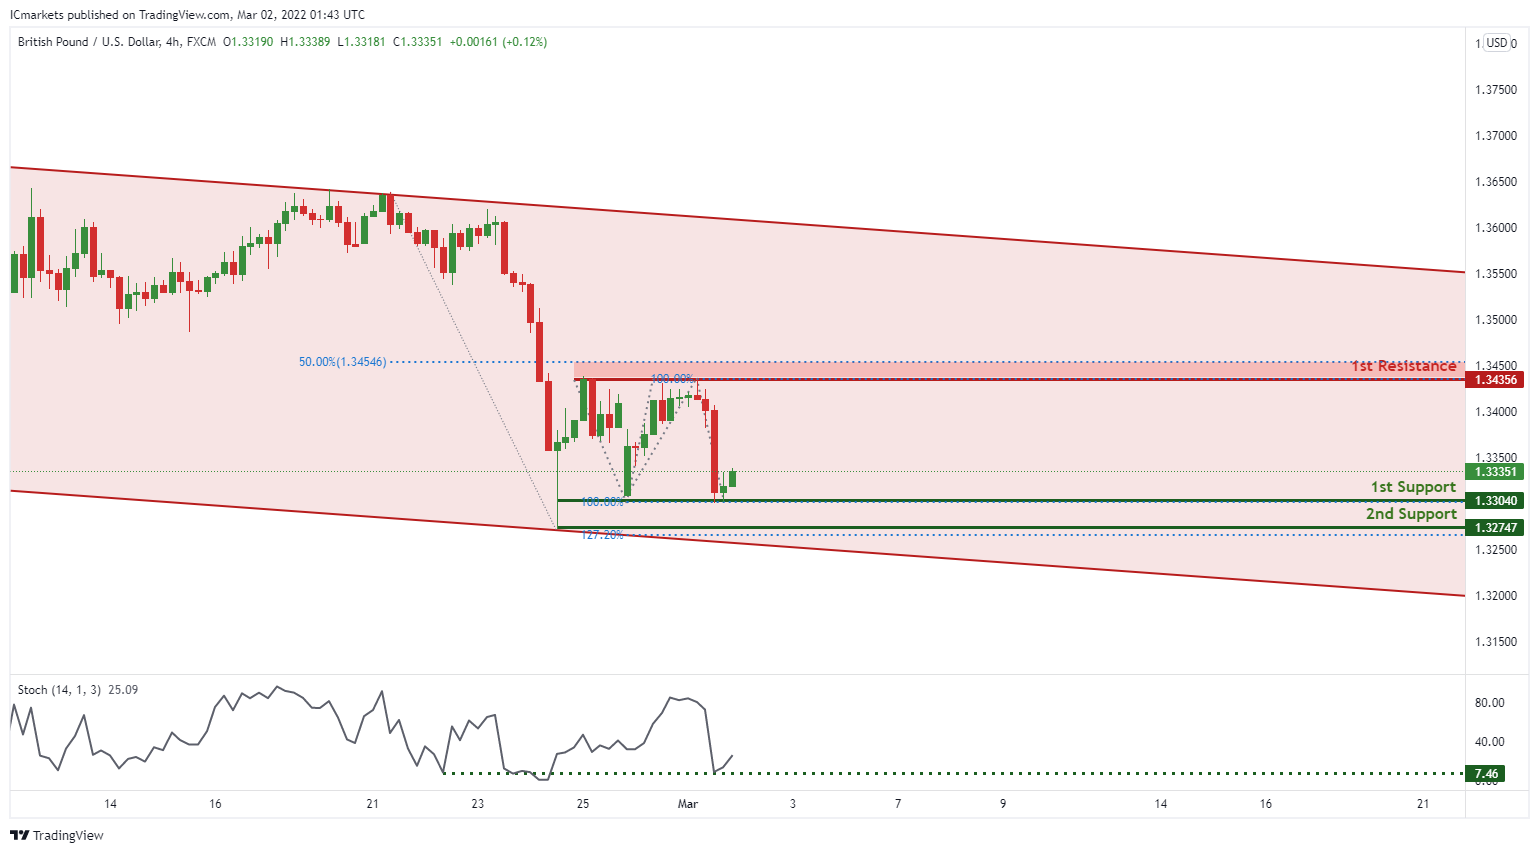
GBP/USD
On the H4 chart , price is trading in a descending channel and near 1st support level of 1.33040 in line with 100% Fibonacci projection. Price can potentially go to the 1st resistance level of 1.34356 in line with 50% Fibonacci retracement and 100% Fibonacci projection. Our bearish bias is supported by stochastic indicator as it is nears support level
Areas of consideration
- H4 1st resistance at 1.34356
- H4 1st support at 1.33040
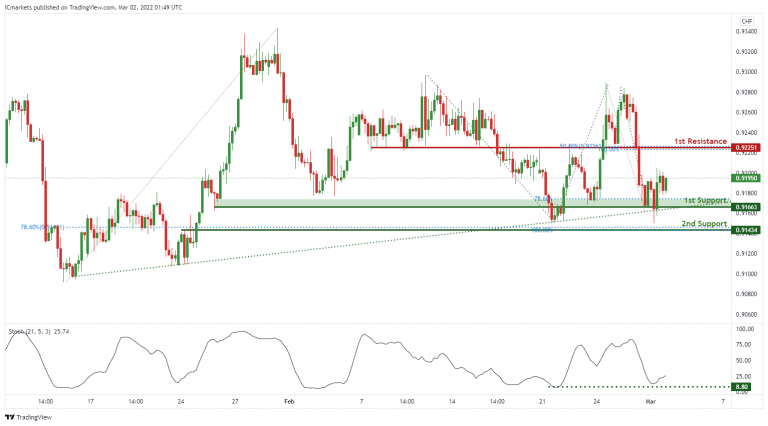
USD/CHF:
On the H4, price is abiding by an ascending trendline and near 1st support level of 0.91663 in line with 78.% Fibonacci projection. Price can potentially bounce to the 1st resistance level of 0.92251 in line with 50% Fibonacci retracement and 100% Fibonacci projection. Our bullish bias is supported by the stochastic indicator as it is at support level.
Areas of consideration
- 1st support level at 0.91663
- 1st resistance level at 0.92251
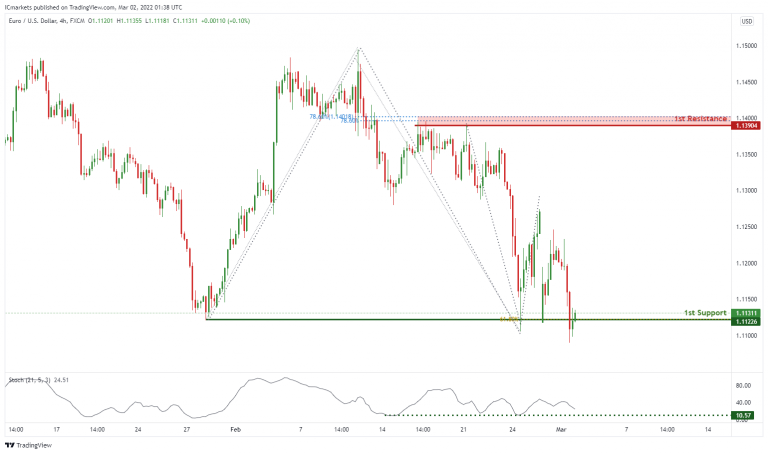
EUR/USD :
On the H4 chart price is near 1st support level of 1.11226 in line with 61.8% Fibonacci projection. Price can potentially go to the 1st resistance level of 1.13904 in line with 78.6% Fibonacci retracement and 78.6% Fibonacci projection. Our bullish bias is supported by the stochastic indicator as it is near support level.
Areas of consideration :
- H4 1st support at 1.11226
- H4 1st resistance at 1.13904
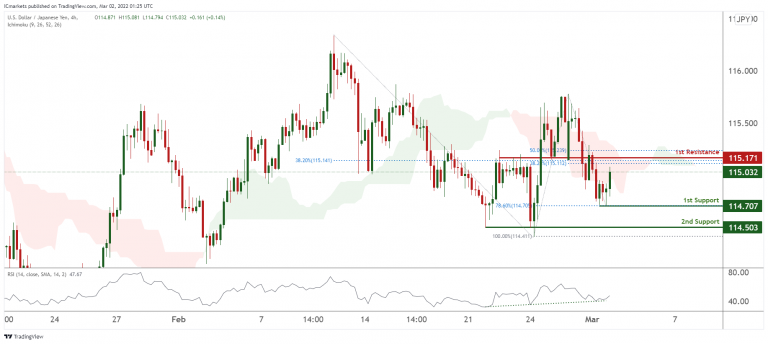
USD/JPY
On the H4 timeframe, prices have recently bounced off a strong graphical overlap and also 1st support. We see the potential for further bullish continuation from our 1st support at 115.707 in line with 78.6% Fibonacci retracement towards our 1st resistance at 115.171 which is an area of Fibonacci confluences. Our bullish bias is further supported by ichimoku forecasting green clouds and RSI showing bullish momentum.
Areas of consideration:
- H4 time frame, 1st resistance at 115.171
- H4 time frame, 1st support at 115.707
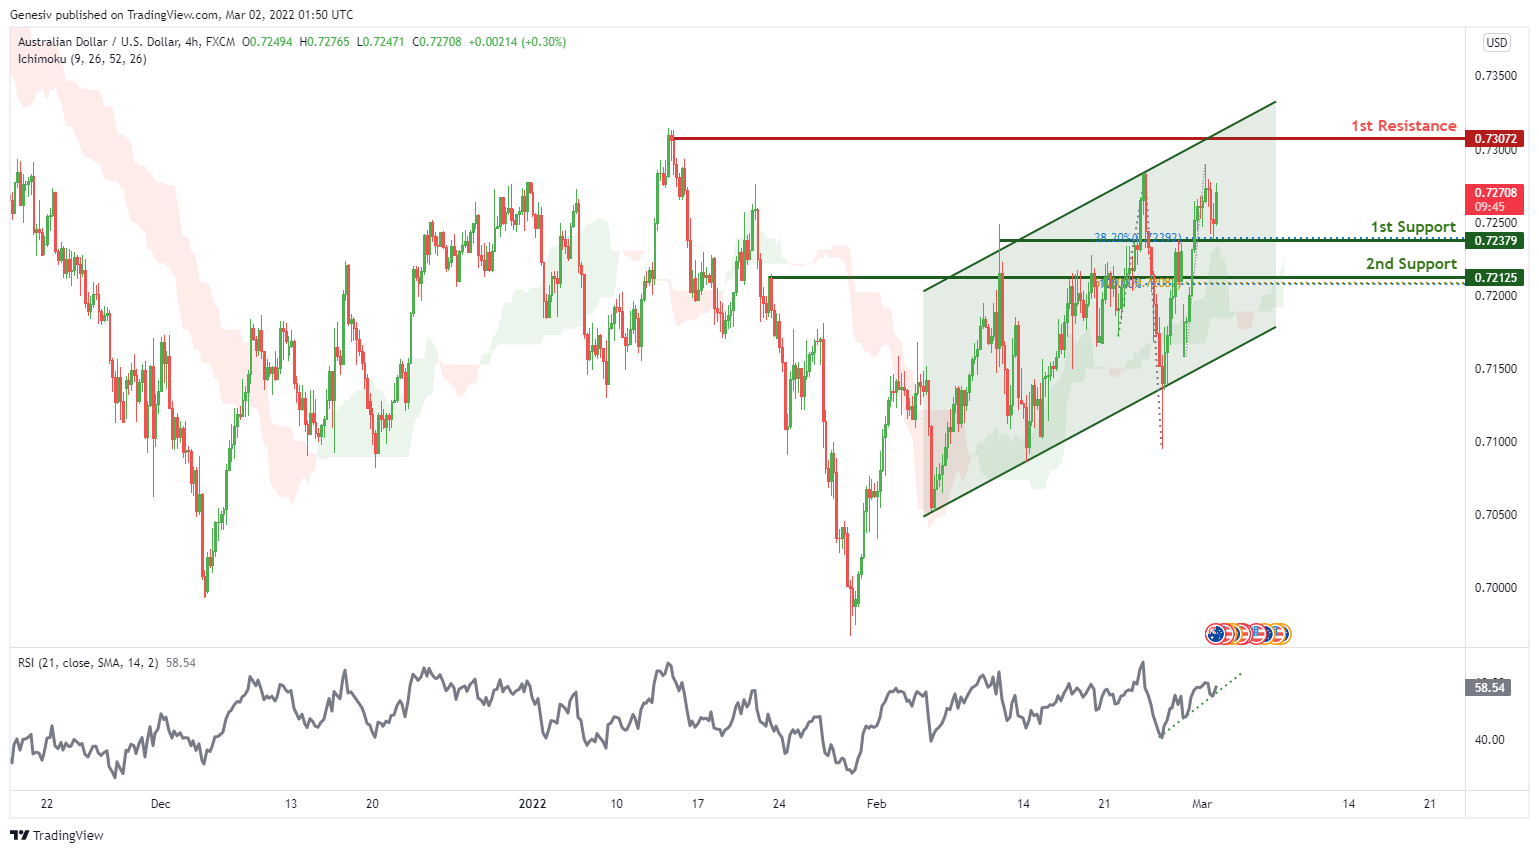
AUD/USD:
On the H4 chart, prices are moving along the ascending channel. We see potential for a bullish continuation from our 1st support at 0.72379 in line with 38.2% Fibonacci retracement and towards our 1st resistance at 0.73072 which is also the graphical swing high level . Alternatively, price can potentially dip to the 2nd support level at 0.72125 in line with 61.8% Fibonacci retracement and 100% Fibonacci projection. Our bullish bias is further supported by RSI as it is abiding by an ascending trendline thus showing bullish momentum . Moreover our bias is further supported by the ichimoku cloud indicator as price is trading above the clouds.
Areas of consideration :
- H4 1st support at 0.72379
- H4 1st resistance at 0.73072
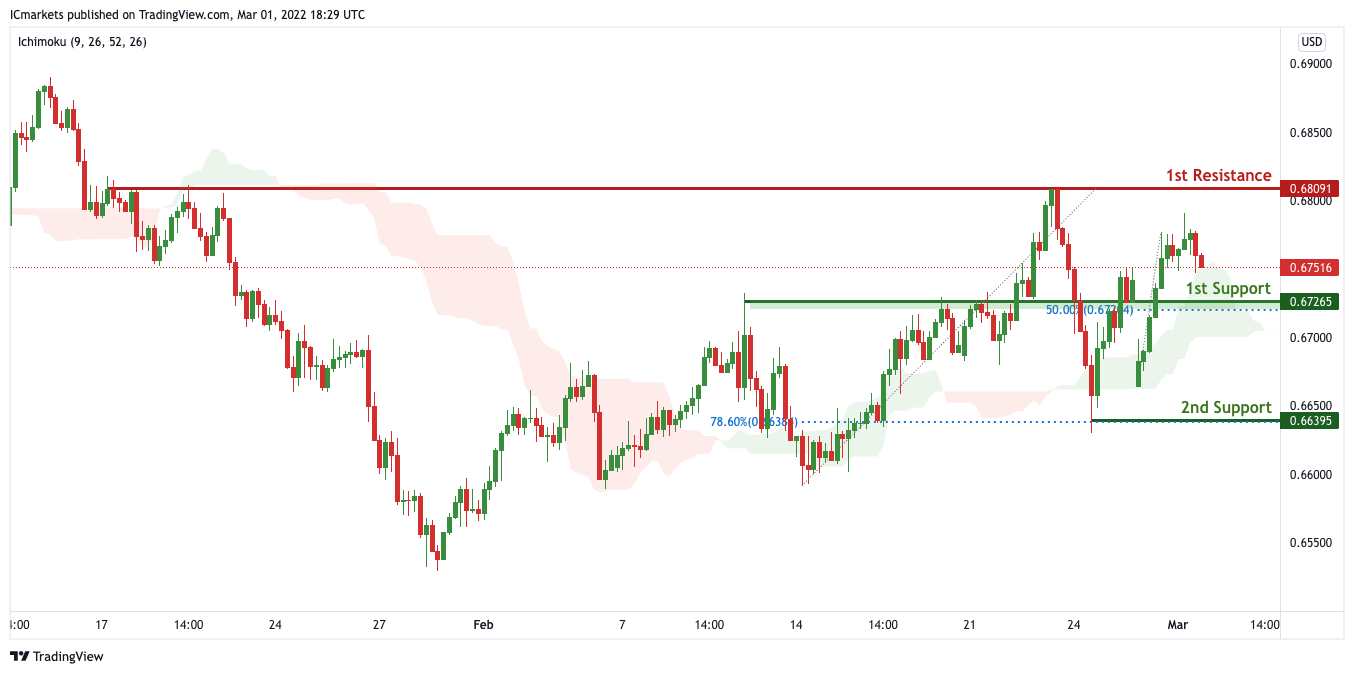
NZD/USD:
On the H4 chart, price is near 1st support level of 0.67265 in line with horizontal overlap support. Price can potentially rise to the 1st resistance level of 0.68091 in line with the horizontal swing high resistance. Alternatively, price may break 1st support and head for 2nd support at 0.66395. Our bullsh bias is supported by how price is expected to bounce off the support of the ichimoku cloud.
Areas of consideration:
- H4 time frame, 1st resistance at 0.68091
- H4 time frame, 1st support at 0.67265
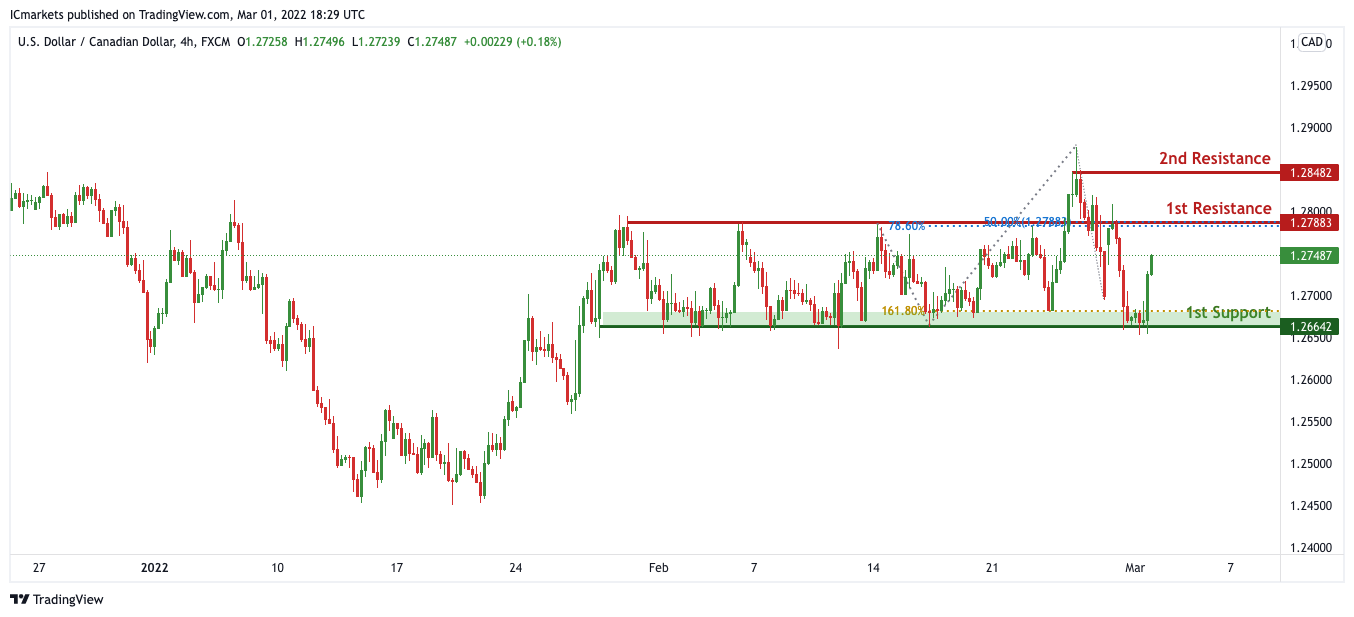
USD/CAD:
On the H4, price is ranging in between our 1st support and 1st resistance. With no clear indication of where price is heading at this current juncture, We have a bias that price will continue to range within our support and resistance of 1.26642 and 1.27883 respectively.
Areas of consideration:
- H4 time frame, 1st support at 1.26642
- H4 time frame, 1st resistance at 1.27883
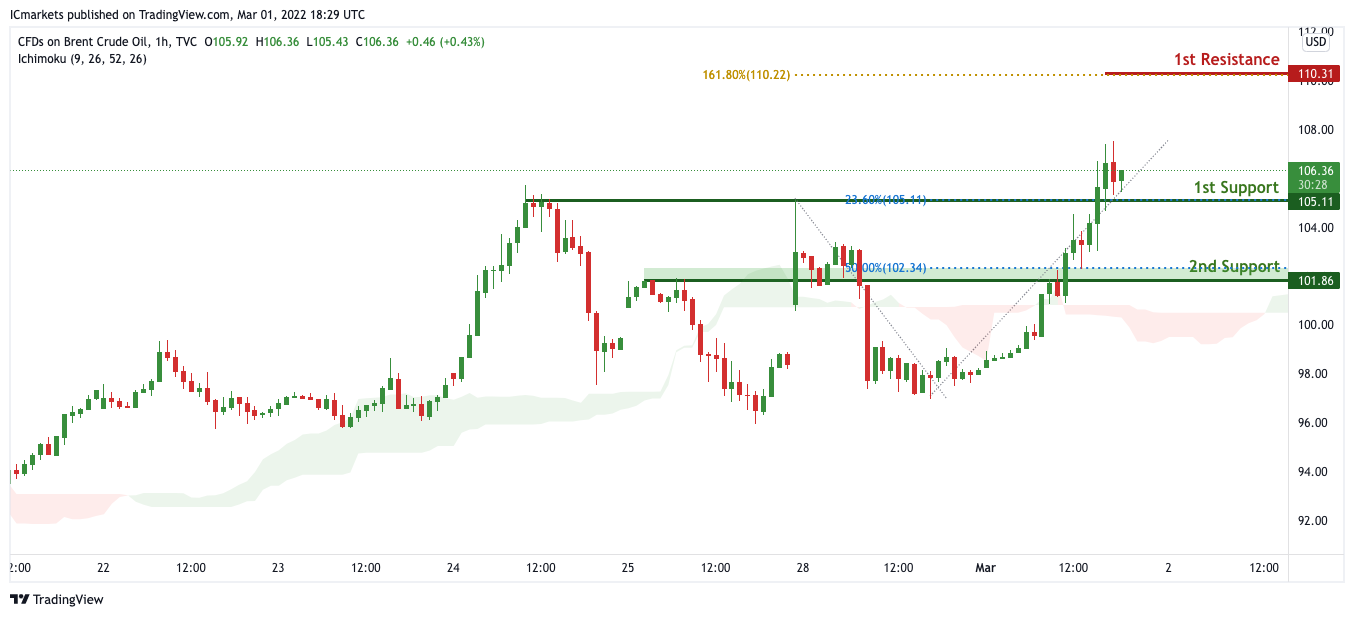
OIL:
On the H4 chart, price is near 1st support level of 105.11 in line with horizontal overlap support and 23.6% Fibonacci retracement. Price can potentially rise to the 1st resistance level of 110.31 in line with the 161.8% Fibonacci extension level. Alternatively, price may break 1st support and head for 2nd support at 101.86. Our bullsh bias is supported by how price is expected to bounce off the support of the ichimoku cloud.
Areas of consideration:
- H4 time frame, 1st resistance of 110.31
- H4 time frame, 1st support of 105.11
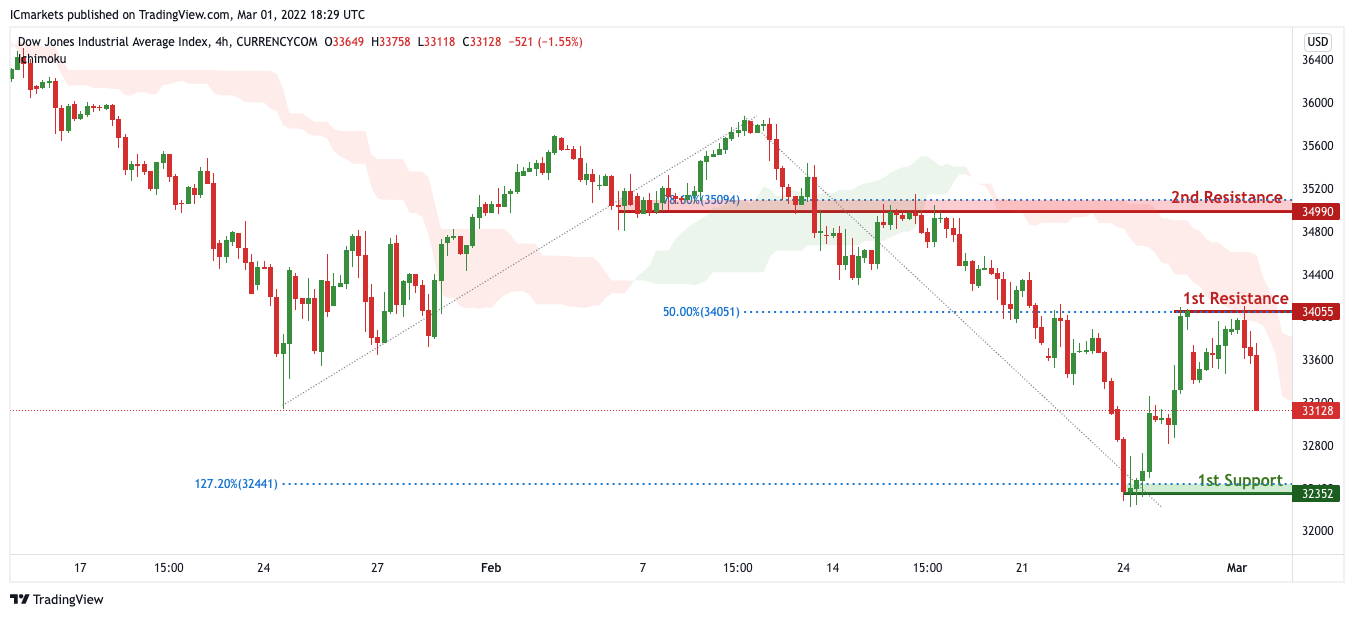
Dow Jones Industrial Average:
On the H4 timeframe, We see the possibility of bearish continuation from our 1st resistance at 34055 in line with horizontal overlap resistance towards our 1st support at 32352 in line with the horizontal swing low support. Alternatively, price may break 1st resistance and head for 2nd resistance at 34990 in line with the 78.6% Fibonacci retracement level. Our bearish bias is further supported by how price is moving below the ichimoku cloud
Areas of consideration :
- H4 1st support at 32352
- H4 1st resistance at 34055


