
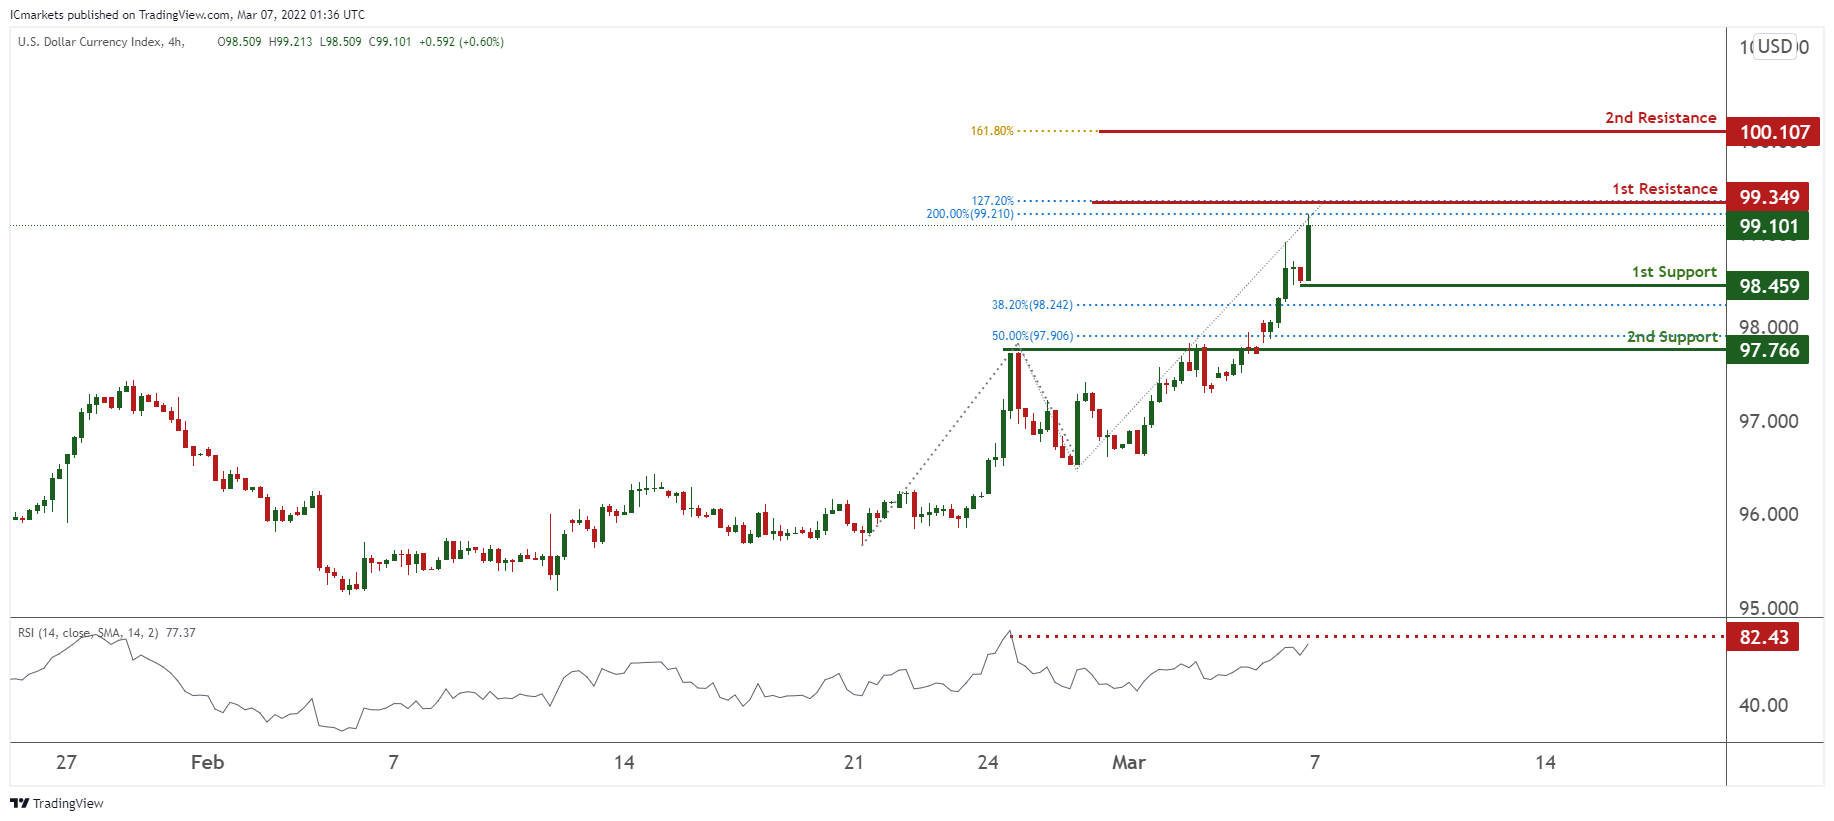
DXY:
On the H4 timeframe, prices are at a recent high and approaching our pivot. We see the potential for a pullback from our 1st resistance at 99.349 in line with 127.2% Fibonacci extension and 200% Fibonacci Projection towards our 1st support at 98.459 in line with 38.2% Fibonacci retracement. RSI is at levels where dips previously occurred, further supporting our bearish bias.
Areas of consideration:
- H4 time frame, 1st resistance at 99.349
- H4 time frame, 1st support at 98.459
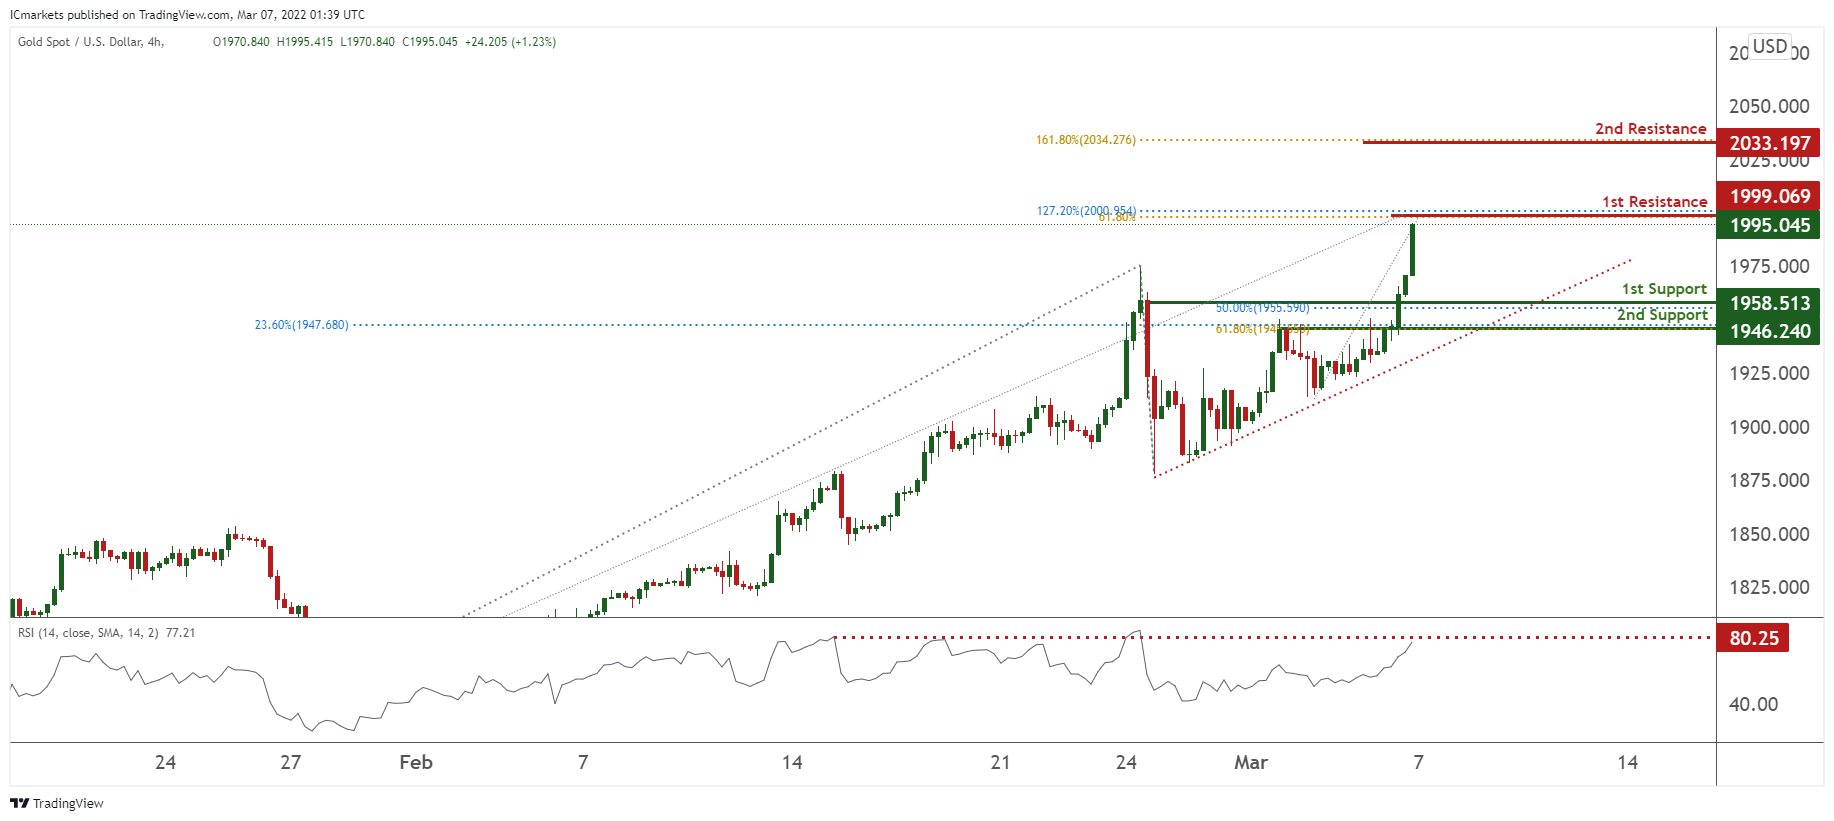
XAU/USD (GOLD):
On the H4 chart, prices are on strong bullish momentum and abiding to our ascending trendline support. We see potential for prices to dip from our 1st resistance at 1999.069 in line with 61.8% Fibonacci extension and 127.2% Fibonacci Projection towards our 1st support at 1958.513 in line with 50% Fibonacci retracement. RSI is at levels where dips previously occurred, further supporting our bearish bias.
Areas of consideration:
- 4h 1st support at 1958.513
- 4h 1st resistance at 1999.069
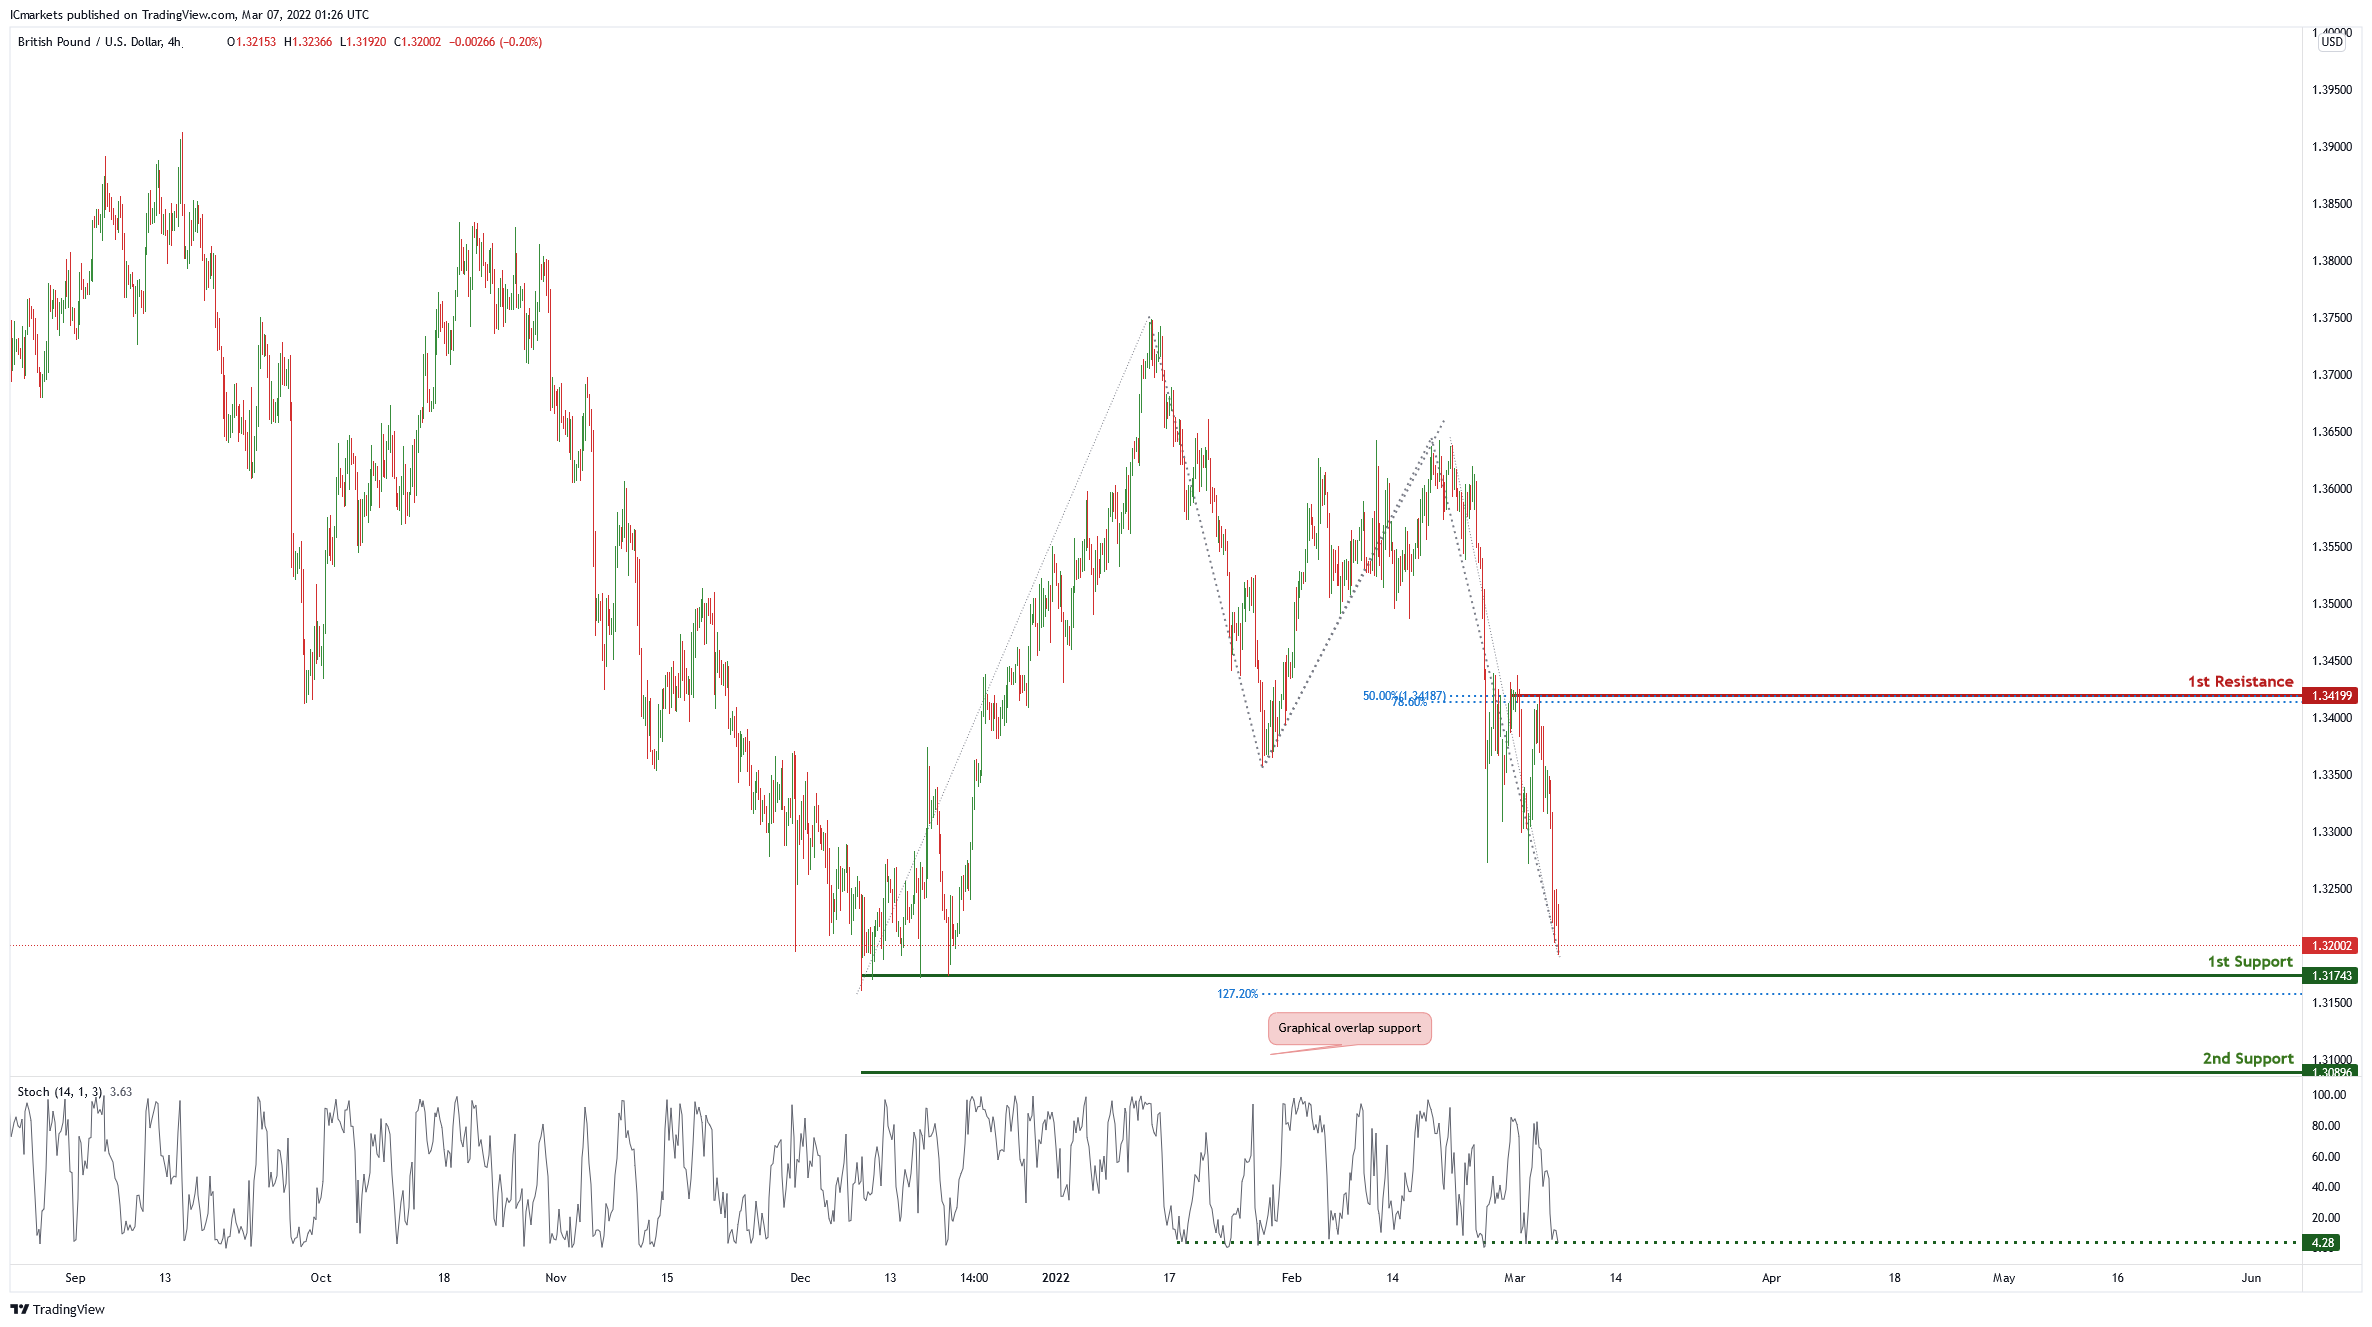
GBP/USD:
On the H4 chart price is near 1st support level of 1.131743 in line with 127.2% Fibonacci projection and graphical swing low. Price can potentially bounce from 1st support to 1st resistance level of 1.34199 in line with 50% Fibonacci retracement and 78.6% Fibonacci projection. Our bullish bias is supported by stochastic as it is a support level
Areas of consideration
- H4 1st resistance at 1.34199
- H4 1st support at 1.31743
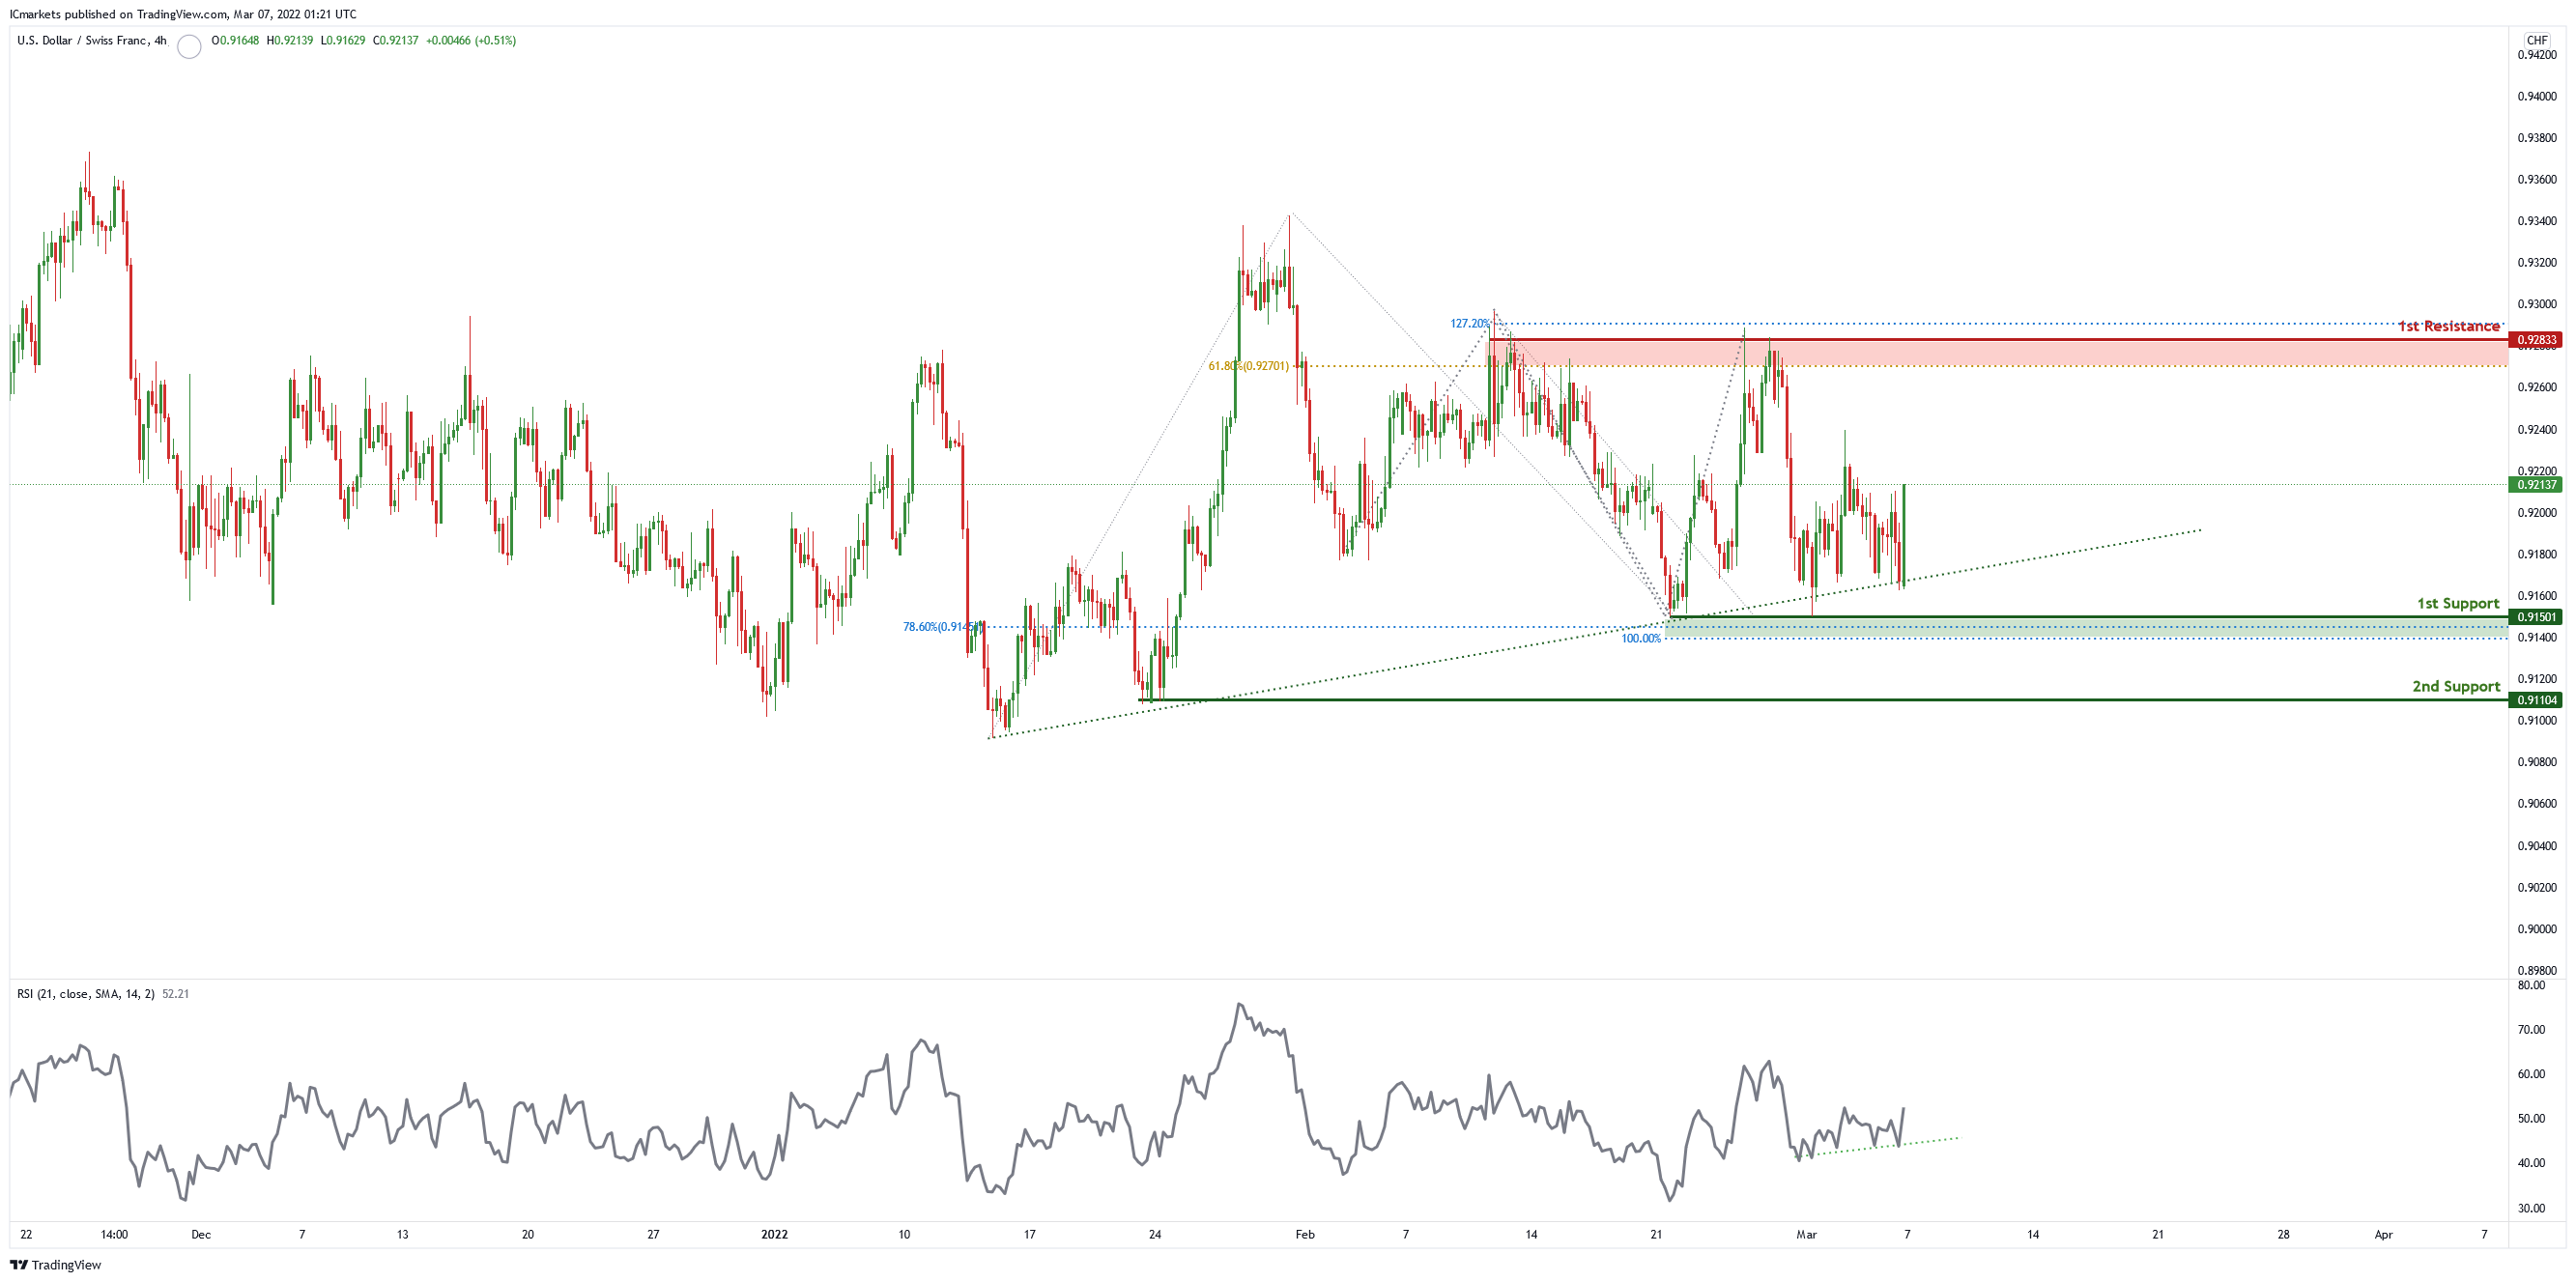
USD/CHF:
On the H4, price is abiding by an ascending trendline and near 1st support level of 0.91501 in line with 78.% Fibonacci retracement and 100% Fibonacci projection. Price can potentially bounce to the 1st resistance level of 0.92251 in line with 61.8% Fibonacci retracement and 127% Fibonacci projection. Our bullish bias is supported by the stochastic indicator as it is at support level.
Areas of consideration
- 1st support level at 0.91501
- 1st resistance level at 0.92833
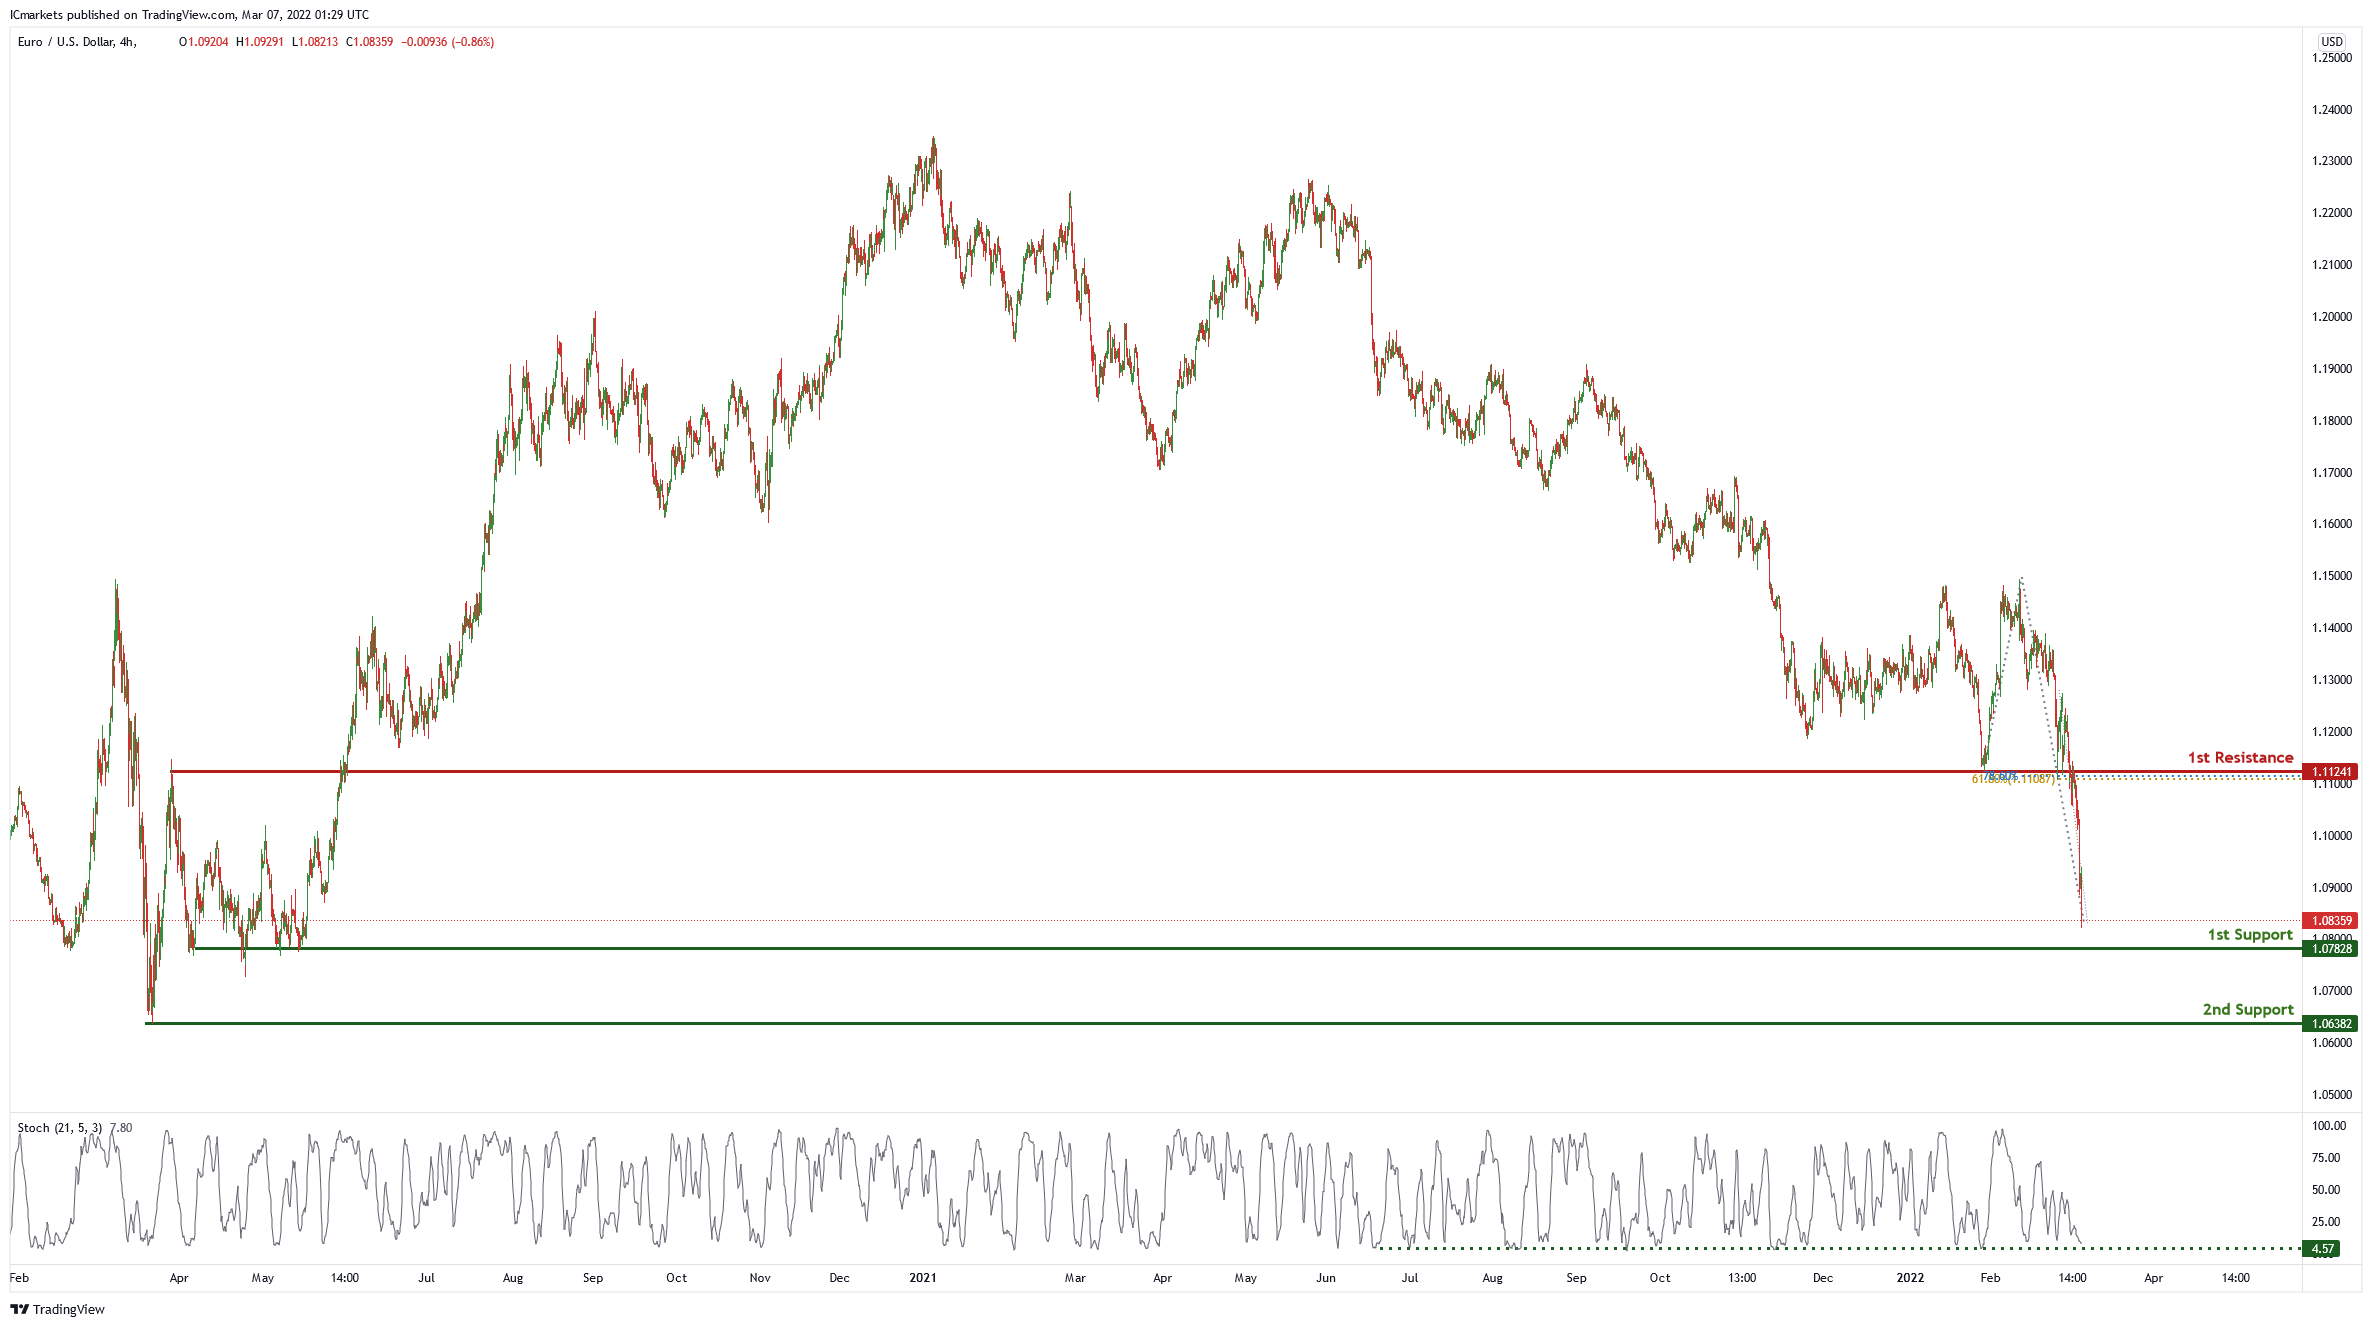
EUR/USD :
On the H4 chart price is near 1st support level of 1.07828 in which is also the graphical overlap support. Price can potentially bounce from this support level to 1st resistance of 1.11241 in line with 78.6% Fibonacci projection and 61.8% Fibonacci retracement. Our bullish bias is supported by the stochastic indicator as it is at support level.
Areas of consideration :
- H4 1st resistance at 1.11241
- H4 1st support at 1.07828
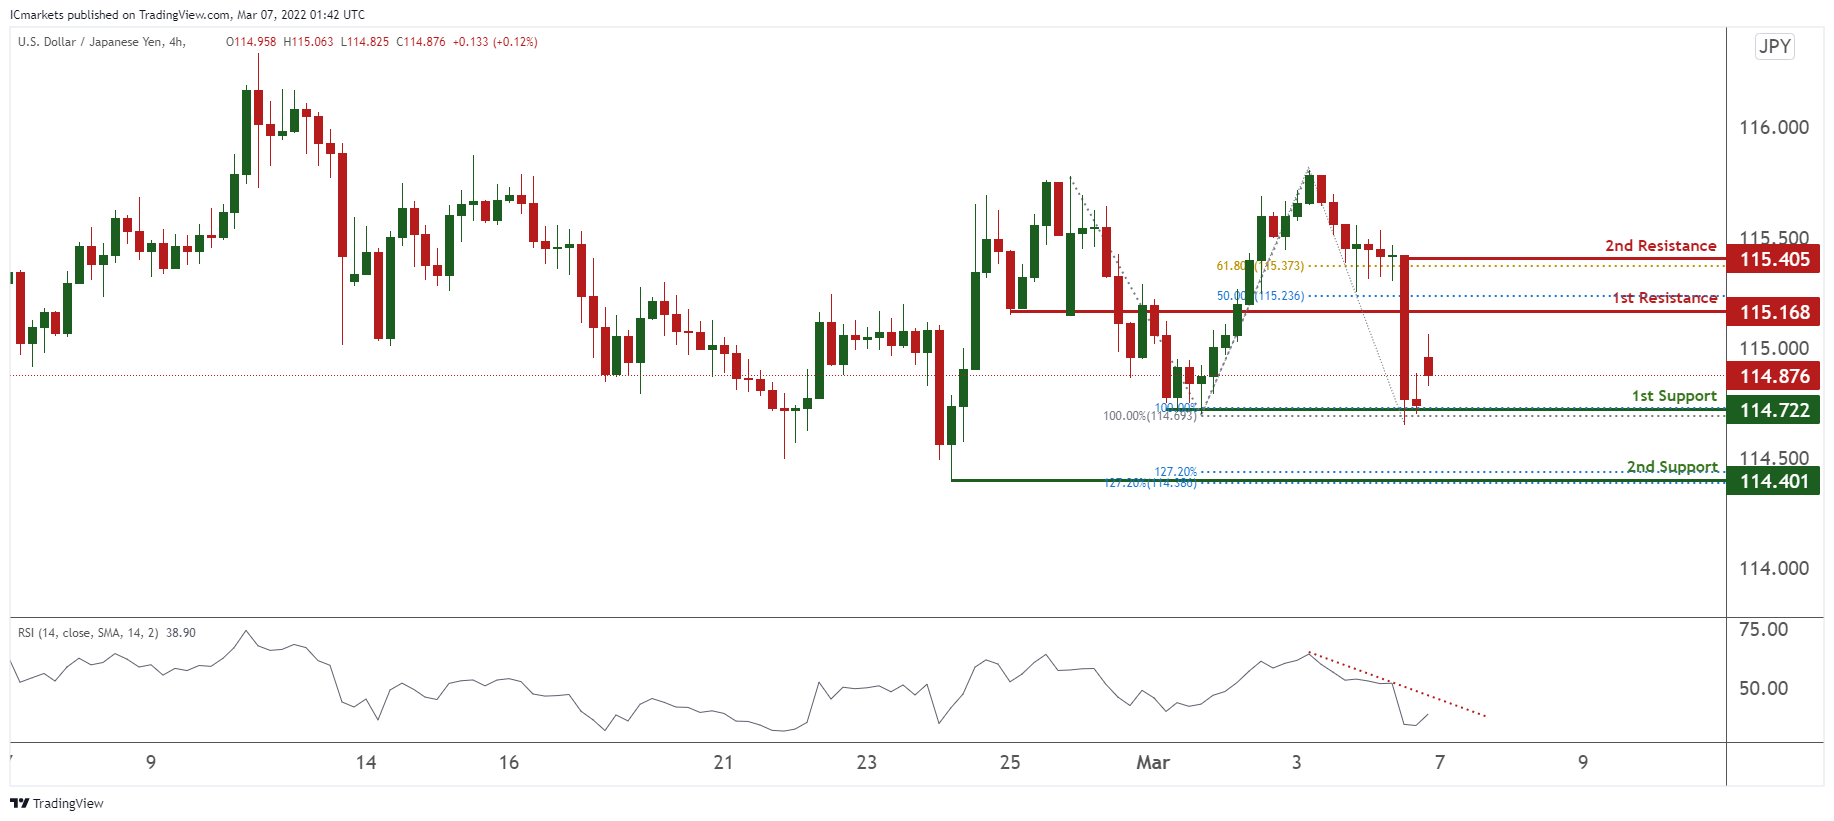
USD/JPY:
On the H4 timeframe, prices are forming a potential double top. We see the potential for further bearish momentum from our 1st resistance at 115.168 in line with 50% Fibonacci retracement towards our 1st support at 114.722 which is in line with 100% Fibonacci retracement and 100% Fibonacci extension. Our bearish bias is RSI being on bearish momentum.
Areas of consideration:
- H4 time frame, 1st resistance at 115.168
- H4 time frame, 1st support at 114.722
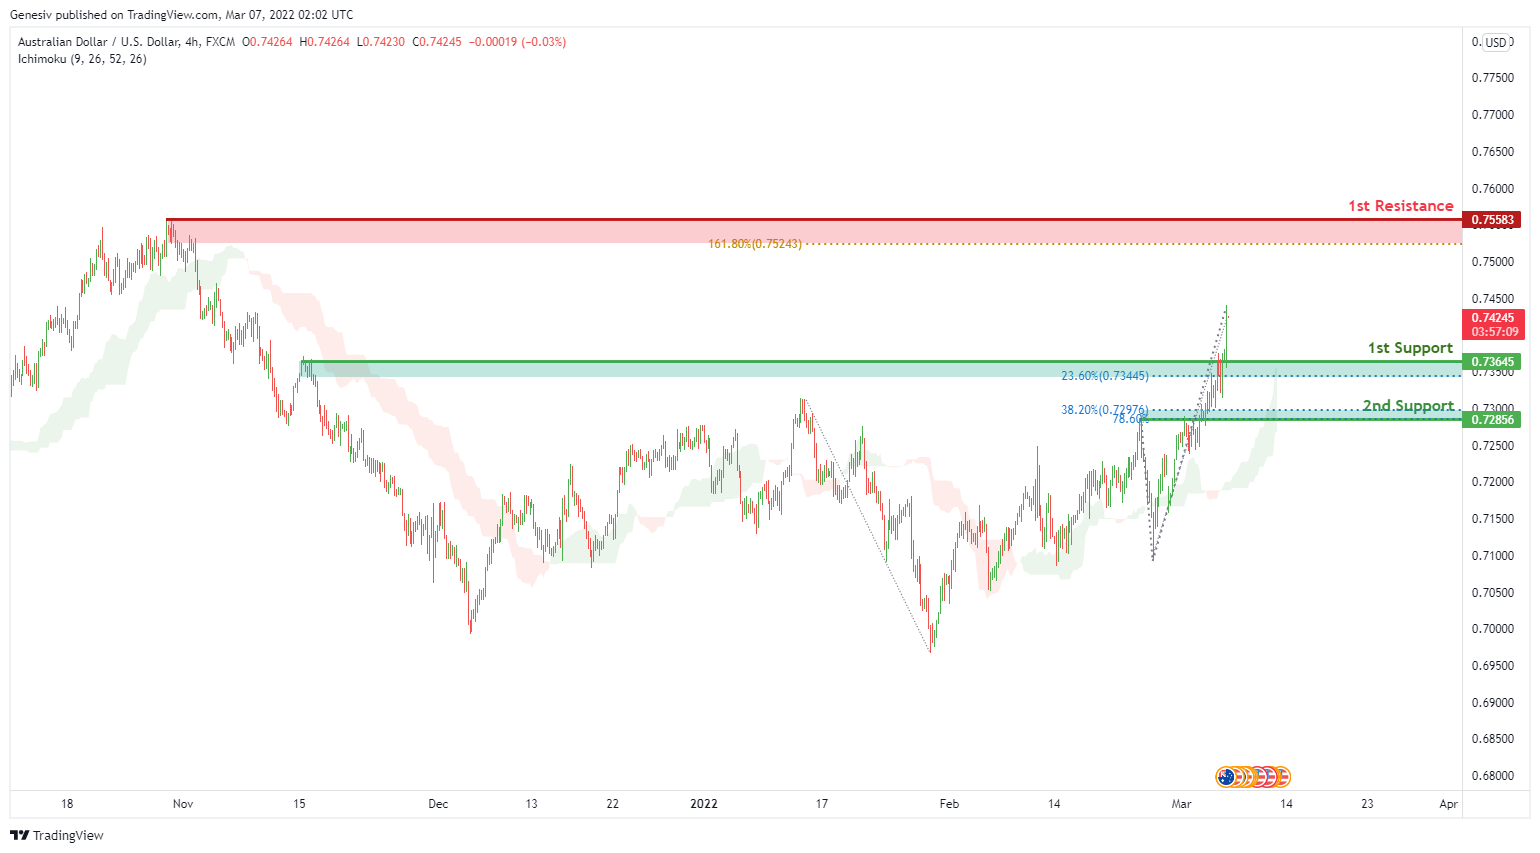
AUD/USD:
On the H4 timeframe, we see the potential for further bullish momentum from our 1st support at 0.73645 in line with 23.6% Fibonacci retracement towards our 1st resistance at 0.75583. which is in line with 161.8% Fibonacci extension. Our bullish bias is further supported by prices trading above the Ichimoku cloud. Alternatively, prices from 1st support might dip to 2nd support at 0.72856 in line with 38.2% Fibonacci retracement and 78.6% Fibonacci projection.
Areas of consideration :
- H4 1st support at 0.73645
- H4 1st resistance at 0.72856
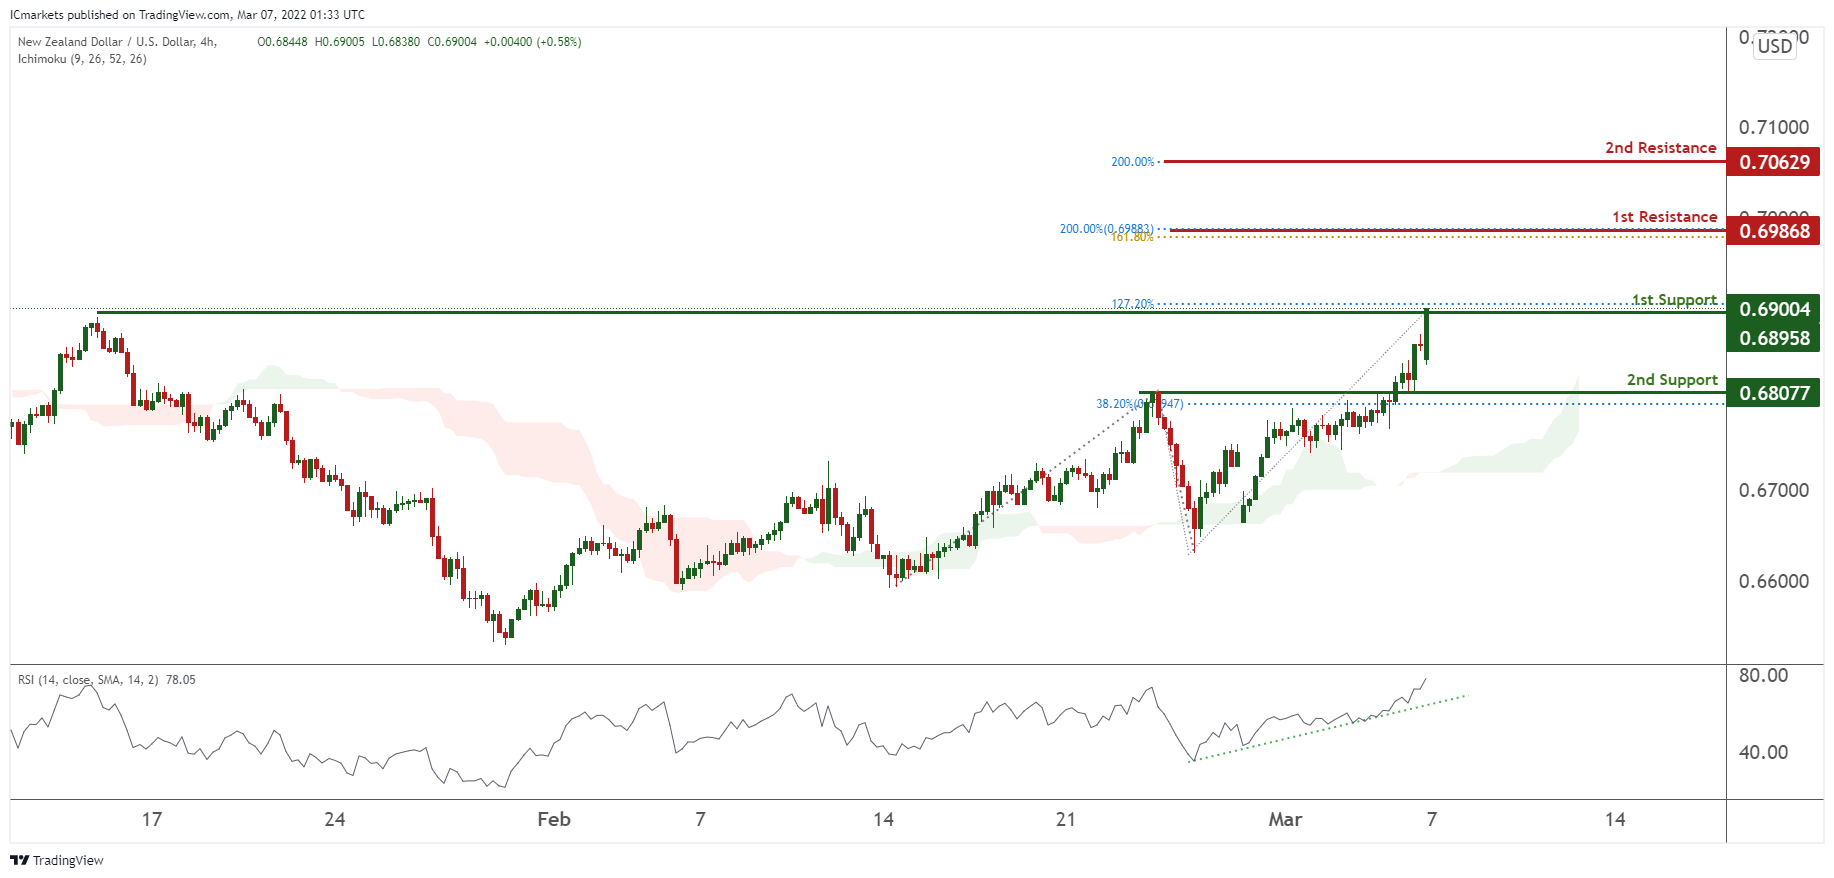
NZD/USD:
On the H4 chart, prices are on bullish momentum. We see the potential for further bullish momentum from our 1st support at 0.69004 in line with 127.2% Fibonacci extension towards our 1st resistance at 0.69868 in line with 161.8% Fibonacci Projection and 200% Fibonacci Projection. Our bullish bias is further supported by prices trading above our ichimoku cloud support and also RSI being on bullish momentum. Alternatively, prices may dip towards our 2nd support at 0.68077 in line with 38.2% Fibonacci retracement.
Areas of consideration:
- H4 time frame, 1st resistance at 0.69868
- H4 time frame, 1st support at 0.69004
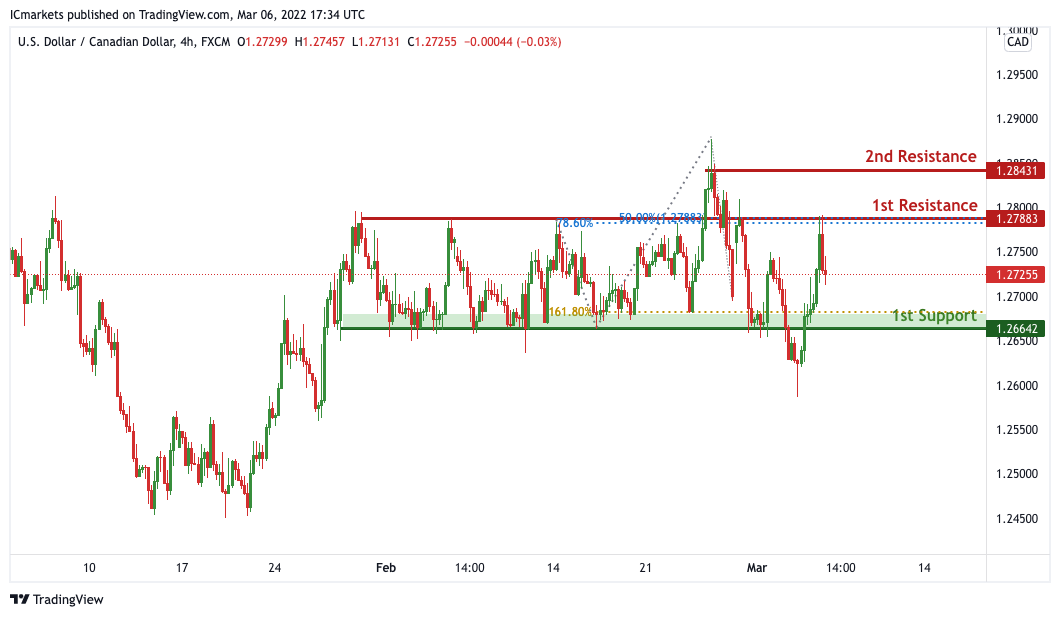
USD/CAD:
On the H4, with price having no clear indication of where it’s headed for, we have a bias that price will continue to range within our support and resistance of 1.27883 and 1.26642.
Areas of consideration:
- H4 time frame, 1st support at 1.26642
- H4 time frame, 1st resistance at 1.27883
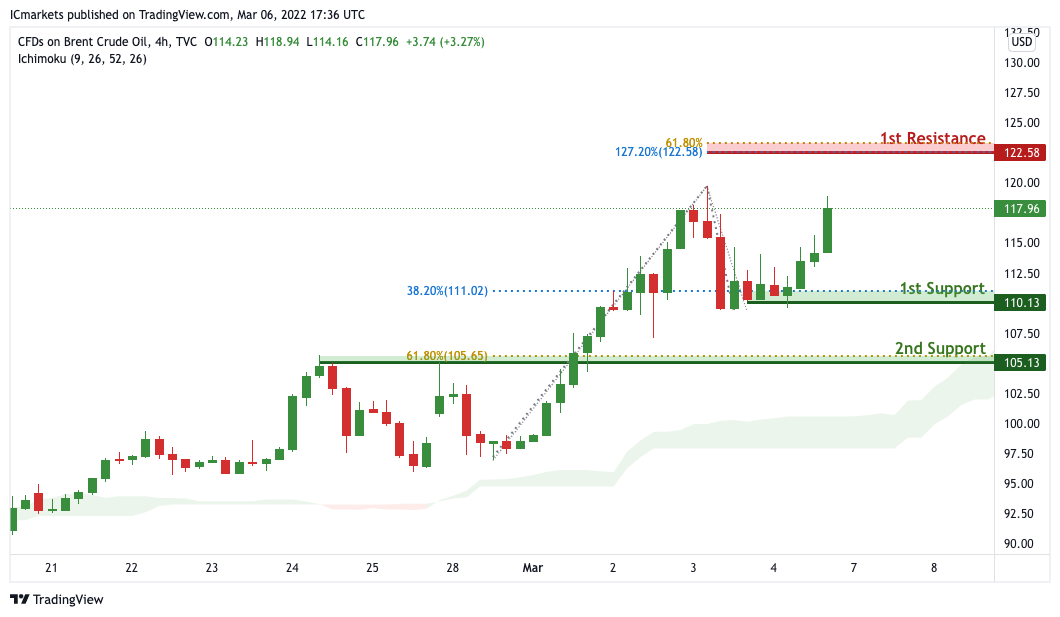
OIL:
On the H4 timeframe, price is near 1st support level of 110.13 in line with horizontal overlap support and 38.2% Fibonacci retracement. Price can potentially rise to the 1st resistance level of 122.58 in line with the 127.2% Fibonacci extension and 61.8% Fibonacci projection. Alternatively, price may break 1st support and head for 2nd support at 105.13. Our bullsh bias is supported by how price is moving above the ichimoku cloud.
Areas of consideration:
- H4 time frame, 1st resistance of 122.58
- H4 time frame, 1st support of 106.99
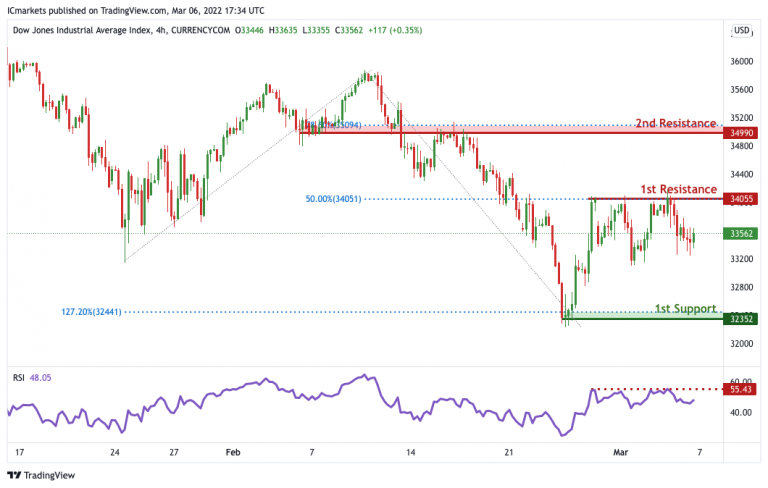
Dow Jones Industrial Average:
On the H4 timeframe, We see the possibility of bearish continuation from our 1st resistance at 34055 in line with horizontal overlap resistance towards our 1st support at 32352 in line with the horizontal swing low support. Alternatively, price may break 1st resistance and head for 2nd resistance at 34990 in line with the 78.6% Fibonacci retracement level. Our bearish bias is further supported by how price is expected to reverse off the RSI indicator.
Areas of consideration :
- H4 1st support at 32352
- H4 1st resistance at 34055


