
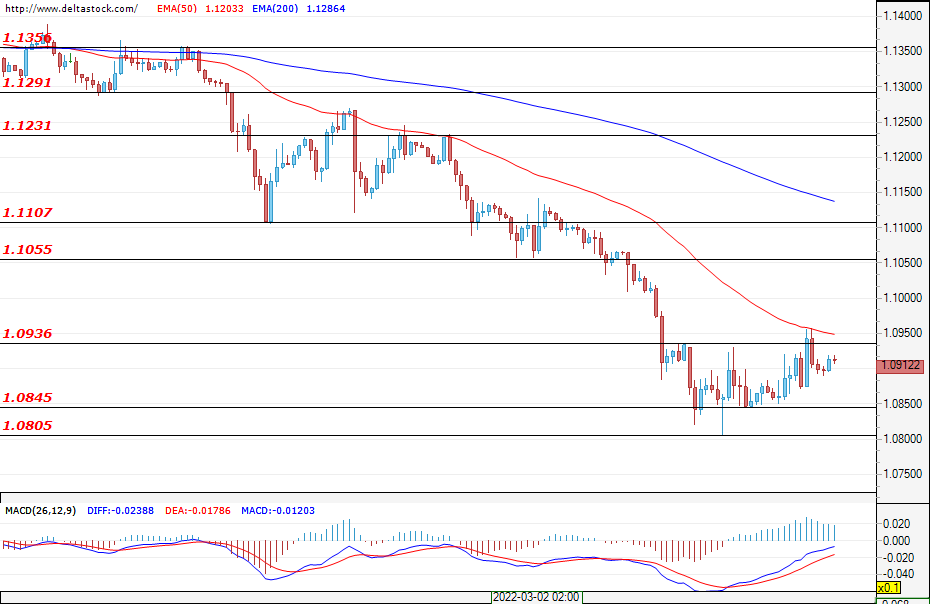
EUR/USD
The market is in a pullback phase after the euro managed to push off a 22-month low at 1.0805. News of the issuance of new defense and energy bonds supported the bulls, but they failed to overcome resistance at 1.0936. The market seems stretched and despite negative expectations, a deeper and more aggressive retracement is possible. If the bulls manage to take over 1.0936, prices can test the zones at 1.1050 or 1.1107. Daily support bulls can expect in the range between 1.0850 and 1.0805. If this zone is however breached, it is possible that the declines will deepen to 1.0640 or 1.0450. Today there are no significant events in the economic calendar, but given the situation in Ukraine, volatility is expected to remain high.
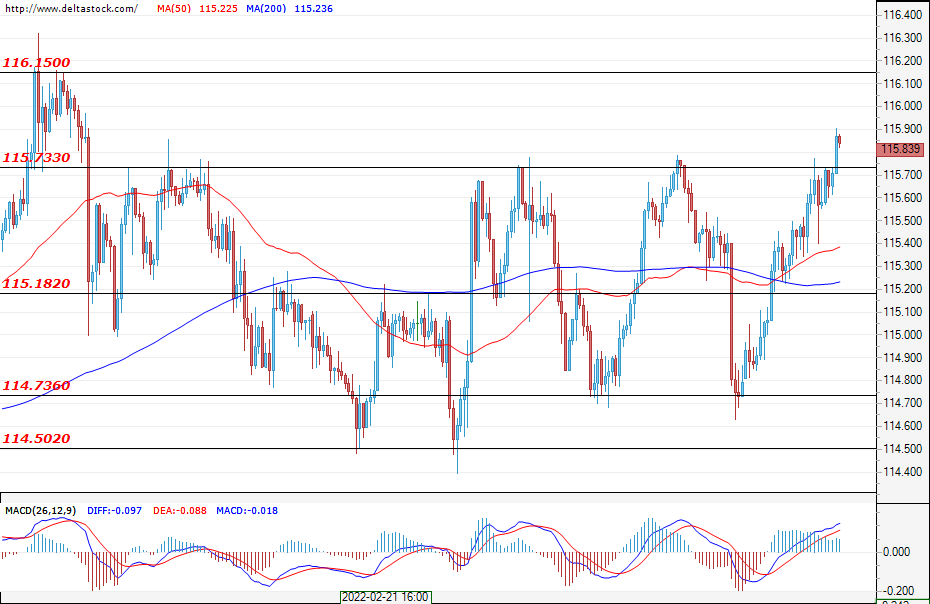
USD/JPY
In the early hours of today, the bulls managed to overcome the resistance at 115.73. The breakthrough has not yet been confirmed and the pair is likely to return to its range between 114.73 and 115.73. If buyers hold positions, prices can test the double top at 116.33. The structure comes from the higher time frames and if it’s broken a rally towards 118.00 could be expected.
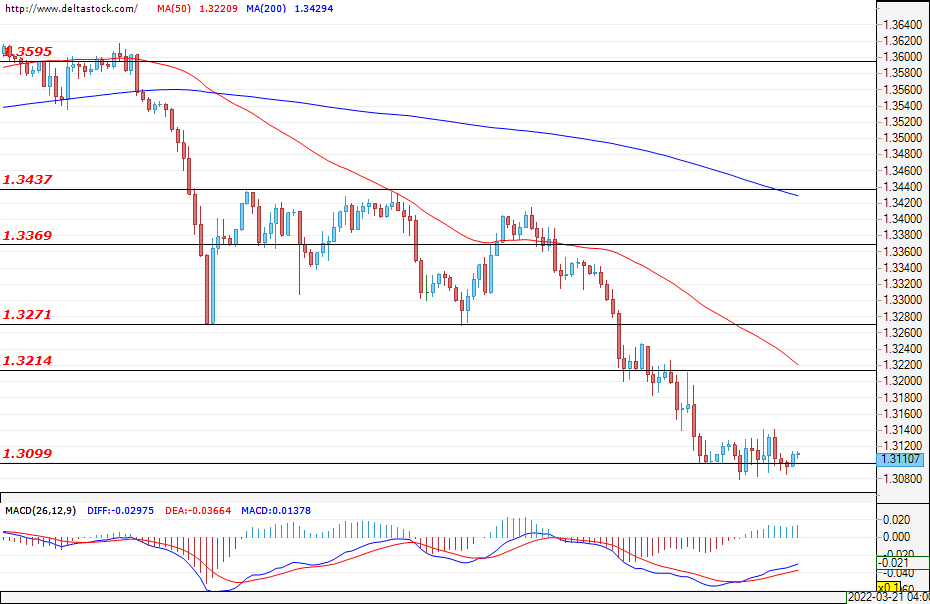
GBP/USD
The Cable managed to form a bottom at 1.3100, and the zone is the first daily support. The shallow correction implies covering short positions rather than a return of the bulls to the market. Expectations are for a corrective movement towards 1.3214. Due to the worsened sentiment, with the continuation of the sell-offs and a break of 1.3100, the declines could reach 1.2920 and even 1.2710.
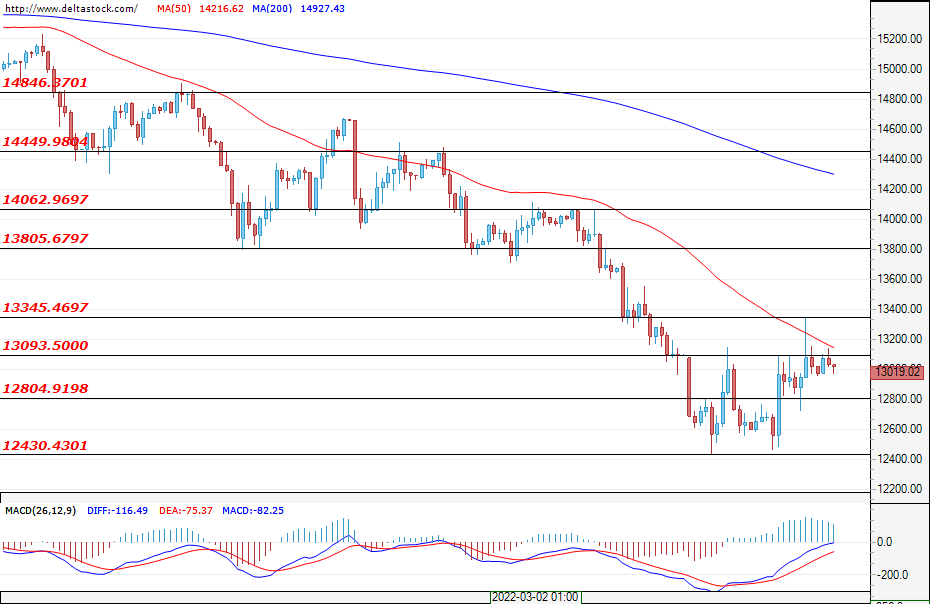
EUGERMANY40
The German index is still under the control of the bears, as at the beginning of the session it managed to convincingly bounce from the formed bottom around 12500 and reach its daily peak of 13345. Pressure down was not late and later in the day the index returned below the levels from 13093. With a confirmed break up, we can see an increase to 13805, but if the trend continues we can see a deepening again to 12430.
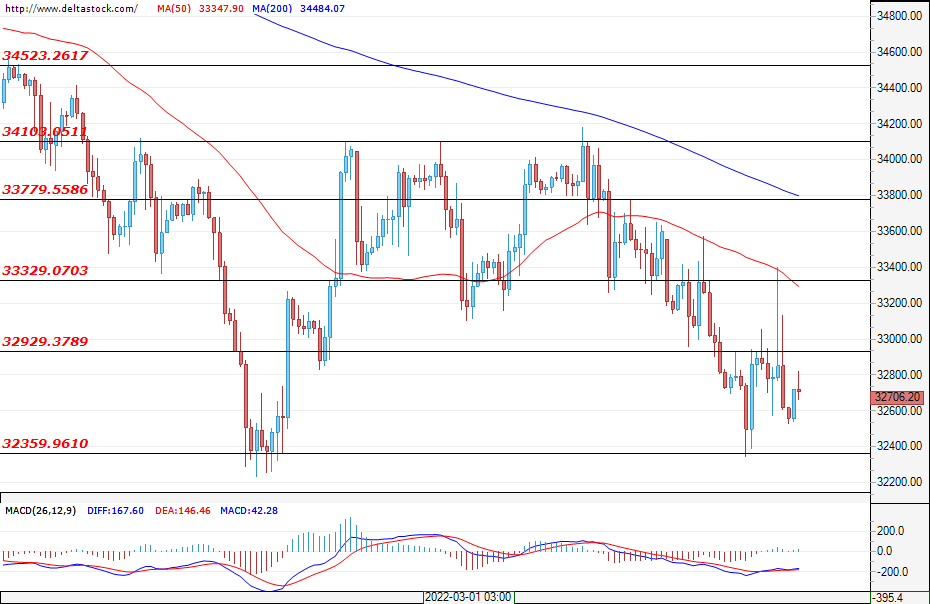
US30
Volatility was particularly high during yesterday’s session. The index bounces by the support at 32360 in an attempt to form a double bottom at the zone. The Bulls capitulated around the resistance at 33330 and eventually the index closed in the red. The declines are likely to continue, with 32360 being the first support for the bulls and 32930 is the most significant resistance. If the support breaks, a drop to the weekly support 31600 is possible.


