
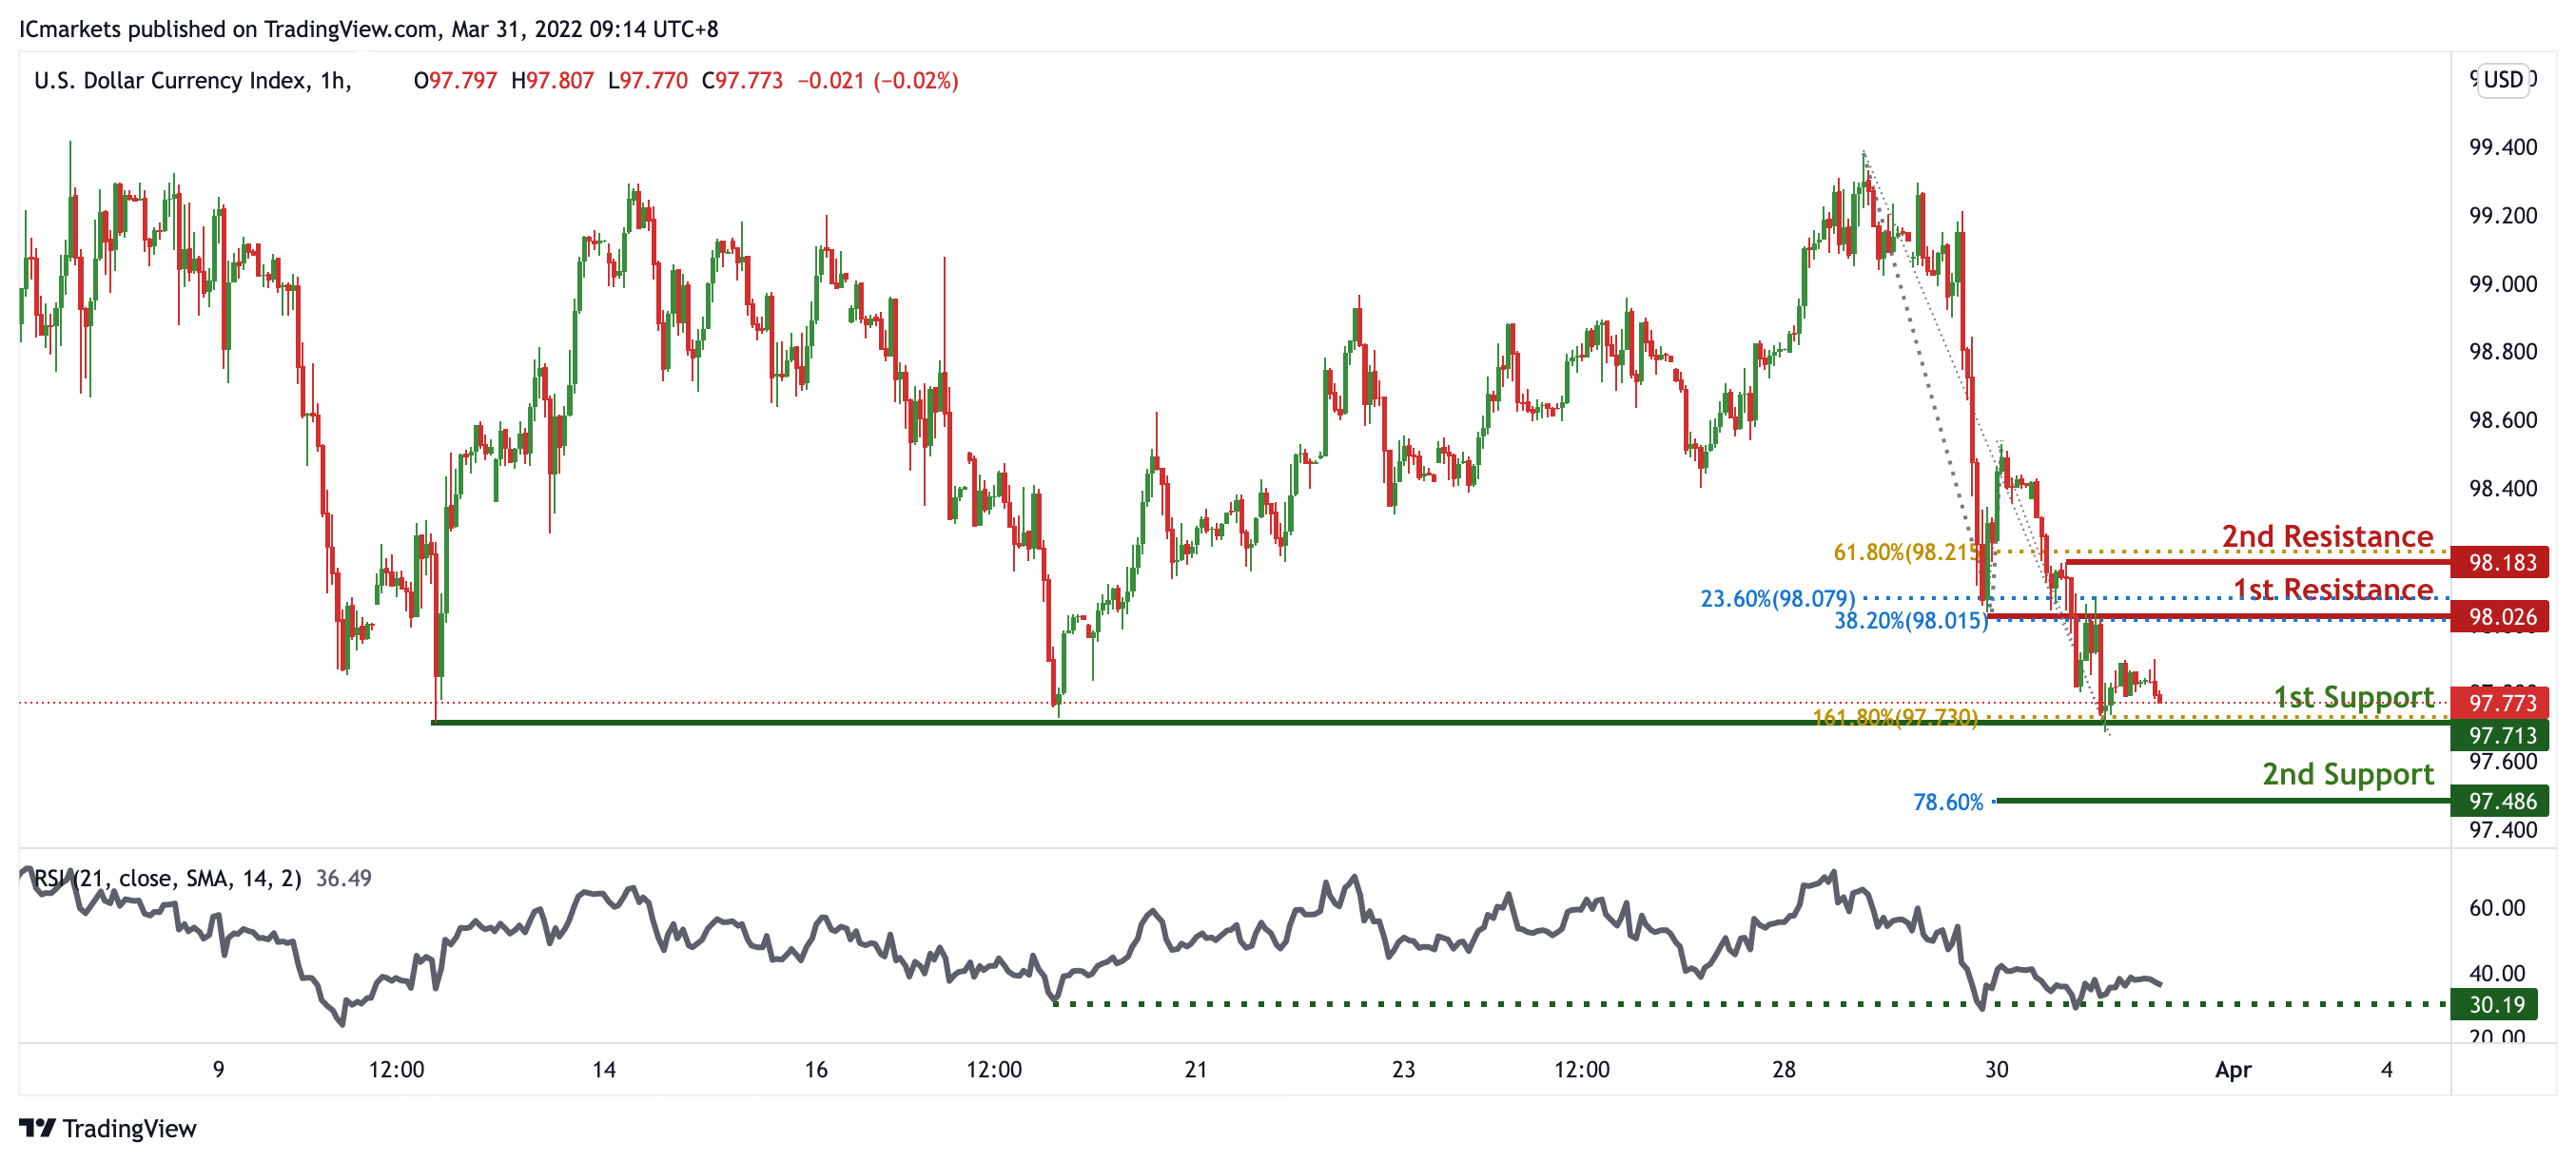
DXY:
On the H1 timeframe, prices are approaching a pivot. We see the potential for a bounce from our 1st support at 97.713 in line with 161.8% Fibonacci Projection% towards our 1st resistance at 98.026 which is an area of Fibonacci confluences. RSI are at levels where bounces previously occurred, further supporting our bullish bias.
Areas of consideration:
- H4 time frame, 1st resistance at 98.026
- H4 time frame, 1st support at 97.713
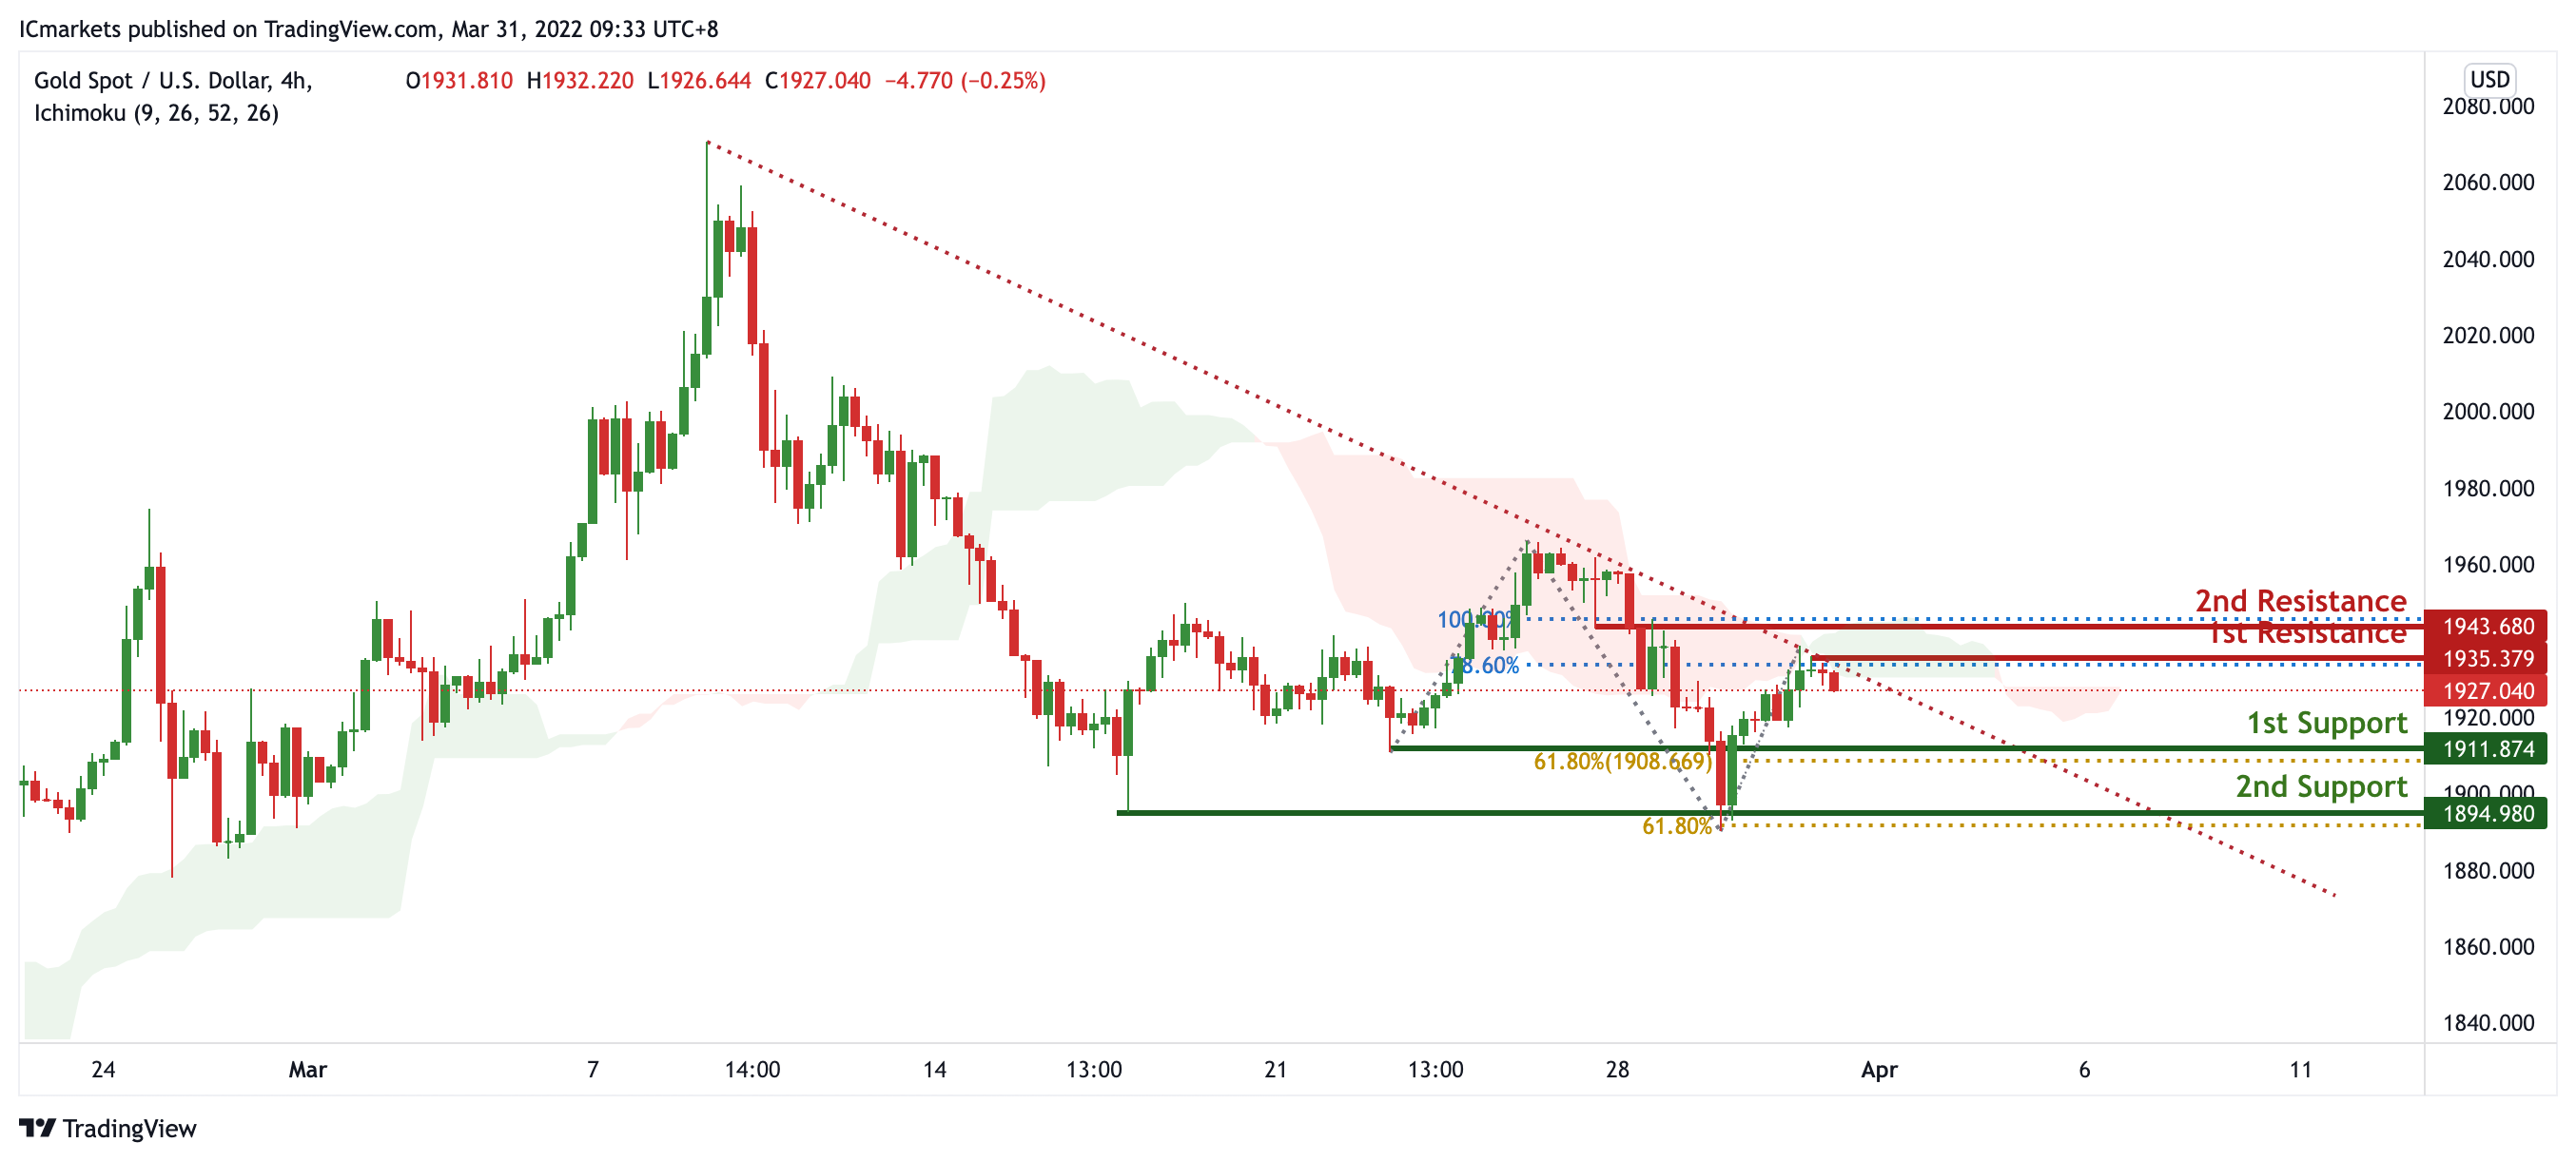
XAU/USD (GOLD):
On the H4, prices are on bearish momentum and abiding by our descending trendline resistance. We see the potential for further bearish continuation from our 1st resistance at 1941.226 which is in line with 78.6% Fibonacci projection towards our 1st support at 1915.715 in line with 23.6% Fibonacci retracement and also graphical swing low. Prices are trading below our ichimoku clouds, further supporting our bearish bias.
Areas of consideration:
- 4h 1st support at 1915.715
- 4h 1st resistance at 1941.226
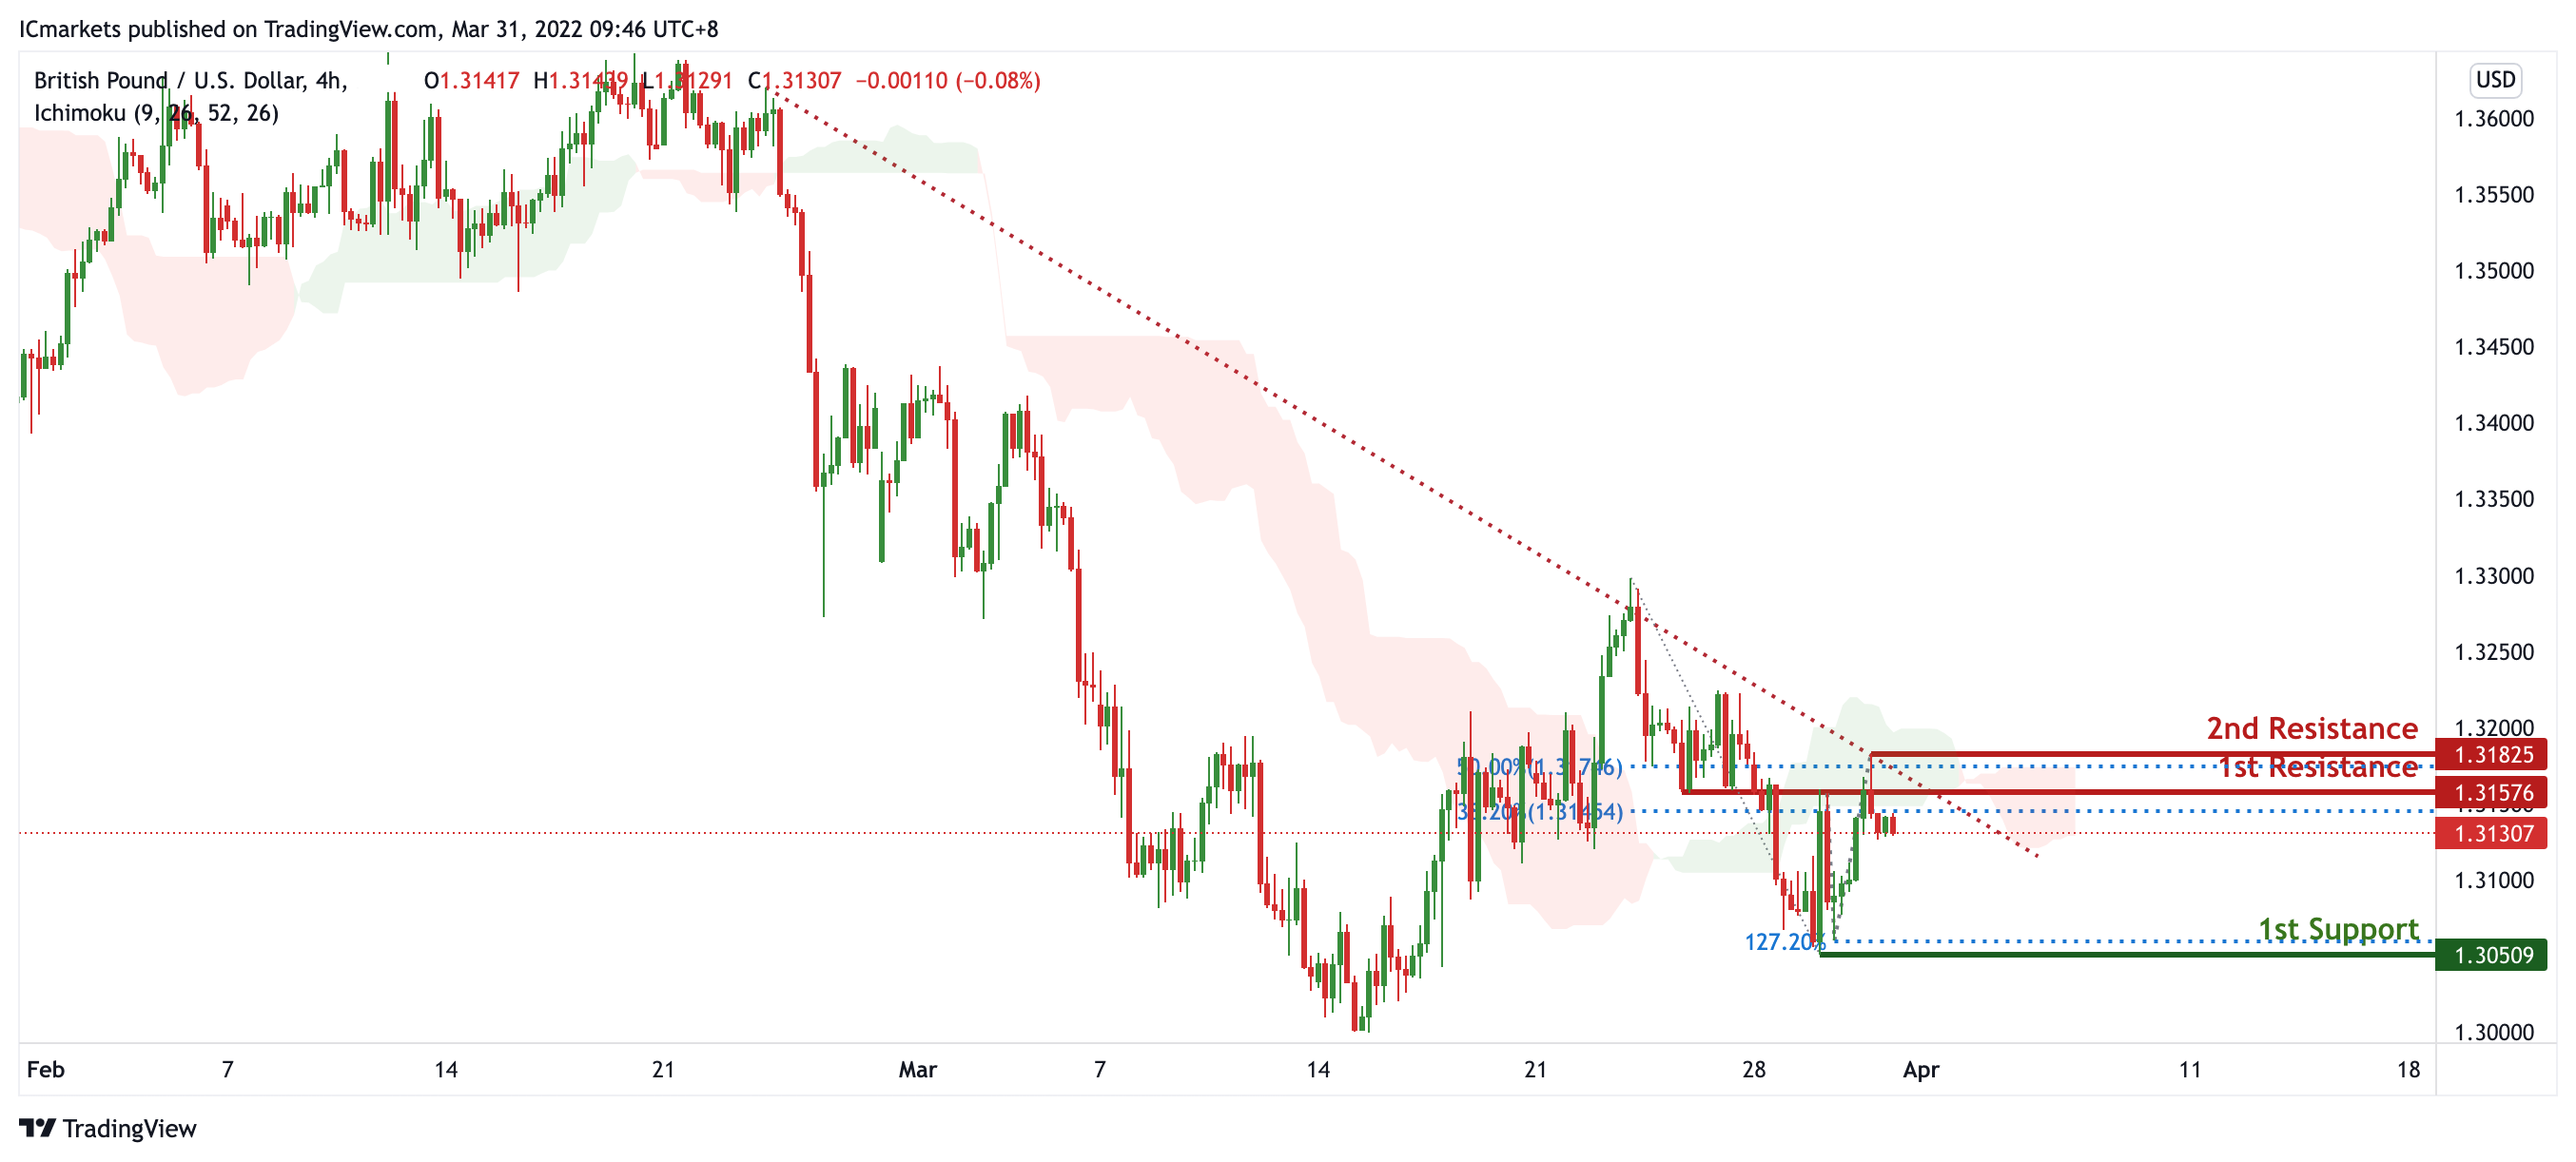
GBP/USD:
On the H4, prices are on bearish momentum and abiding by a descending trendline. We see the potential for a dip from our 1st resistance at 1.31576 which is a graphical overlap and in line with 38.2% Fibonacci retracement towards our 1st support at 1.30509 in line with 127.2% Fibonacci Projection. Prices are trading below our ichimoku clouds, further supporting our bearish bias. Alternatively, breaking the 1st resistance at 1.31576 in line with 38.2% Fibonacci retracement will call for further bullish continuation towards our 2nd resistance at 1.31825 in line with 50% Fibonacci retracement.
Areas of consideration:
- H4 1st resistance at 1.31825
- H4 1st support at 1.31576
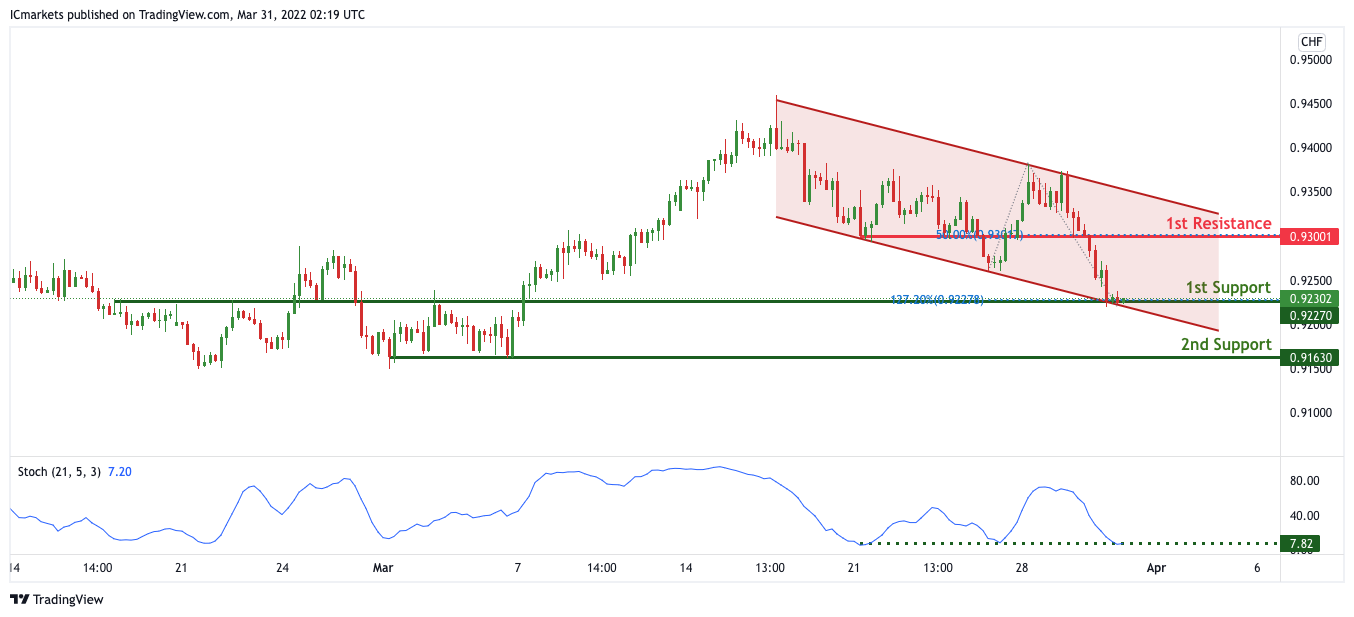
USD/CHF:
On the H4, with price expected to bounce off the support of the stochastics indicator, we have a bias that price will rise to our 1st resistance at 0.93001 in line with the 50% Fibonacci retracement from our 1st support at 0.92302 in line with the horizontal overlap support and 127.2% Fibonacci extension. Alternatively, price may break 1st support structure and head for 2nd support at 0.91630 in line with the swing low support.
Areas of consideration
- 1st support level at 0.92302
- 1st resistance level at 0.93001
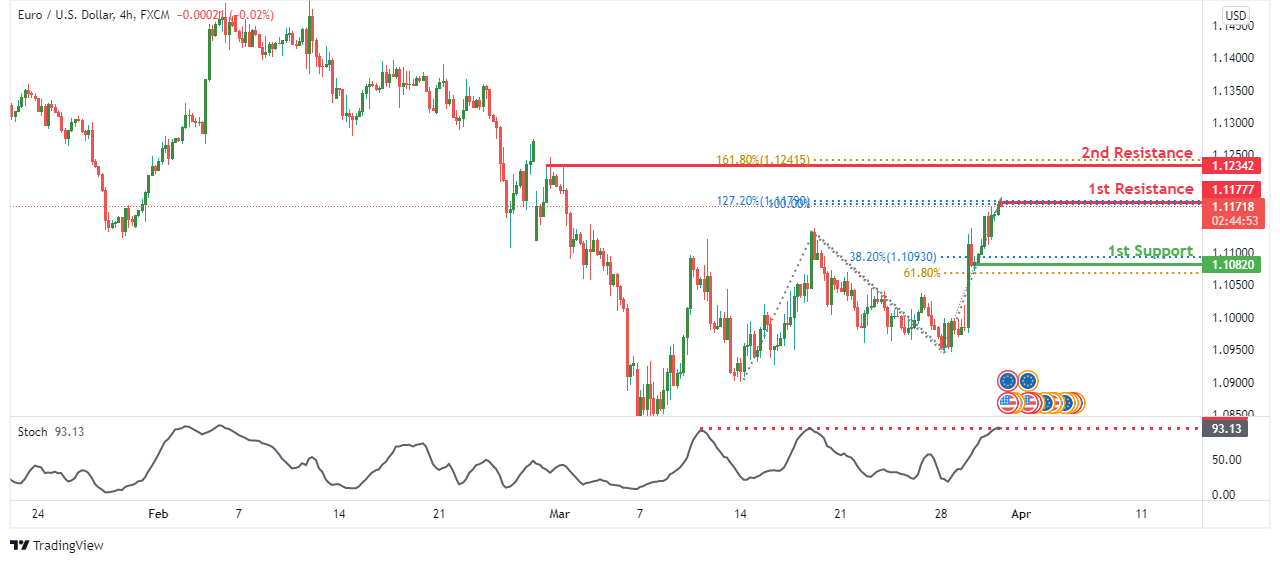
EUR/USD :
On the H4 timeframe, we see the potential for a bearish reversal from our 1st resistance at 1.11777 in line with 100% Fibonacci projection and 127.2% Fibonacci extension towards our 1st support at 1.10820 in line with 38.2% Fibonacci retracement and 61.8% Fibonacci projection. Our bearish bias is supported by the stochastic indicator where price is at resistance level.
Areas of consideration :
- H4 1st resistance at 1.11777
- H4 1st support at 1.10820
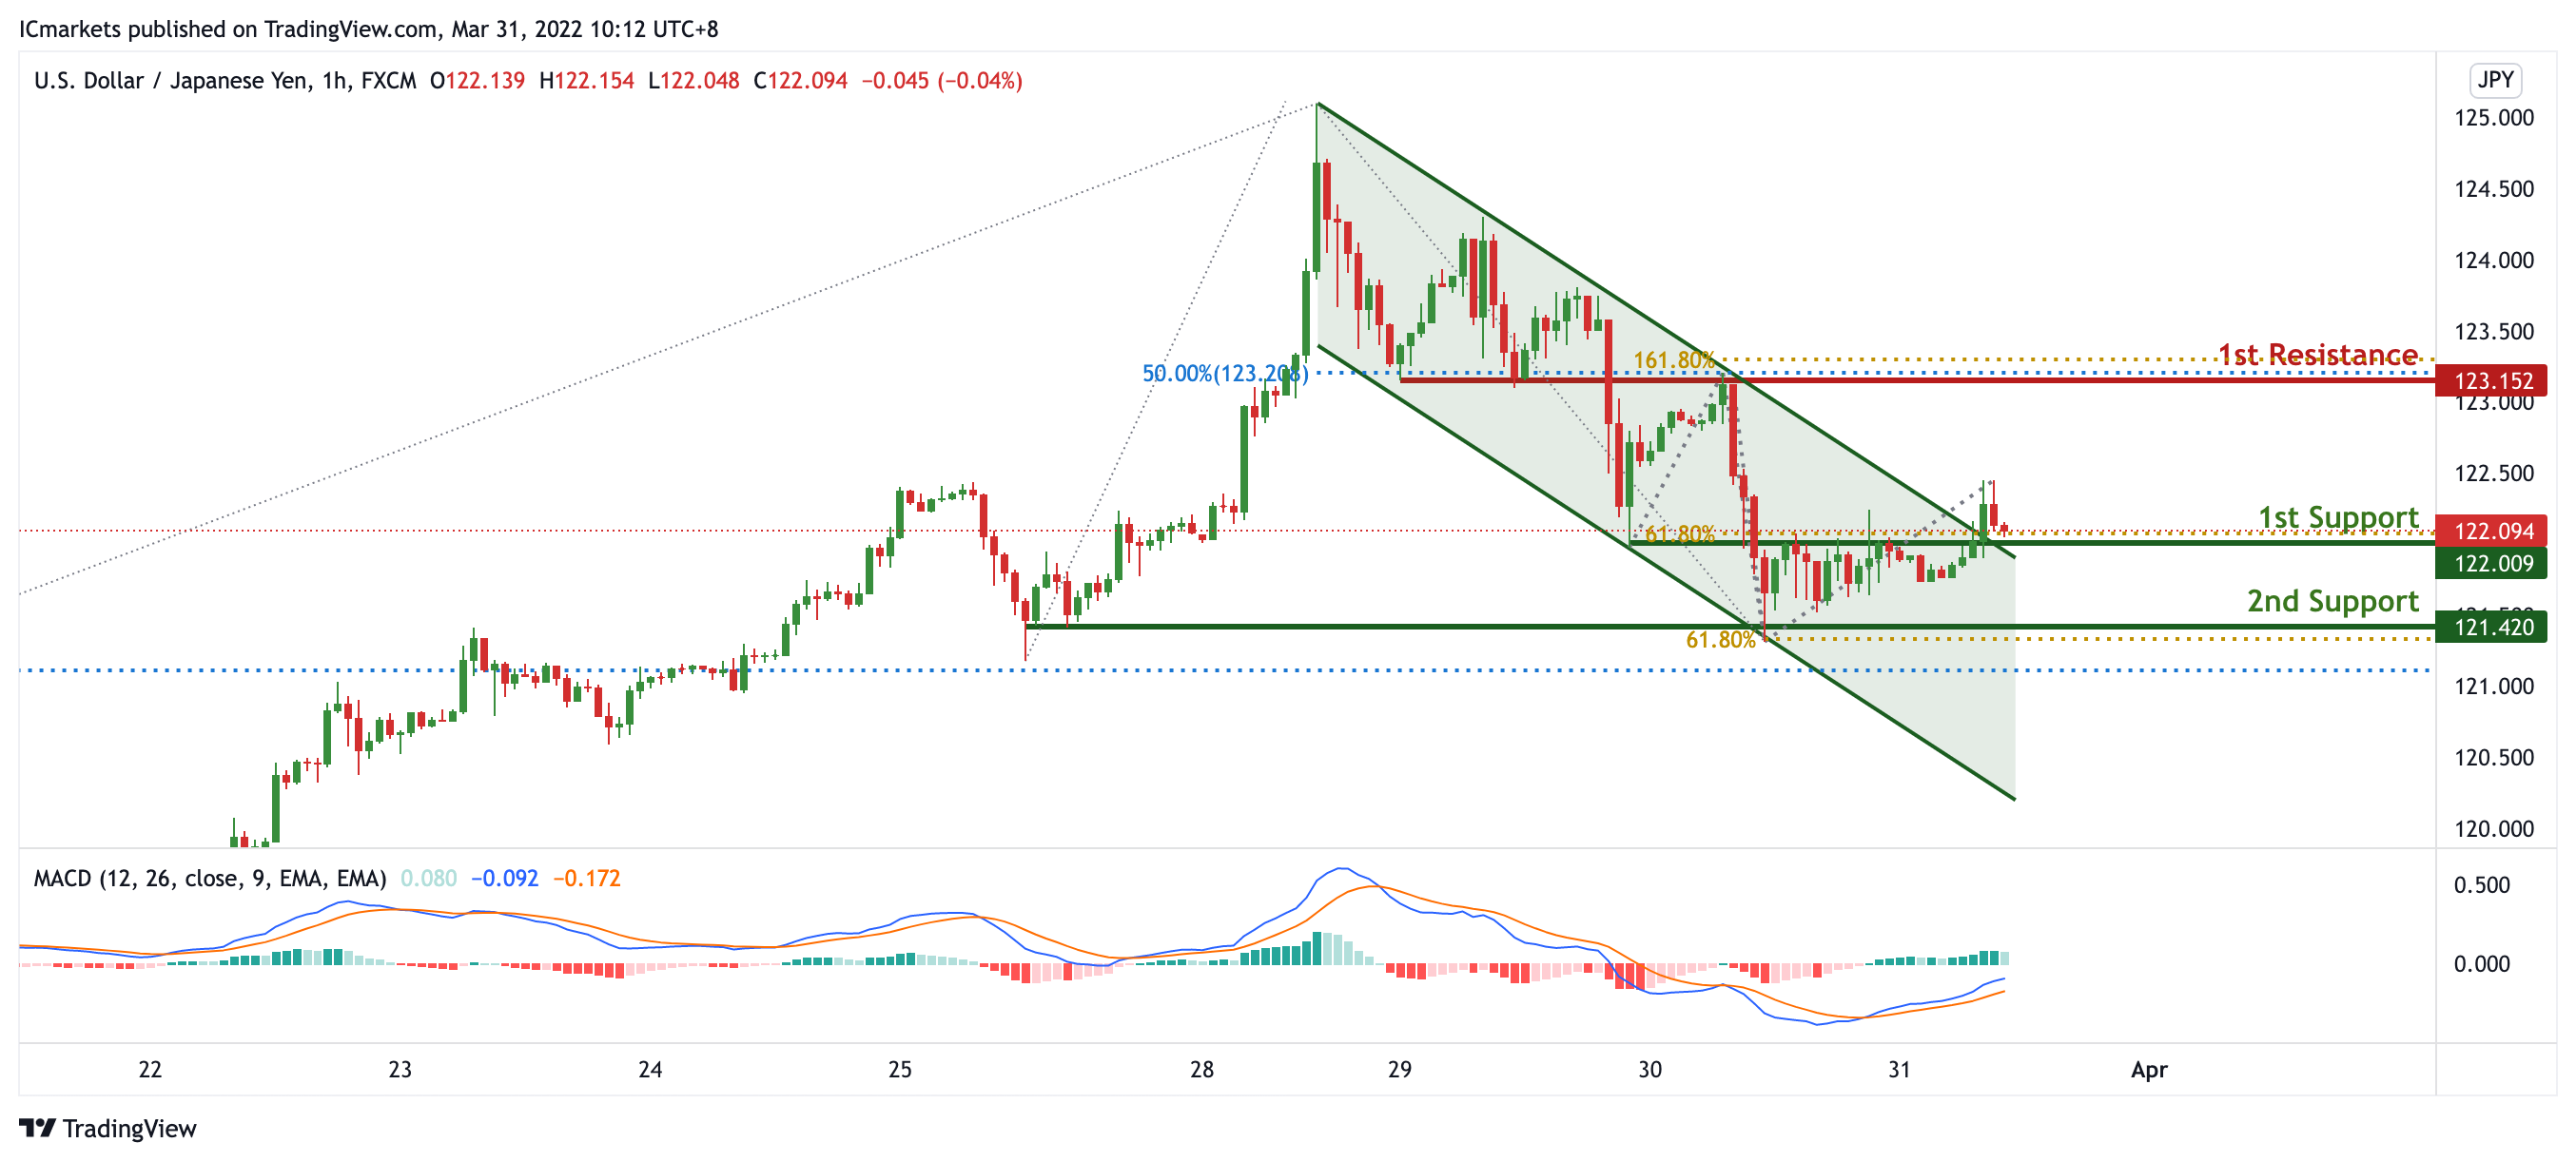
USD/JPY:
On the H1 timeframe, prices have broken out of our bearish channel. We see the potential for a bounce from our 1st support at 122.009 in line with 61.8% Fibonacci retracement towards our 1st resistance at 123.152 which is an area of Fibonacci confluences. MacD is supporting our bullish bias.
Areas of consideration:
- H4 time frame, 1st resistance at 123.152
- H4 time frame, 1st support at 122.009
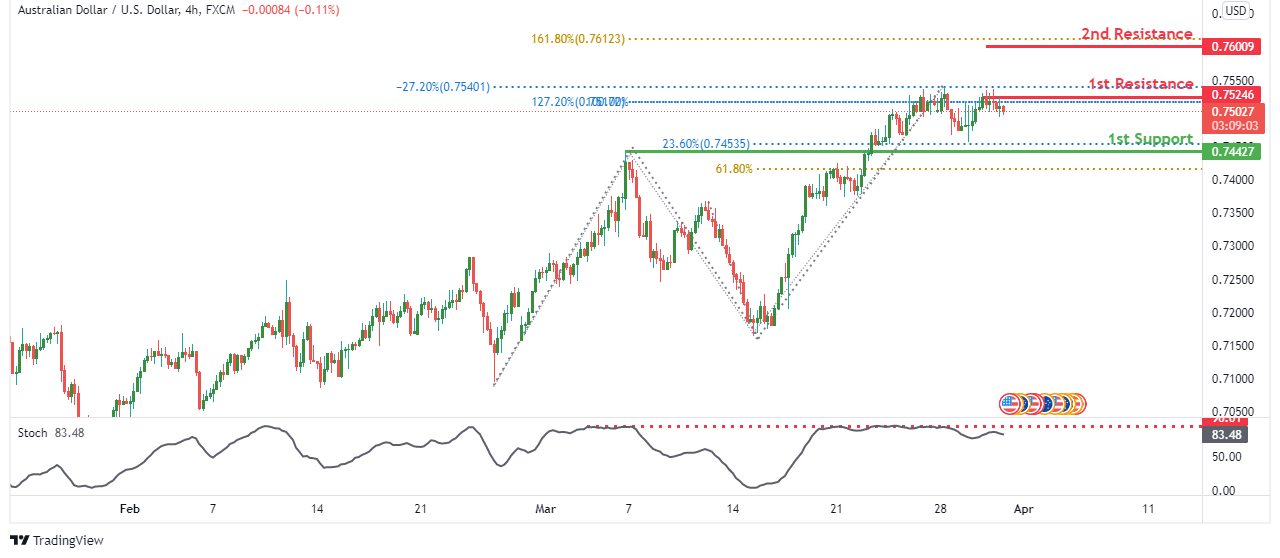
AUD/USD:
On the H4 timeframe, we see the potential for a bearish reversal from our 1st resistance at 0.75246 in line with 127.2% Fibonacci extension and -27.2% Fibonacci expansion towards our 1st support at 0.74427 in line with 23.6% Fibonacci retracement and 61.8% Fibonacci projection. Our bearish bias is supported by the stochastic indicator where price is at resistance level
Areas of consideration
- H4 1st resistance at 0.75246
- H4 1st support at 0.74427
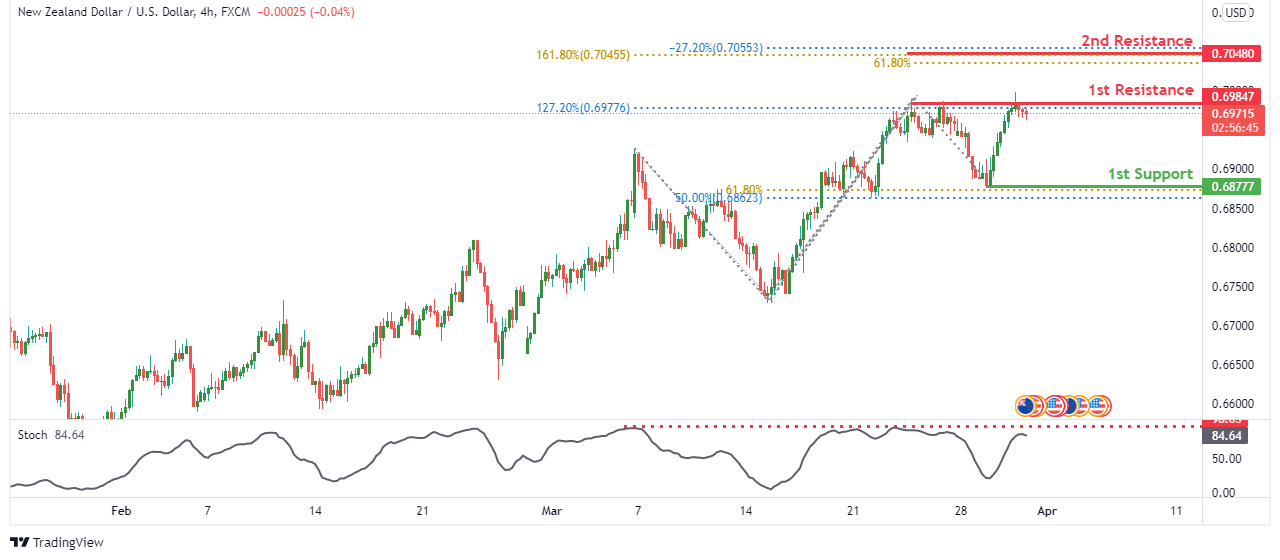
NZD/USD:
On the H4 timeframe, we see the potential for a bearish reversal from our 1st resistance at 0.69847 in line with 127.2% Fibonacci extension towards our 1st support at 0.68777 in line with 50% Fibonacci retracement. Our bearish bias is supported by the stochastic where it is trading at resistance level.
Areas of consideration :
- H4 1st resistance at 0.69897
- H4 1st support at 0.69145
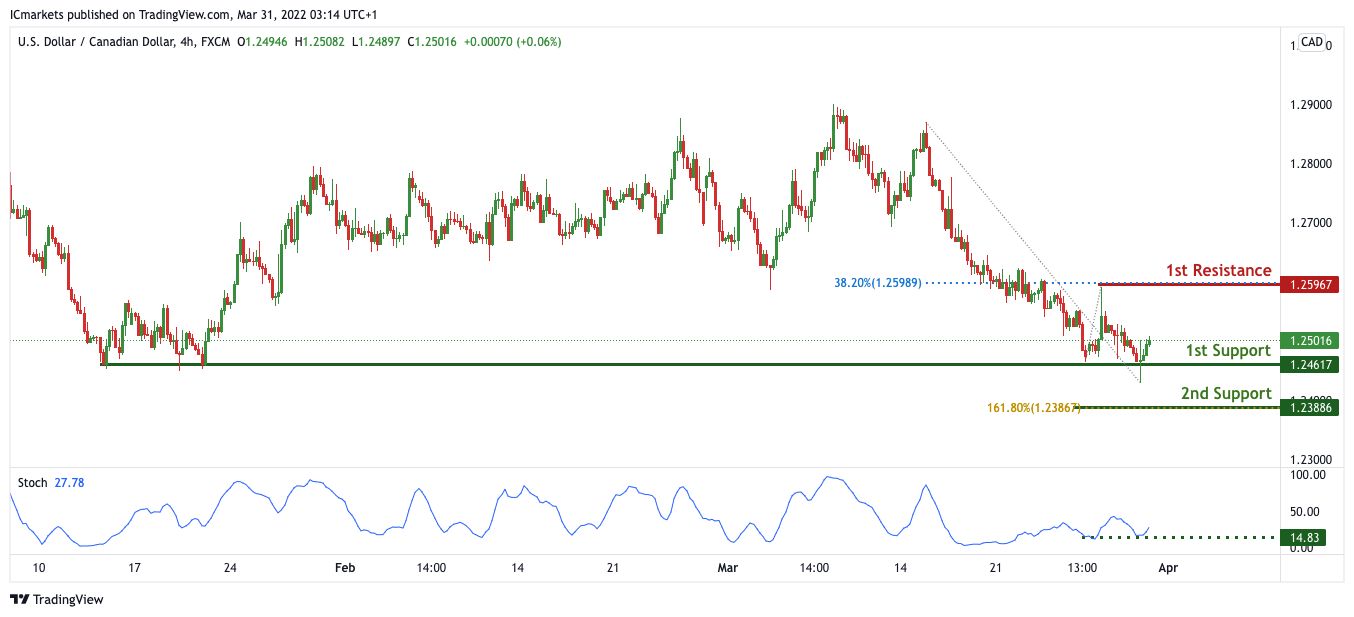
USD/CAD:
On the H4, with price expected to bounce off the support of the stochastics indicator, we have a bias that price will rise to our 1st resistance at 1.25967 in line with the 38.2% Fibonacci retracement from our 1st support at 1.24617 in line with the horizontal swing low support. Alternatively, price may break 1st support structure and head for 2nd support at 1.23886 in line with the 161.8% Fibonacci extension.
Areas of consideration:
- H4 time frame, 1st support at 1.24617
- H4 time frame, 1st resistance at 1.25967
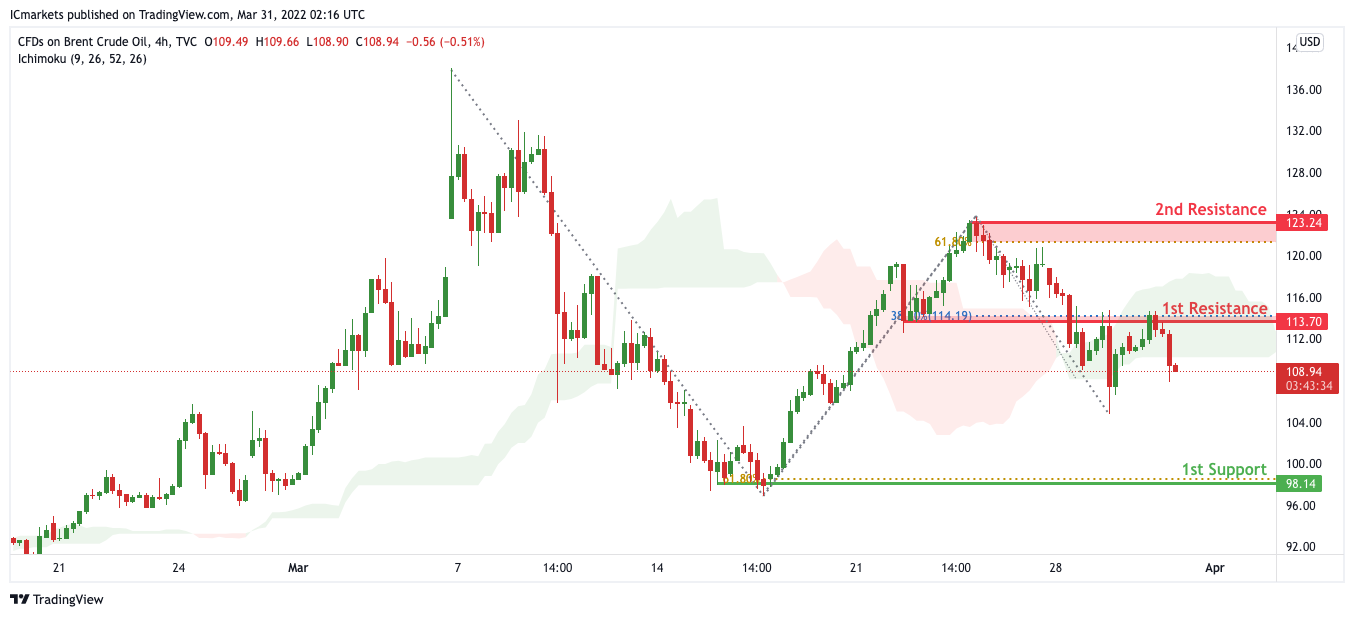
OIL:
On the H4, with price expected to bounce off the support of the ichimoku cloud, we have a bias that price will rise to our 1st resistance at 113.70 in line with the 38.2% Fibonacci retracement from our 1st support at 98.14 in line with the horizontal swing low support and 61.8% Fibonacci retracement. Alternatively, price may break 1st support structure and head for 2nd support at 123.24 in line with the 61.8% Fibonacci retracement.
Areas of consideration:
- H4 time frame, 1st resistance of 113.70
- H4 time frame, 1st support of 98.14
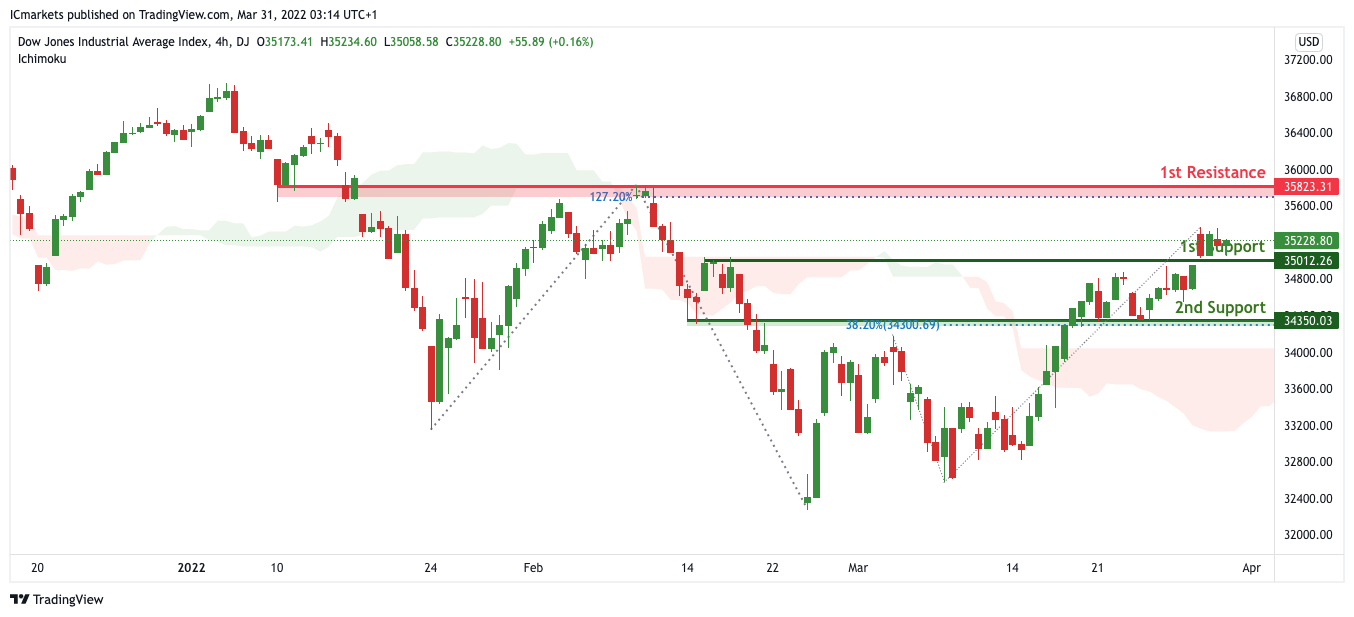
Dow Jones Industrial Average:
On the H4, with price moving above the ichimoku cloud, we have a bias that price will rise to our 1st resistance at 35823 in line with the 127.2% Fibonacci extension from our 1st support at 35012 in line with the horizontal pullback support. Alternatively, price may break 1st support structure and head for 2nd support at 34350 in line with the horizontal overlap support and 38.2% Fibonacci retracement.
Areas of consideration :
- H4 1st support at 35012
- H4 1st resistance at 35823


