
Hello fellow traders. In this technical blog we’re going to take a quick look at the Elliott Wave charts of GBPUSD. The pair has given us nice trading opportunity recently. We have been selling the rallies at 1.3298-1.3348 area as explained in previous article on GBPUSD . Reasons for calling further weakness in pair are bearish sequences in the cycle from the June 1st 2021 peak. We recommended members to avoid buying and keep selling rallies in 3,7,11 swings when get a chance. In further text we are going to explain the Elliott Wave Forecast
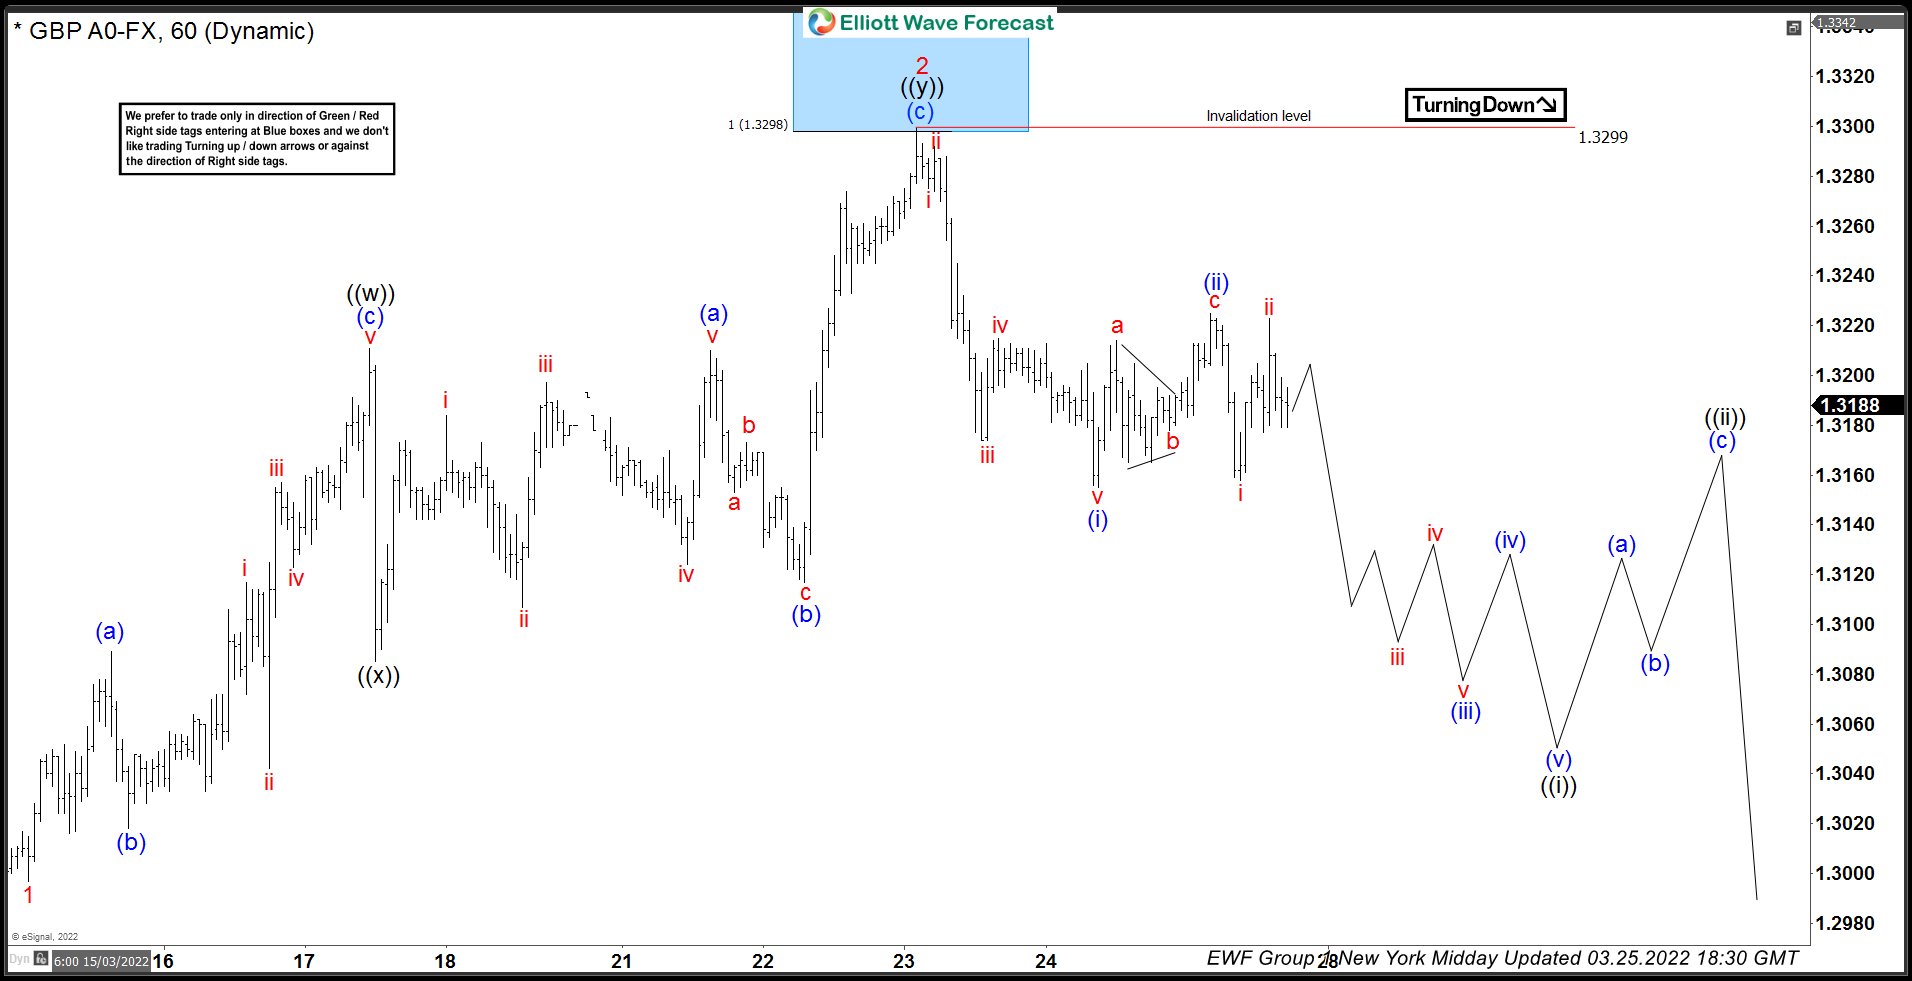
GBPUSD H1 Elliott Wave Analysis 03.25.2022
GBPUSD has given us nice reaction lower from our selling zone. Recovery is counted completed at 1.3299. While below that high, next leg down can be in progress. However we need to see further separation from the peak to confirm. Current view suggests as far as the price holds below 1.3222 peak – (ii) blue, next technical area to the downside ideally comes at 1.3079-.3045 . At that zone we should ideally complete 5 waves down from the 1.3299 peak. Once 5 waves down are completed and we can expect to see 3 waves bounce against the 1.3299 high.
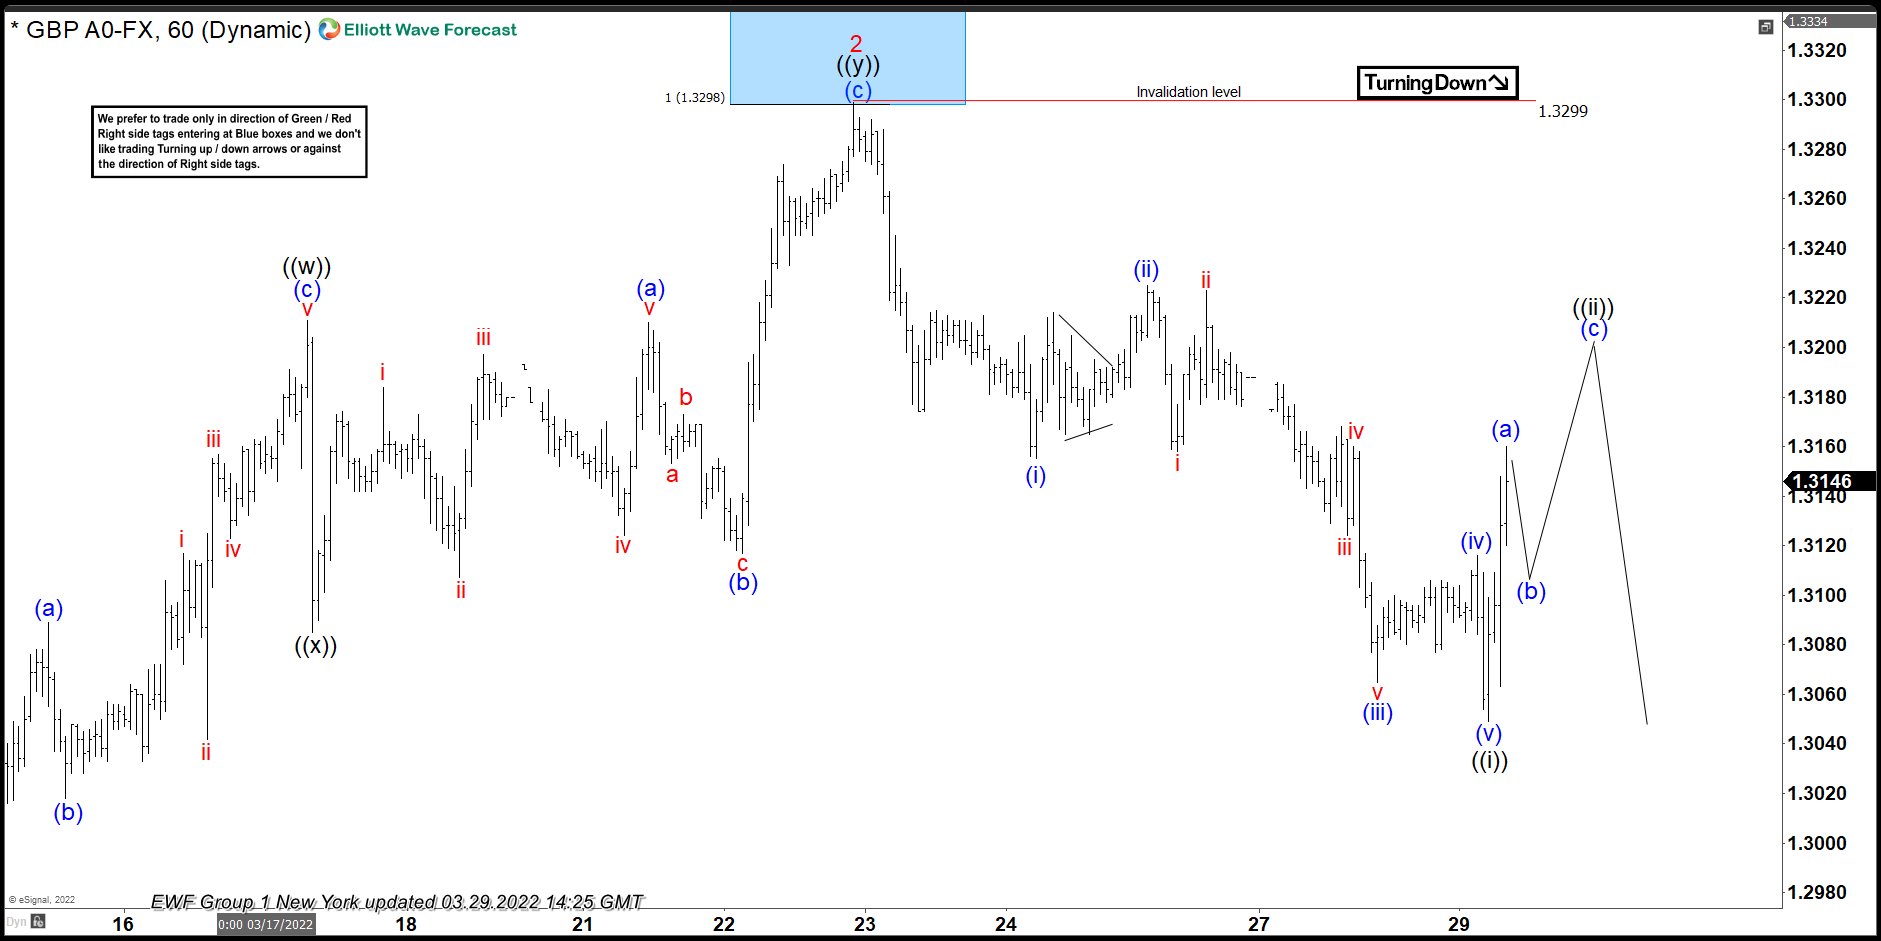
GBPUSD H1 Elliott Wave Analysis 03.29.2022
We got further separation from the peak. The pair reached 1.3079-.3045 area , completed 5 waves – ((i)) black and started turning higher in recovery ((ii)) correcting the cycle from the 1.3299 peak. Short term rally from the last low looks impulsive which suggests we are ending only first leg (a) blue of ((ii)). We expect 3 waves pull back in (b) and then another leg up (c) of ((ii)) before further decline ideally resumes.
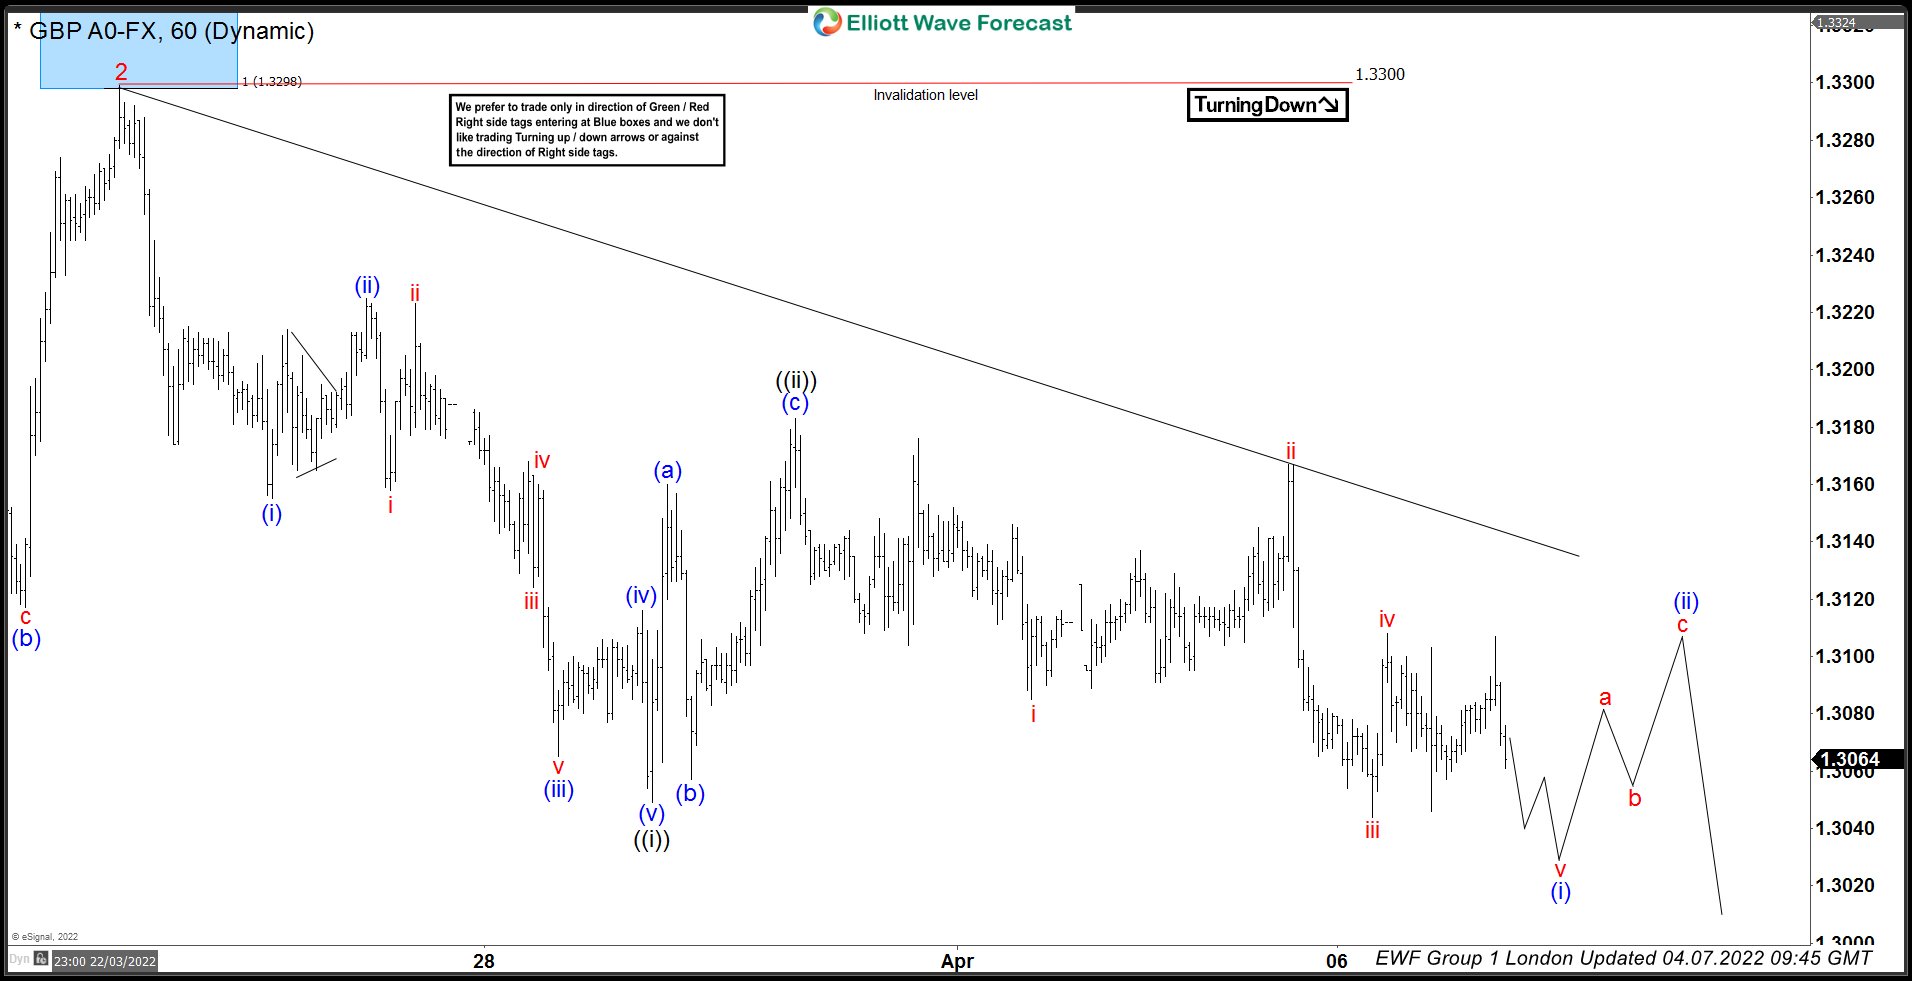
GBPUSD H1 Elliott Wave Analysis 04.07.2022
GBPUSD made (b) blue pull back and another leg up (c) blue of ((ii)). The pair completed 3 waves recovery ((ii)) black at 1.3183 and made decline again as expected. The pair has broken previous low 1.305 , which made lower low sequences from the 1.330 peak. Current price structure suggests as far as the price holds below marked trend line and 1.3183 pivot holds,next tech zone to the downside ideally comes at 1.2943-1.2886 area.


