
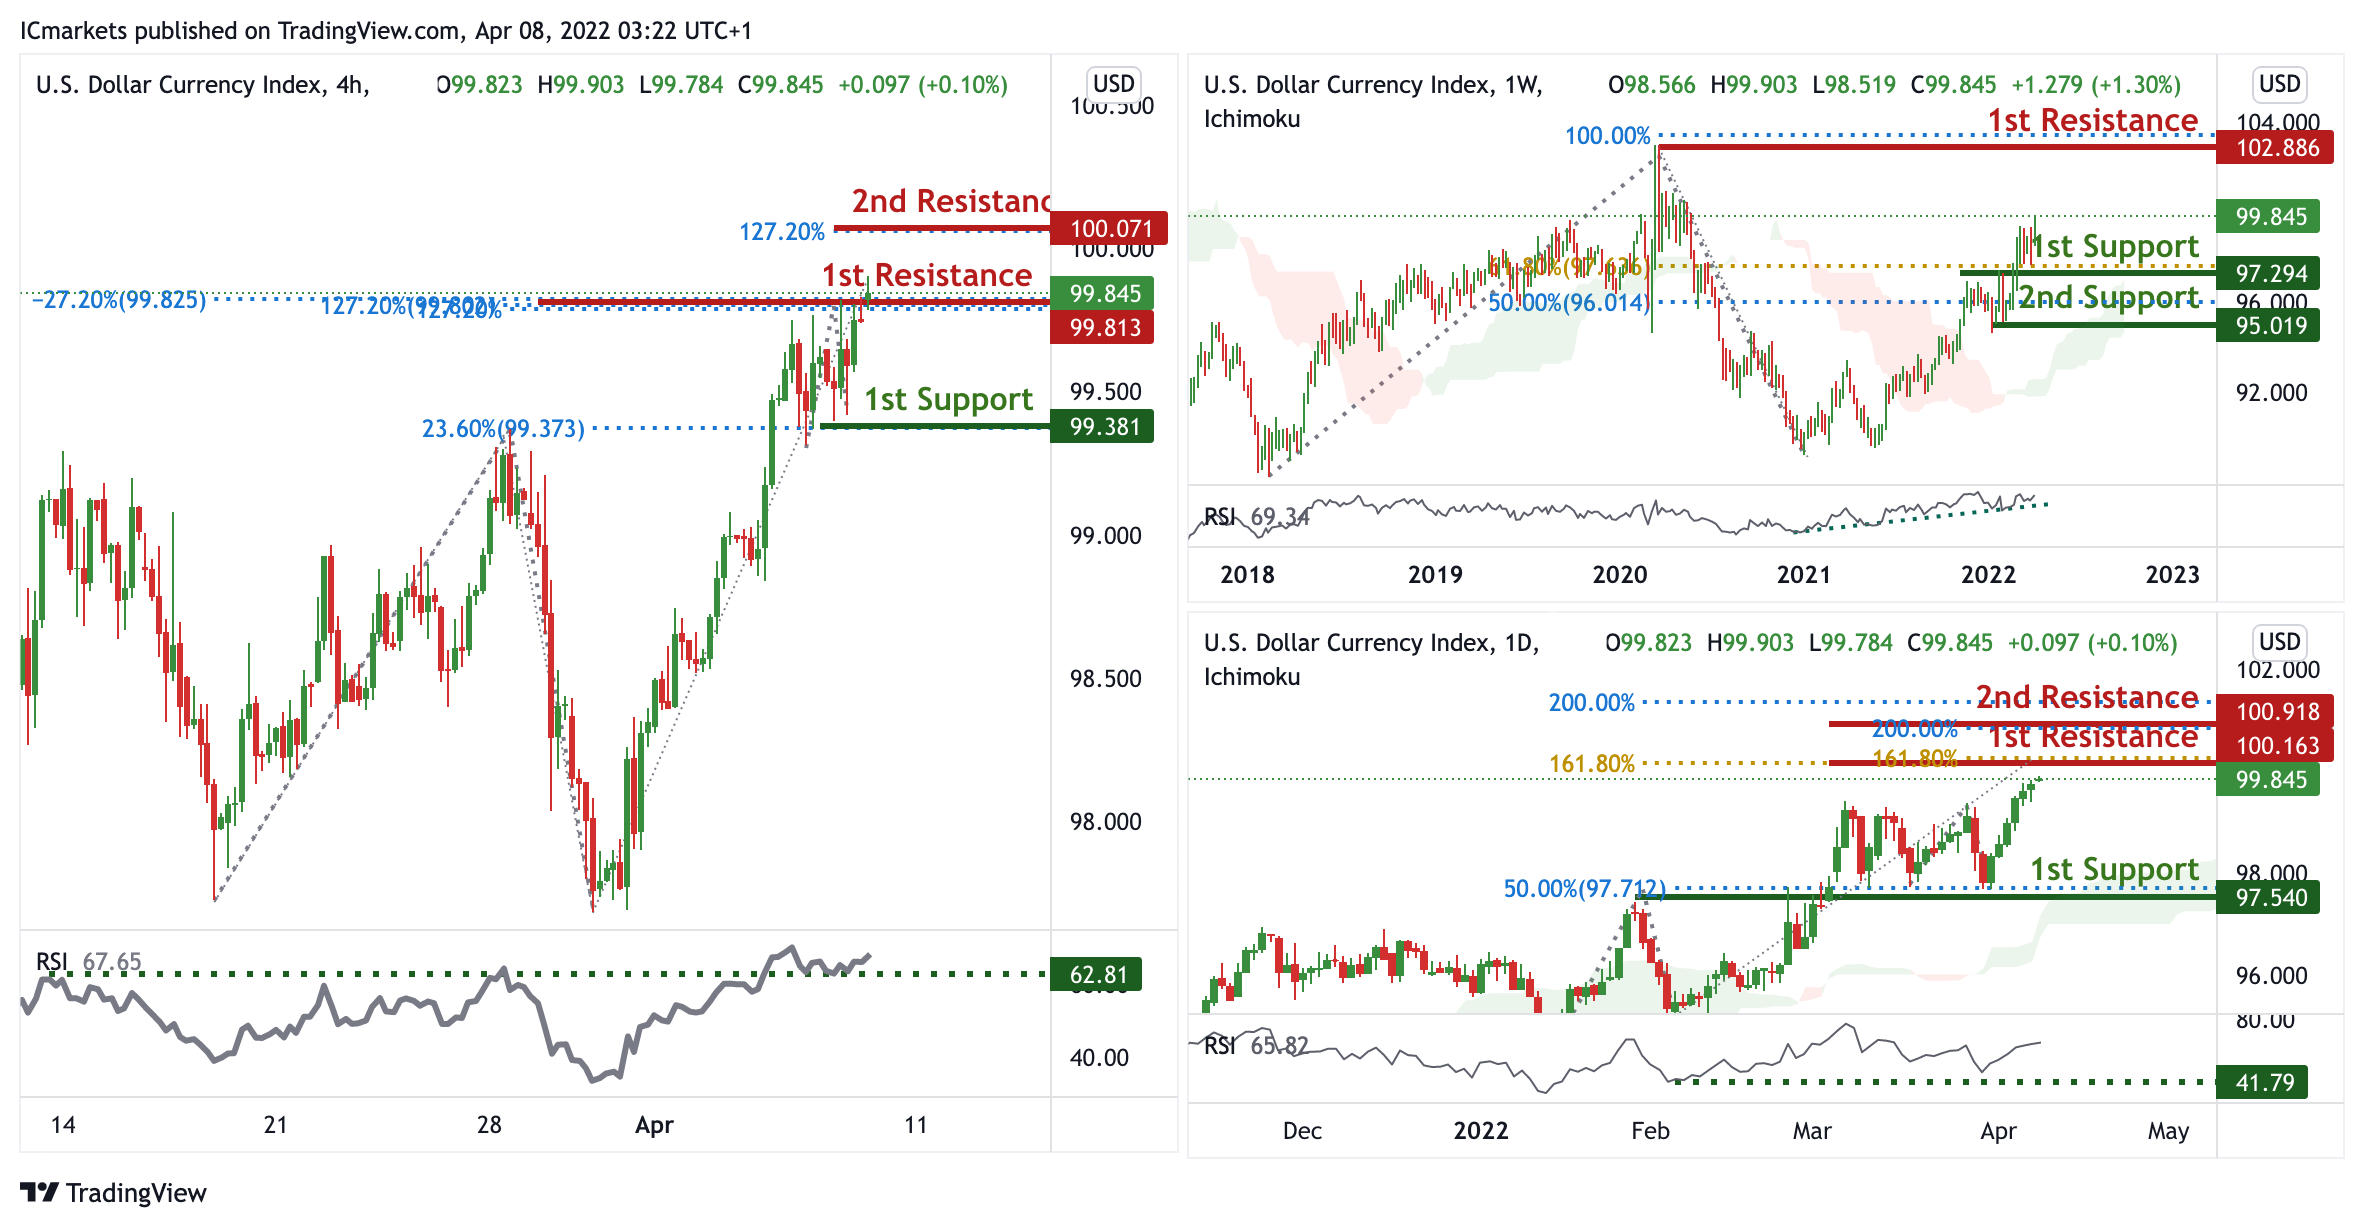
DXY:
On the weekly, prices are on bullish momentum. We see the potential for abounce from our 1st support at 97.294 in line with 61.8% Fibonacci retracement towards our 1st resistance at 102.886. Prices are trading above our ichimoku clouds, further supporting our bullish bias.
On the daily, prices are at a Pivot. We see the potential for a dip from our 1st resistance at 100.163 in line with 161.8% Fibonacci Projection towards our 1st support at 97.540 in line with 50% Fibonacci retracement.
On the H1 timeframe, prices have approached pivot. We see the potential for a dip from our 1st resistance at 99.813 in line with which is an area of Fibonacci confluences towards our 1st support at 99.381 in line with 23.6% Fibonacci retracement. RSI is at levels where dips previously occurred, further supporting our bearish bias.
Areas of consideration:
- H4 time frame, 1st resistance at 99.813
- H4 time frame, 1st support at 99.381
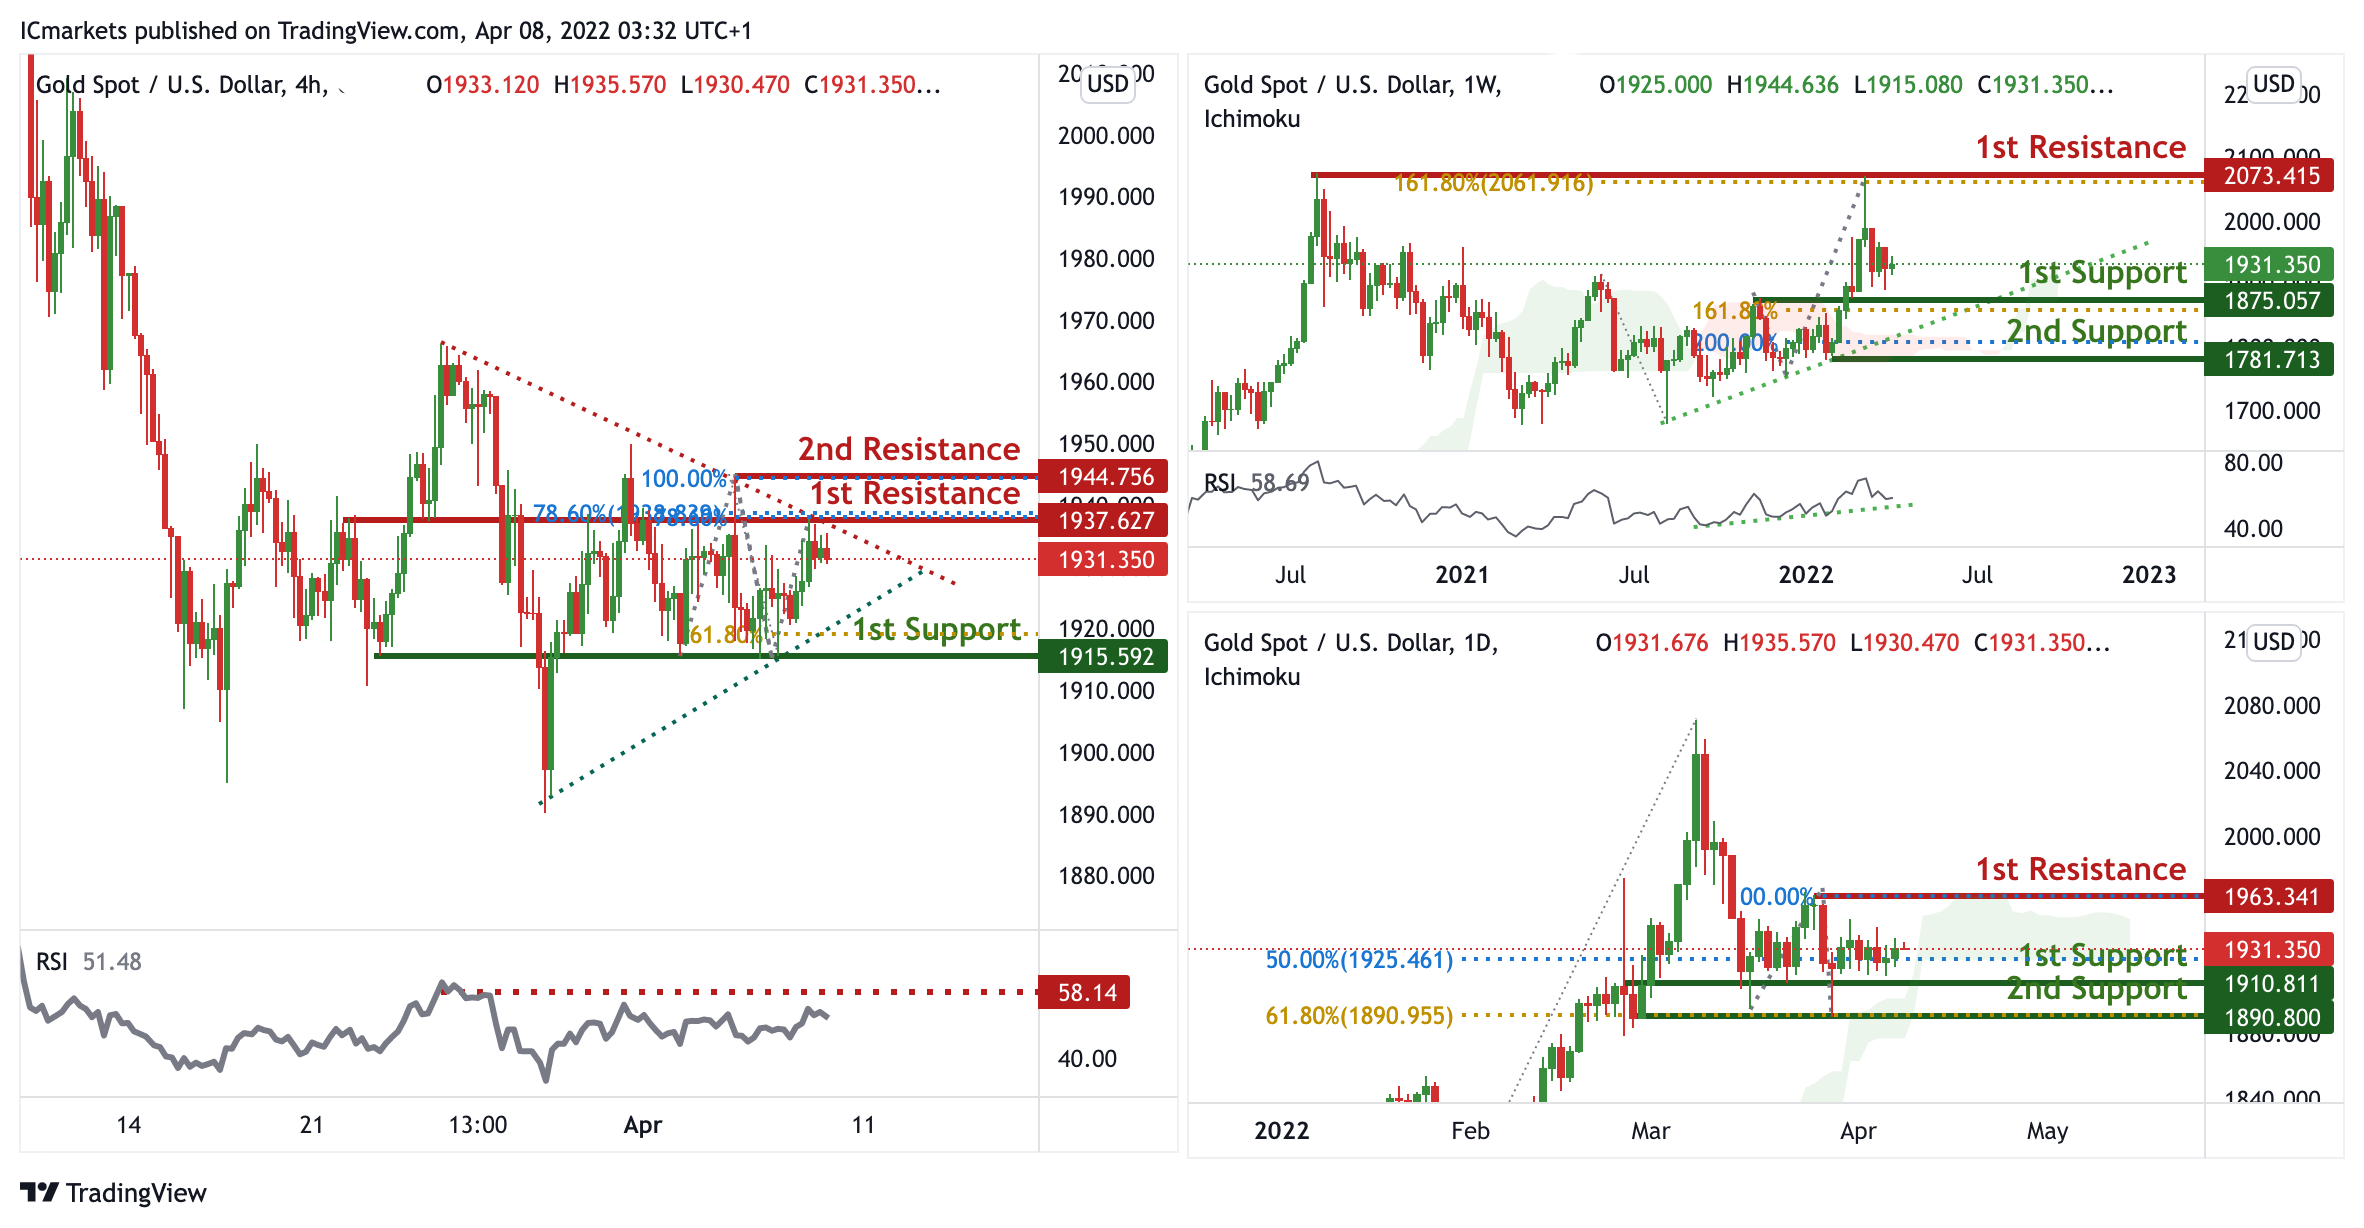
XAU/USD (GOLD):
On the weekly, prices are on bullish momentum and abiding by an ascending trendline support. We see the potential for a bounce from our 1st support at 1875.057 in line with 161.8% Fibonacci Projection. Prices are trading above our ichimoku clouds, further supporting our bullish view. On the daily, prices are on a support. We see the potential for a bounce from our 1st support at 1910.811 in line with 50% Fibonacci retracement towards our 1st resistance at 1910.811 in 100% Fibonacci Projection. Prices are trading above our Ichimoku clouds, further supporting our bullish bias. On the H4, prices are consolidating in a triangle pattern. We see the potential for a dip from our 1st resistance at 1937.627 which is an area of Fibonacci confluences towards our 1st support at 1915.592 in line which is a graphical overlap and in line with 61.8% Fibonacci Projection. RSI is at levels where dips previously occurred, further supporting our bearish view.
Areas of consideration:
- 4h 1st support at 1915.592
- 4h 1st resistance at 1937.627
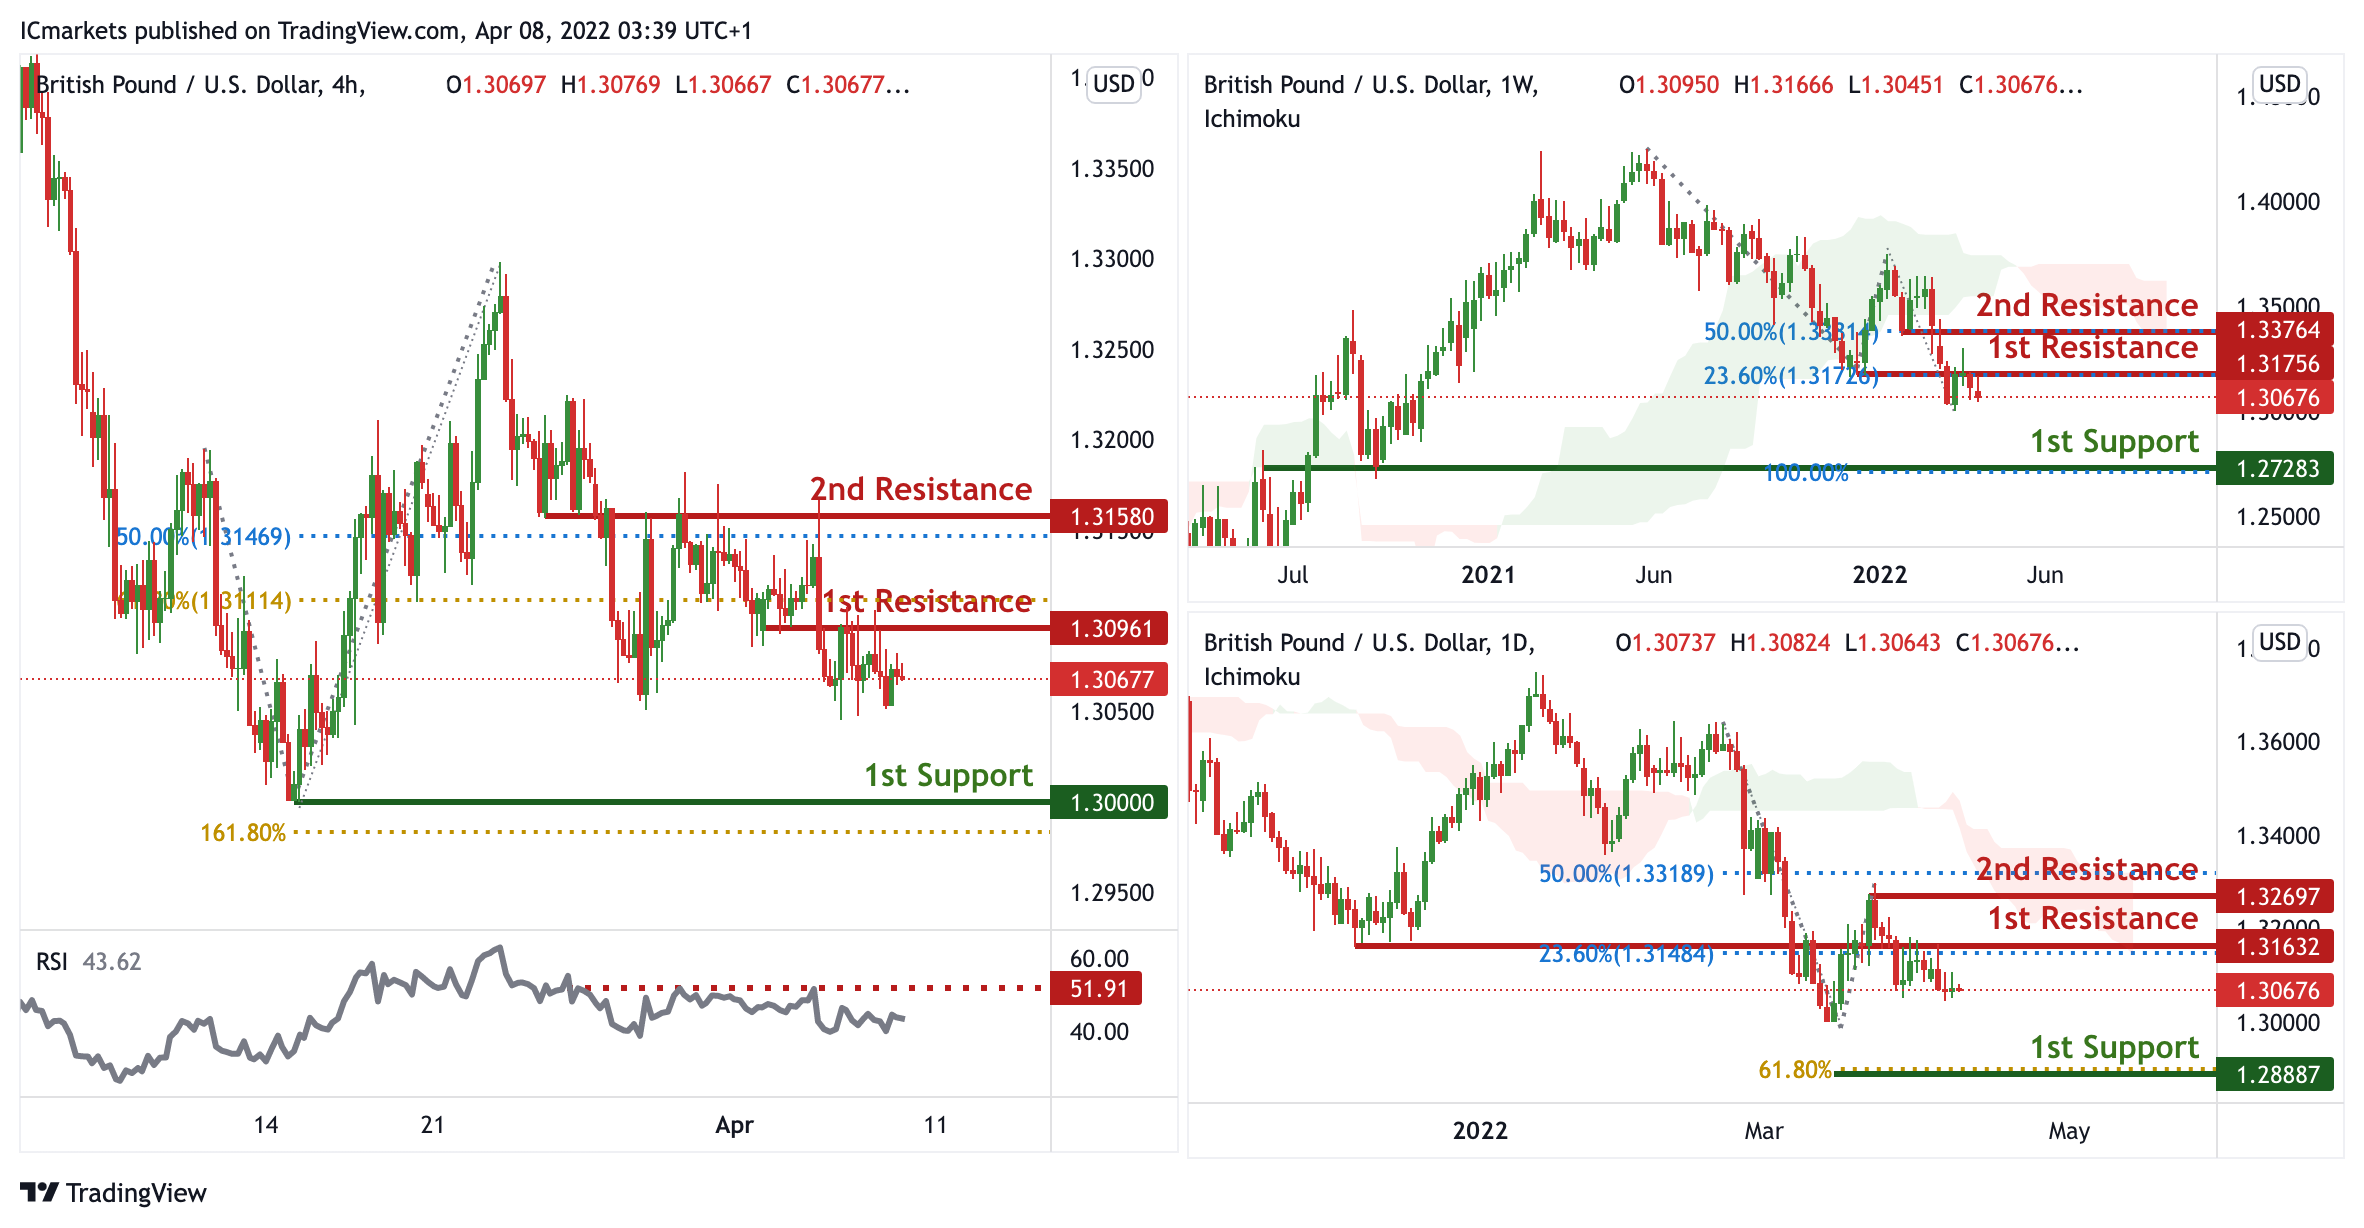
GBP/USD:
On the weekly, prices have reached a key pivot. We see the potential for a dip from our 1st resistance at 1.31756 in line with 23.6% Fibonacci retracement towards our 1st support at 1.27283 in line with 100% fibonacci Projection. Prices are trading below our ichimoku cloud resistance, further supporting our bearish bias.
On the daily, prices are on bearish momentum. We see the potential for a dip from our 1st resistance at 1.31632 in line with 23.6% Fibonacci retracement towards our 1st support at 1.28887 in line with 61.8% Fibonacci projection. Prices are trading below our ichimoku cloud resistance, further supporting our bearish bias.
On the H4, prices are approaching a pivot. We see the potential for further bearish continuation from our 1st resistance at 1.30961 in line with 61.8% Fibonacci retracement towards our 1st support at 1.3000 in line with 161.8% Fibonacci Projection. Alternatively, if prices continue to climb, we might find prices climbing further towards our 2nd resistance at 1.3158 in line with 50% Fibonacci retracement. Our bullish bias is further supported by RSI being at levels where dips previously occurred.
Areas of consideration:
- H4 1st resistance at 1.30961
- H4 1st support at 1.3000
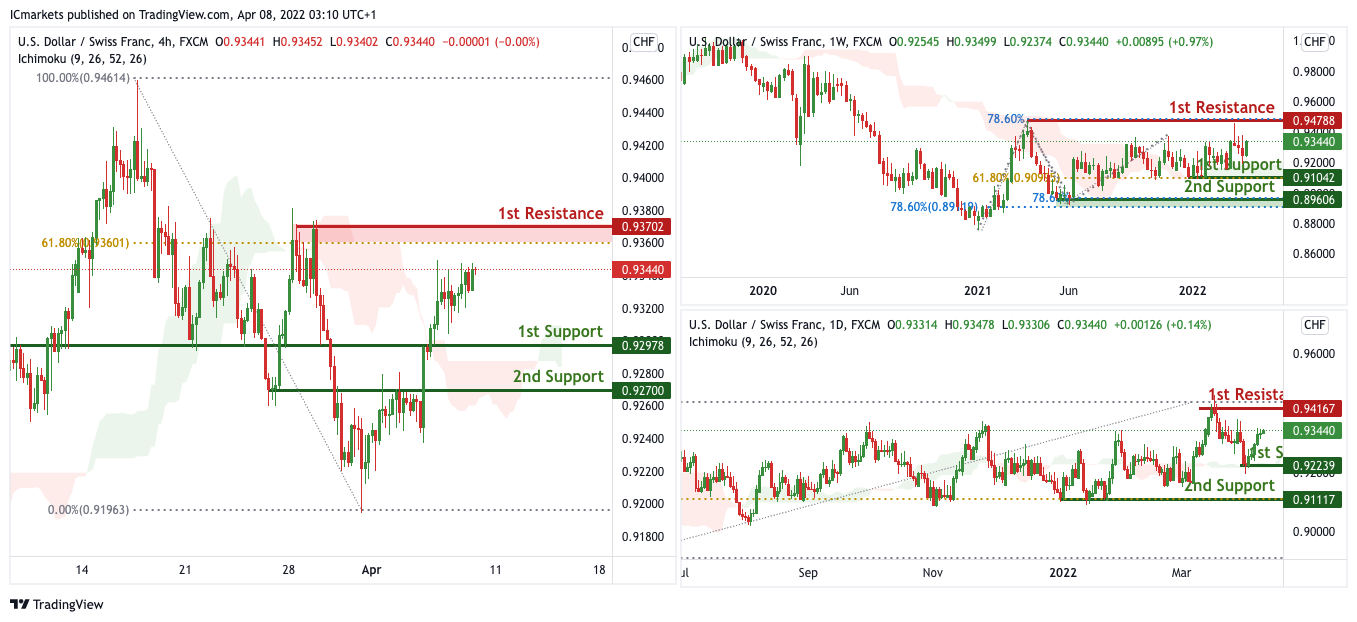
USD/CHF:
On the Weekly, with price moving above the ichimoku cloud, we have a bias that price will rise to our 1st resistance from our 1st support. Alternatively, price may break 1st support structure and head for 2nd support.
On the Daily, with price moving above the ichimoku cloud, we have a bias that price will rise to our 1st resistance from our 1st support. Alternatively, price may break 1st support structure and head for 2nd support.
On the H4, with price moving above the ichimoku cloud and the recent break of the channel, we have a bias that price will rise to our 1st resistance at 0.93720 in line with the 61.8% Fibonacci retracement from our 1st support at 0.92978 in line with the horizontal pullback support. Alternatively, price may break 1st support structure and head for 2nd support at 0.92700 in line with the swing pullback support.
Areas of consideration
- 1st support level at 0.92978
- 1st resistance level at 0.93720
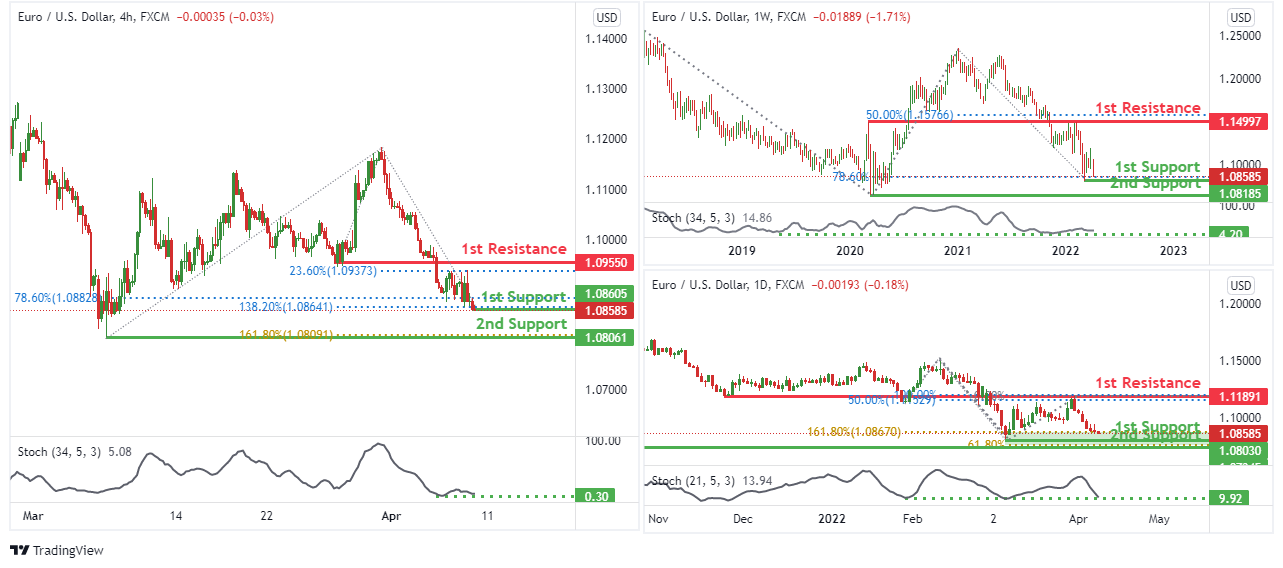
EUR/USD :
On the weekly timeframe, price is near 1st support level of 1.08185 in line with 78.6% fibonacci retracement. It can potentially bounce up to 1st resistance level of 1.14997 in line with 50% fibonacci retracement. Our bullish bias is supported by the stochastic indicator where price is near support level.
On the daily timeframe, price is 1st support level of 1.08585 in line with 161.8% fibonacci extension. It can potentially bounce up to 1st resistance level of 1.11891 in line with 50% fibonacci retracement and 100% fibonacci projection. Our bullish bias is supported by the stochastic indicator where price is near support level.
On the H4 timeframe, prices are at a key pivot. We see the potential for a bounce from our 1st support at 1.08605 which is an area of Fibonacci confluences towards our 1st resistance at 1.09550 in line with 23.6% Fibonacci retracement. Our bullish bias is supported by the stochastic indicator where price is near support level.
Areas of consideration :
- H4 1st resistance at 1.09550
- H4 1st support at 1.08605
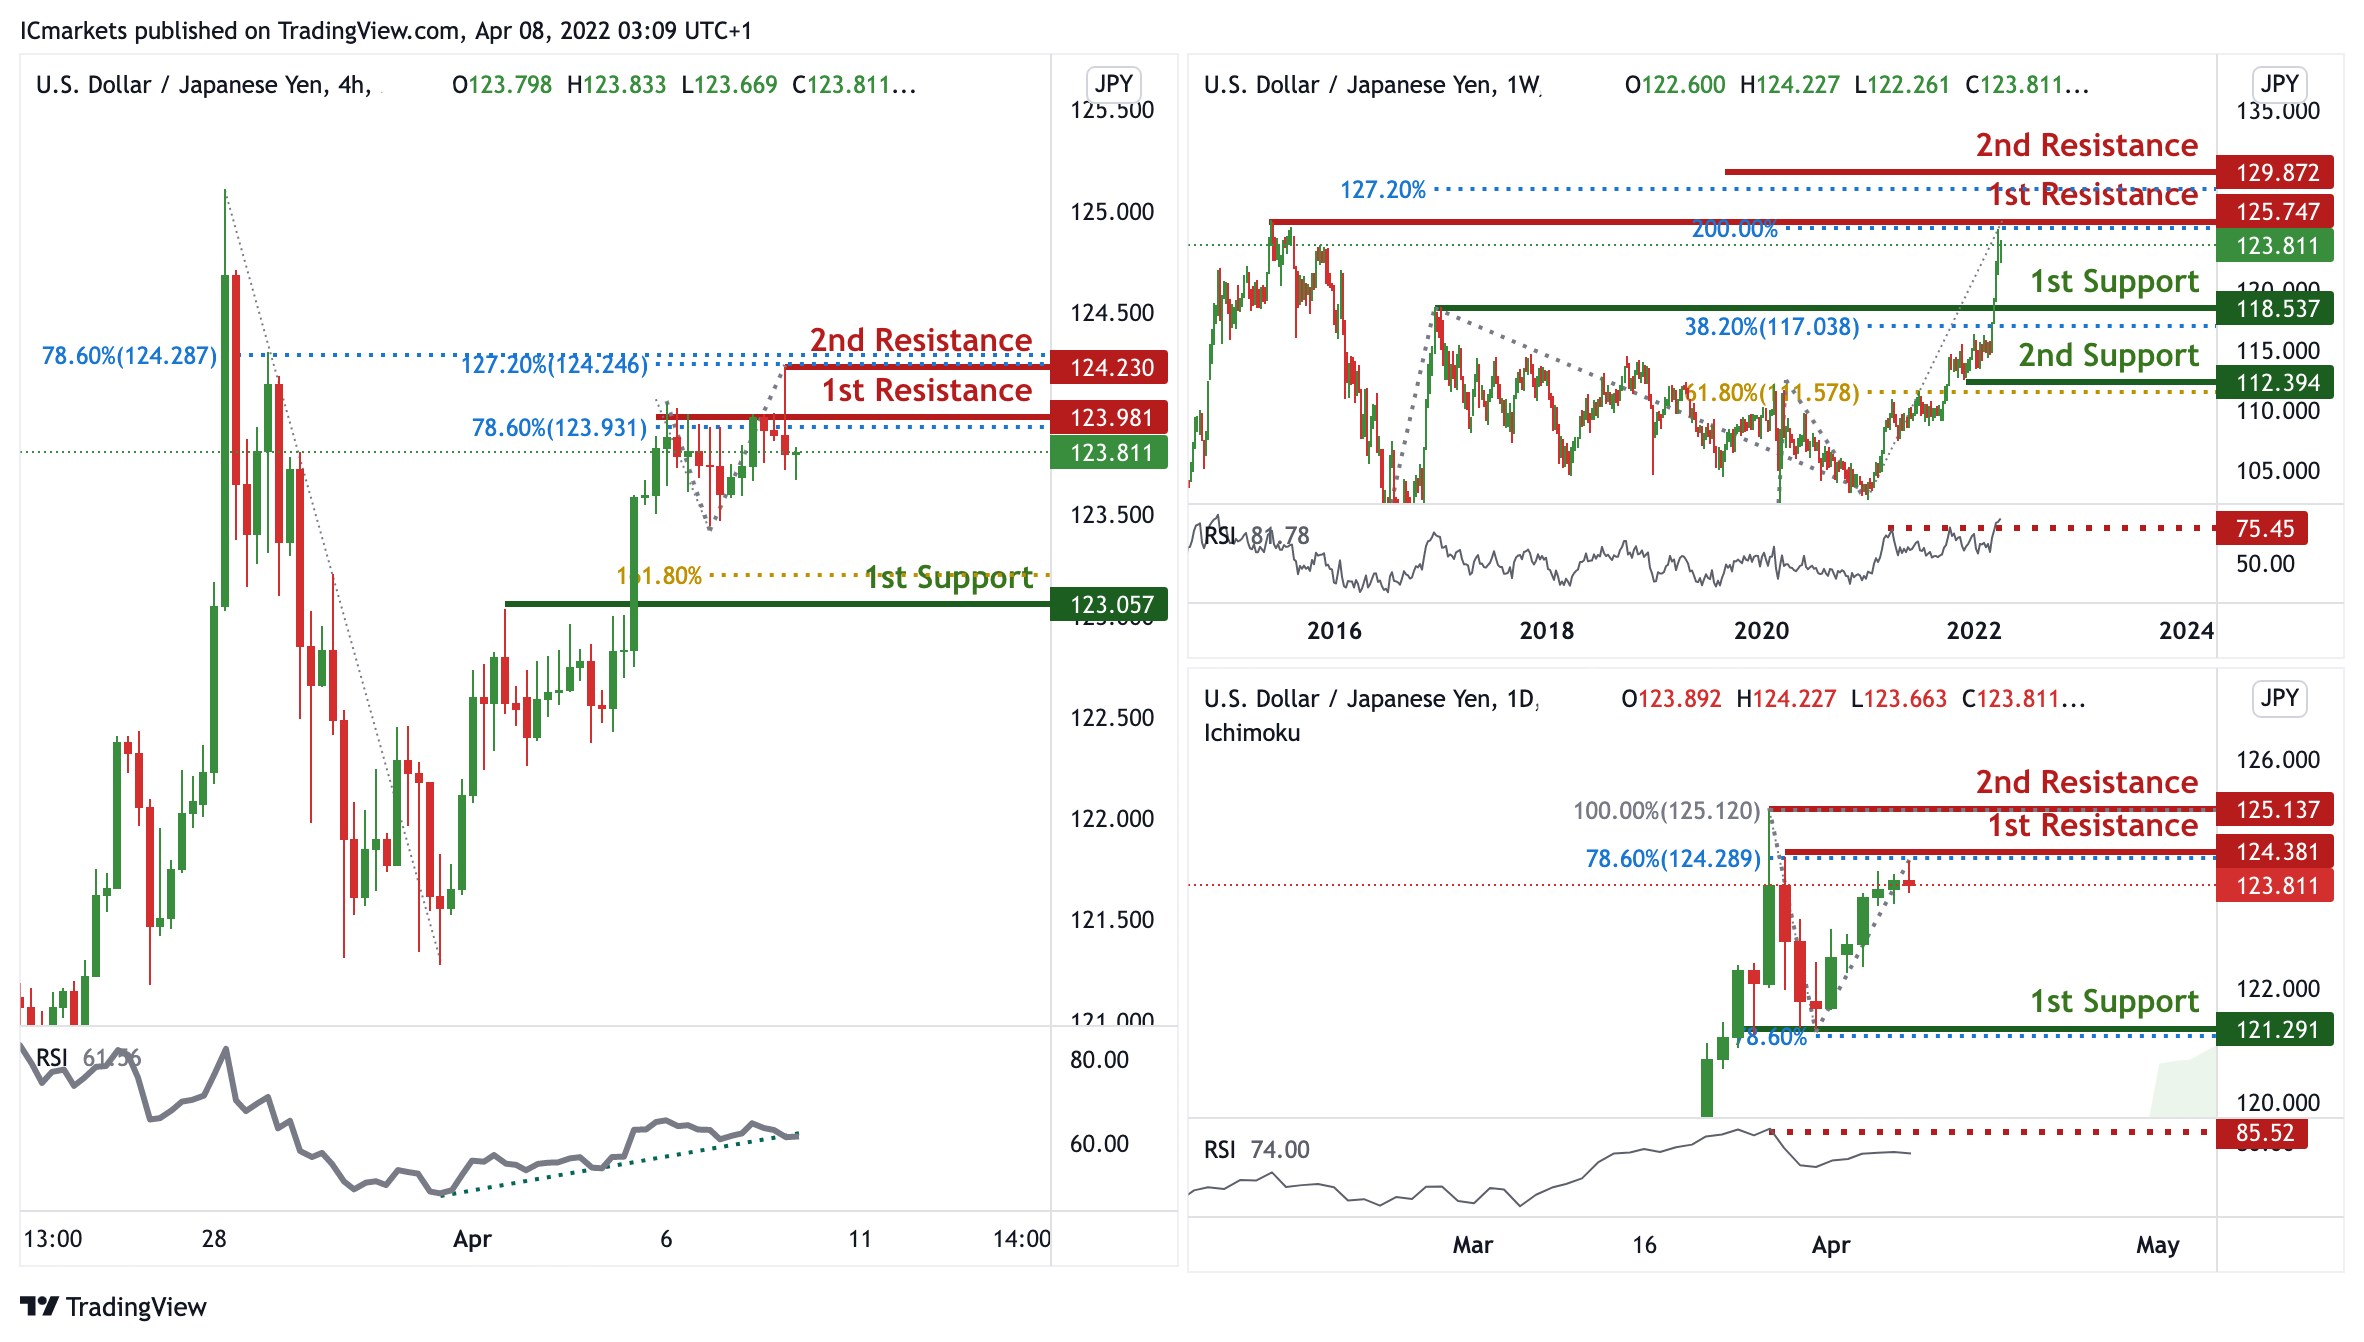
USD/JPY:
On the weekly, prices are on bullish momentum and approaching a key pivot. We see the potential for a dip from our 1st resistance at 125.747 in line with 200% Fibonacci Projection towards our 1st support at 118.537 in line with 38.2% Fibonacci retracement. RSI is at levels where dips previously occurred. On the daily, prices are approaching a key pivot. We see the potential for dip from our 1st resistance at 124.381 in line with 78.6% Fibonacci Projection towards our 1st support at 121.291 in line with 78.6% Fibonacci projection. RSI is at levels where dips previously occurred. On the H4 timeframe, prices are at a pivot. We see the potential for a dip from our 1st resistance at 123.981 in line with 78.6% Fibonacci projection towards our 1st support at 123.057 in line with 161.8% Fibonacci Projection. Bearish divergence is spotted on RSI, further supporting our bearish bias.
Areas of consideration:
- H4 time frame, 1st resistance at 123.981
- H4 time frame, 1st support at 123.057
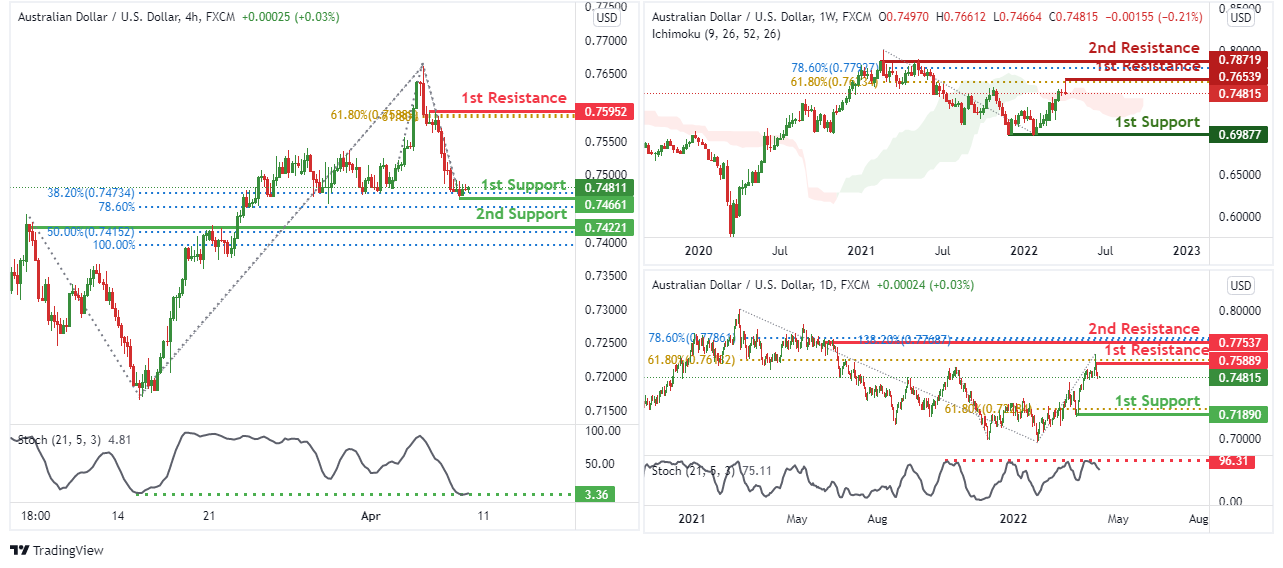
AUD/USD:
On the weekly timeframe, price is near to 1st resistance level of 0.76539 in line with 61.8% fibonacci retracement. Price can potentially dip to 1st support level of 0.69813 which is in line with 100% fibonacci projection. Our bearish bias is supported by price trading below the ichimoku cloud indicator.
On the daily timeframe, price is near to 1st resistance level of 0.75575 in line with 50% fibonacci retracement, 61.8% fibonacci projection and 161.8% fibonacci extension. Price can potentially bearish dip to 1st support level of 0.71890 which is in line with 100% fibonacci projection. Our bearish bias is supported by the stochastic indicator where price is at resistance level.
On the H4 timeframe, we see the potential for a bullish bounce from our 1st support level at 0.74716 in line with 23.6% Fibonacci retracement towards our 1st resistance at 0.75951 in line with 61.8% Fibonacci retracement and 61.8% fibonacci projection. Our bearish bias is supported by the stochastic indicator where price is at support level.
Areas of consideration
- H4 1st resistance at 0.75951
- H4 1st support at 0.74716
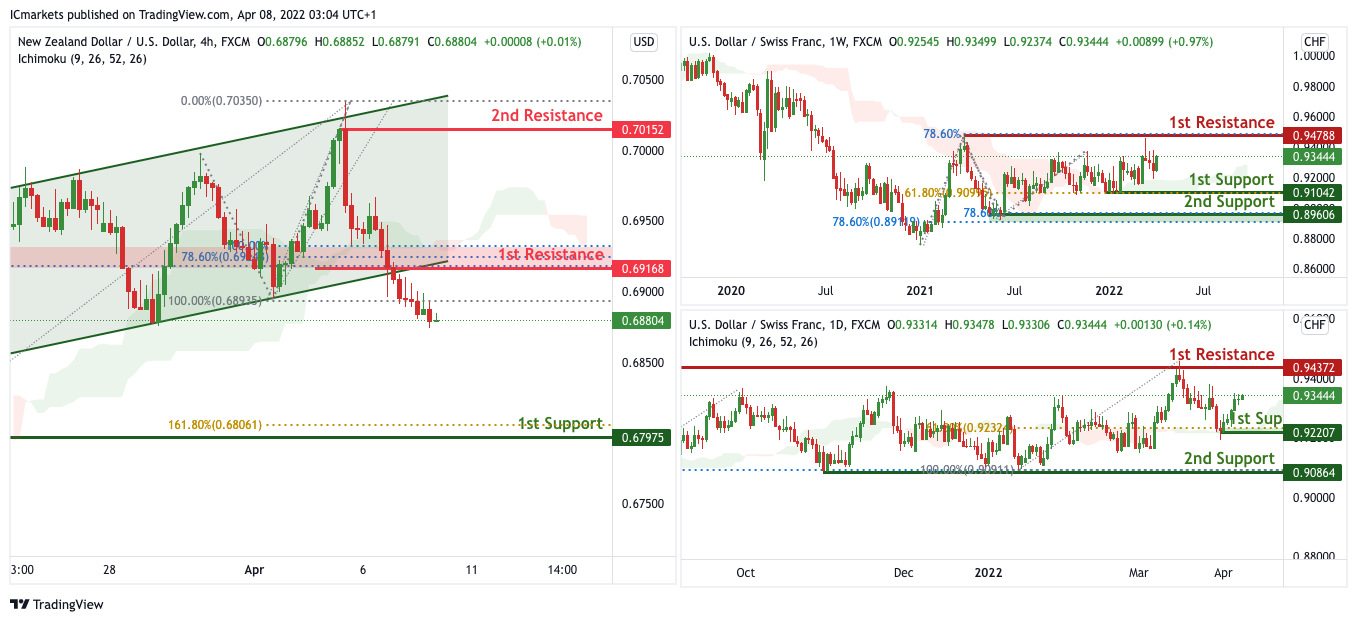
NZD/USD:
On the Weekly, with price moving above the ichimoku cloud, we have a bias that price will rise to our 1st resistance from our 1st support. Alternatively, price may break 1st support structure and head for 2nd support.
On the Daily, with price moving above the ichimoku cloud, we have a bias that price will rise to our 1st resistance from our 1st support. Alternatively, price may break 1st support structure and head for 2nd support.
On the H4, with price moving below our ichimoku cloud, we expect to see a potential for bearish drop from our 1st resistance of 0.69168 in line with the 23.6% fibonacci retracement and 61.8% Fibonacci projection towards our 1st support level at 0.67975 in line with the 161.8% Fibonacci extension. Alternatively, If price breaks out, it can potentially move towards our 2nd resistance level at 0.70152 which is in line with the swing high resistance.
Areas of consideration:
- H4 time frame, 1st support at 0.67975
- H4 time frame, 1st resistance at 0.69168
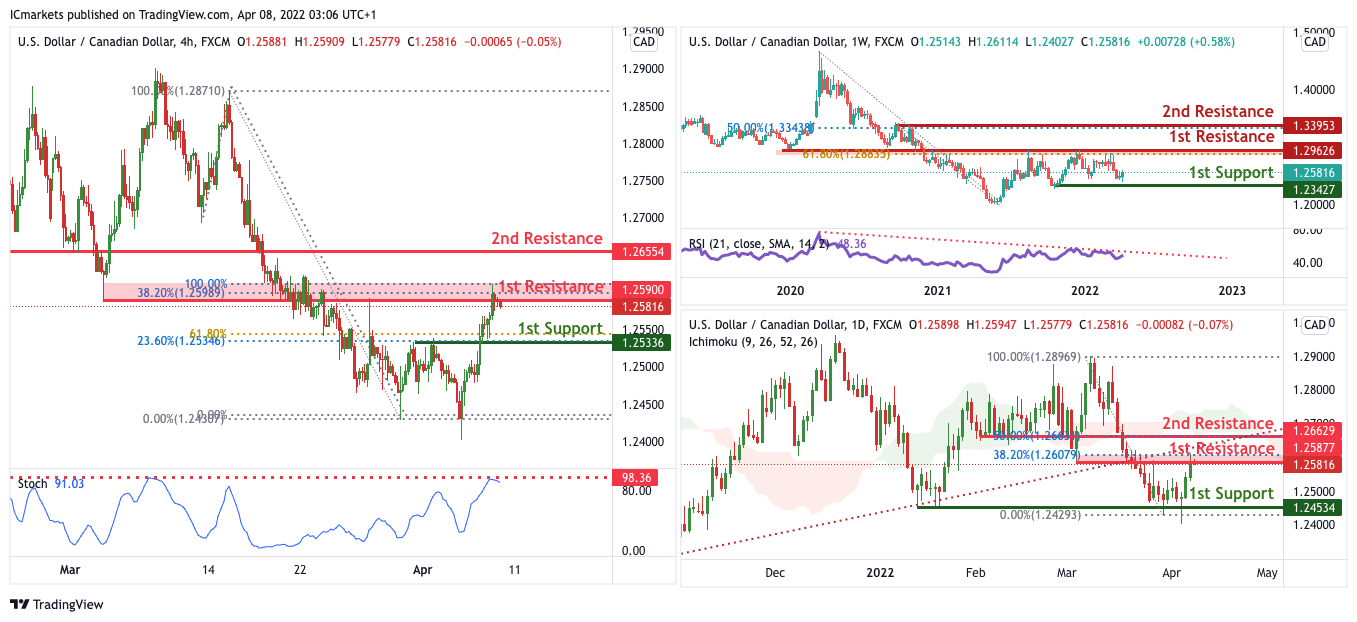
USD/CAD:
On the Weekly, with price expected to reverse off the stochastics indicator, we have a bias that price will drop to our 1st support from our 1st resistance. Alternatively, price may break 1st resistance and head for 2nd resistance.
On the Daily, with price moving below the ichimoku cloud, we have a bias that price will drop to our 1st support from our 1st resistance. Alternatively, price may break 1st resistance and head for 2nd resistance.
On the H4, with price expected to reverse off the stochastic indicator, we expect to see a potential for bearish drop from our 1st resistance of 1.25811 in line with the 38.2% fibonacci retracement and 100% Fibonacci projection towards our 1st support level at 1.25336 in line with 23.6% Fibonacci retracement and 61.8% Fibonacci retracement. Alternatively, If price breaks out, it can potentially move towards our 2nd resistance level at 1.26554 which is in line with the pullback support.
Areas of consideration:
- H4 time frame, 1st support at 1.25336
- H4 time frame, 1st resistance at 1.25811
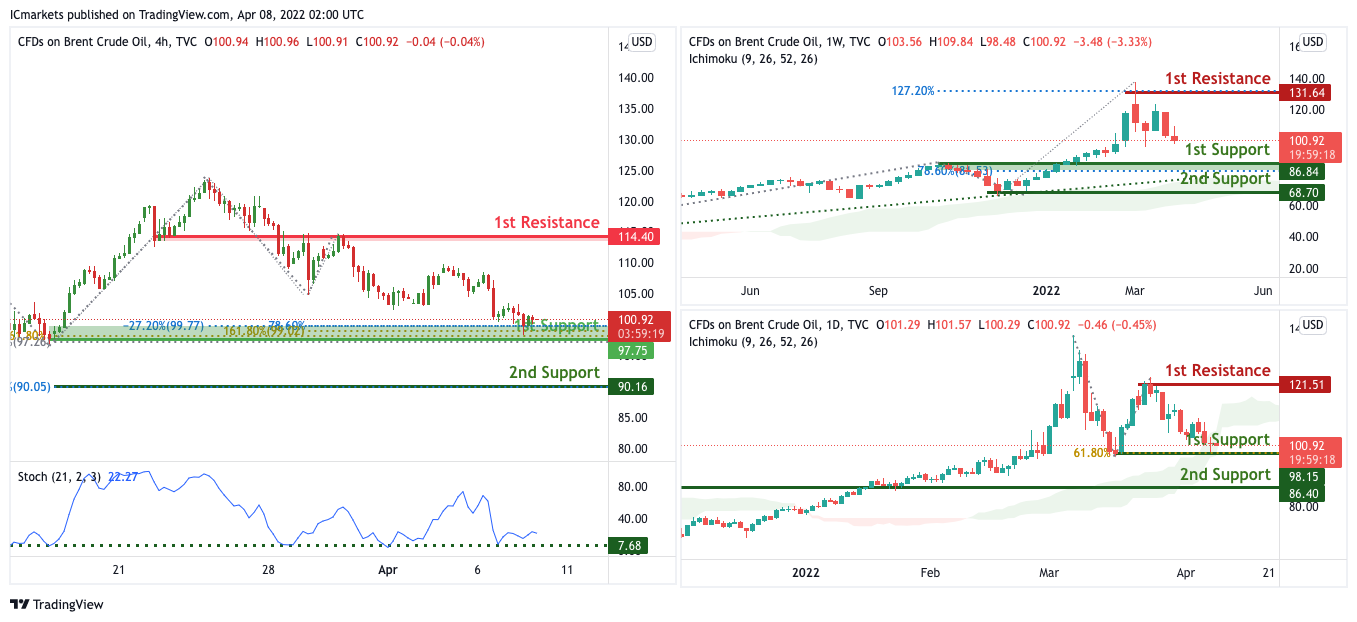
OIL:
On the Weekly, with price moving above the ichimoku cloud, we have a bias that price will rise to our 1st resistance from our 1st support. Alternatively, price may break 1st support structure and head for 2nd support.
On the Daily, with price moving above the ichimoku cloud, we have a bias that price will rise to our 1st resistance from our 1st support. Alternatively, price may break 1st support structure and head for 2nd support.
On the H4, with price expected to bounce off the support of the stochastics indicator, we have a bias that price will rise to our 1st resistance at 114.40 in line with the horizontal pullback resistance from our 1st support at 101.71 in line with the horizontal overlap support, 78.6% Fibonacci projection. Alternatively, price may break 1st support structure and head for 2nd support at 90.16 in line with the 127.2% Fibonacci extension
Areas of consideration:
- H4 time frame, 1st resistance of 114.40
- H4 time frame, 1st support of 101.71
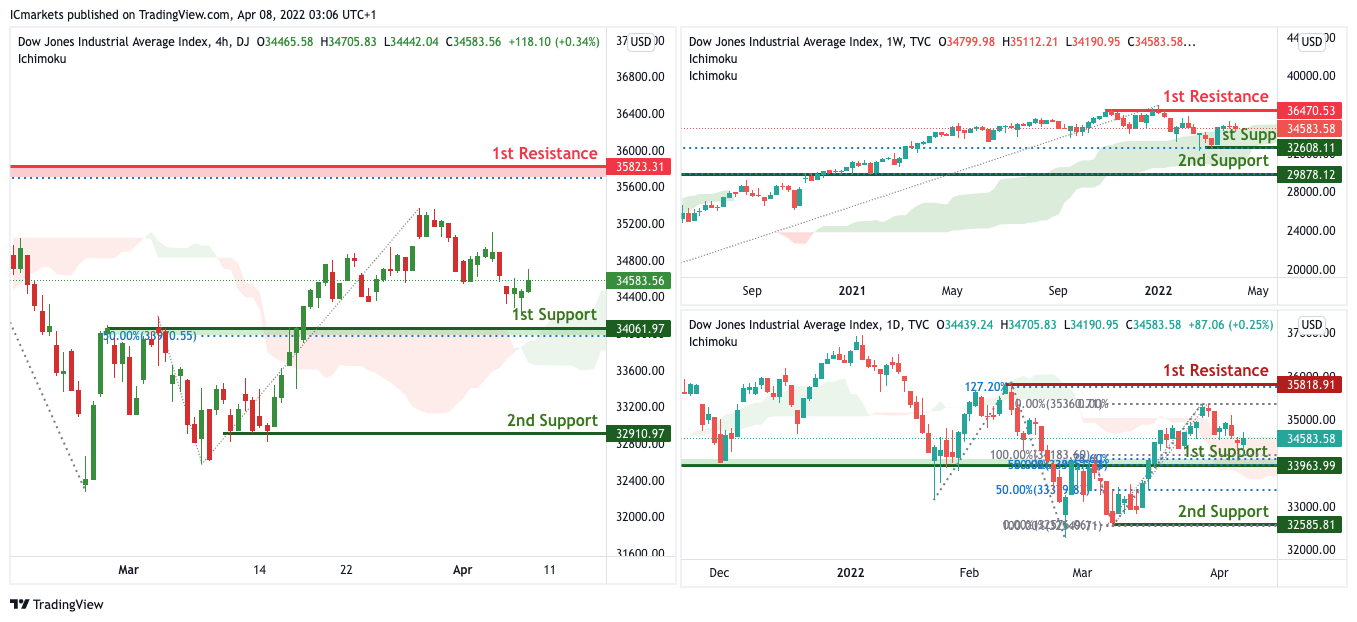
Dow Jones Industrial Average:
On the Weekly, with price moving above the ichimoku cloud, we have a bias that price will rise to our 1st resistance from our 1st support. Alternatively, price may break 1st support structure and head for 2nd support.
On the H4, with price moving above the ichimoku cloud, we have a bias that price will rise to our 1st resistance from our 1st support. Alternatively, price may break 1st support structure and head for 2nd support.
On the H4, with price moving above the ichimoku cloud, we have a bias that price will rise to our 1st resistance at 35823 in line with the 127.2% Fibonacci extension from our 1st support at 34061 in line with the horizontal pullback support and 50% Fibonacci retracement. Alternatively, price may break 1st support structure and head for 2nd support at 32910 in line with the horizontal swing low support.
Areas of consideration :
- H4 1st support at 34569
- H4 1st resistance at 35823


